The Belle Collaboration
Measurement of the Moments of the
Photon Energy Spectrum in Decays and
Determination of and at Belle
Abstract
Using the previous Belle measurement of the inclusive photon energy in decays, we determine the first and second moments of this spectrum for minimum photon energies in the meson rest frame ranging from 1.8 to 2.3 GeV. Combining these measurements with recent Belle data on the lepton energy and hadronic mass moments in decays, we perform fits to theoretical expressions derived in the 1S and kinetic mass schemes and extract the magnitude of the Cabibbo-Kobayashi-Maskawa (CKM) matrix element , the -quark mass and other non-perturbative parameters. In the 1S scheme analysis we find and GeV. In the kinetic scheme, we obtain and GeV.
pacs:
12.15.Ff,12.15.Hh,12.39.Hg,13.20.HeI Introduction
The most precise determinations of the Cabibbo-Kobayashi-Maskawa (CKM) matrix element Kobayashi:1973fv are obtained using combined fits to inclusive decay distributions Bauer:2004ve ; Buchmuller:2005zv ; Abdallah:2005cx ; :2007yaa . These analyses are based on calculations of the semileptonic decay rate and spectral moments in and decays in the frameworks of the Operator Product Expansion (OPE) and the Heavy Quark Effective Theory (HQET) Bauer:2004ve ; Benson:2003kp ; Gambino:2004qm ; Benson:2004sg , which predict these quantities in terms of and a number of non-perturbative heavy quark (HQ) parameters including the -quark mass .
Analyses combining measurements from different experiments Bauer:2004ve ; Buchmuller:2005zv quote the most precise numbers for and . However, as the correlated systematic uncertainties are not precisely known, there is some concern that uncertainties are underestimated. In this analysis, we have chosen the opposite approach and perform fits to the data from the Belle experiment only. In addition, we use two independent sets of theoretical expressions, derived in the 1S Bauer:2004ve and kinetic mass Gambino:2004qm ; Benson:2004sg schemes respectively, to test the compatibility of these two frameworks.
The present document is organized as follows: Sect. II describes the measurement of the first and second moment of the inclusive photon energy spectrum in , and , using the Belle measurement of this decay in Ref. Koppenburg:2004fz . In the previously published analysis the first and second moments were obtained for one value of the minimum energy threshold, namely GeV. Here we report additional measurements with GeV, and perform a re-evaluation of the systematic error. In Sect. III we use these data together with the recent Belle measurements of the lepton energy and hadronic mass moments in decays Urquijo:2006wd ; Schwanda:2006nf to extract and using theoretical expressions derived in the 1S and kinetic mass schemes.
II Moments of the photon energy spectrum
II.1 Review of the Belle Measurement
The analysis described in Ref. Koppenburg:2004fz uses events equivalent to 140 fb-1 of integrated luminosity (ON sample) and 15 fb-1 taken 60 MeV below the resonance energy (OFF sample). Photon candidates with energy greater than 1.5 GeV as measured in the rest frame are reconstructed. Vetoes are applied to photon candidates with high likelihood of originating from or decays to two photons.
In general, the background of photons from the continuum is dominant. It is suppressed with event shape variables used as the inputs to two Fisher discriminants Fisher:1936et . The first discriminant distinguishes spherically-shaped from jet-like continuum events and includes the Fox-Wolfram moments Fox:1978vu , the thrust calculated using all particles detected in the event including and excluding the candidate photon, and the angles of the corresponding thrust axes with respect to the beam and candidate photon directions, respectively. The second discriminant is designed to exploit the topology of events by utilizing the energy sum of detected particles, which is measured in three angular regions bounded by cones that are subtended from the direction of the candidate photon in the frame; defined as (forward), (middle), and (backward).
After these selections are applied, the remaining continuum background is removed by subtracting scaled OFF data from the ON data set. Backgrounds in events, including photons from and (veto leakage), other real photons (mainly from , , and ), clusters in the calorimeter not due to single photons (mainly electrons interacting with matter, and ) and beam background, are estimated from Monte Carlo (MC) simulation (Fig. 1).


II.2 Moment Measurements
We calculate the truncated first and second moments, and , of the efficiency corrected spectrum in Fig. 1 for minimum photon energies ranging from 1.8 to 2.3 GeV. The following corrections are applied to these moments: The non-zero meson momentum in the rest frame changes the first moment of the photon energy by 0.2% and adds a Doppler broadening of 0.006 GeV2 to the second moment; the finite energy resolution, uncorrected in Fig. 1, causes a broadening of the spectrum and increases the second moment by 0.004 GeV2; the 100 MeV binning in Fig. 1 increases the second moment by 0.0008 GeV2.
The above corrections assume a symmetric photon energy distribution, and do not account for expected and known asymmetries in the true spectrum and detector response, respectively. To account for these effects an additional bias correction, derived from a MC simulation, is implemented. The model contains decays of the form , where is any known spin- resonance with strangeness . The relative amounts of these decays are adjusted by matching the total photon spectrum to the theoretical model of Ref. Kagan:1998ym . The bias correction, calculated as the difference of the true moment and the moment measured in the MC simulation once all aforementioned corrections are applied, is listed in Table 1.
| (GeV) | ||
|---|---|---|
| 1.8 | +2.0% | 0.0% |
| 1.9 | +1.6% | -0.4% |
| 2.0 | +1.2% | -7.1% |
| 2.1 | +0.8% | -17.4% |
| 2.2 | +0.2% | -35.3% |
| 2.3 | -0.3% | -57.9% |
II.3 Systematic Uncertainties
The error bars of the efficiency corrected spectrum of Fig. 1 show the total error including the systematic uncertainty related to the scaling of the MC background samples (sizable in the first energy bins). In the calculation of the moments, we consider also the following sources of systematic uncertainty: uncertainty in the OFF data scaling factor; possible difference in ON and OFF data selection efficiencies; uncertainty in the data/MC correction; we vary by the background from , and bremsstrahlung; uncertainty of the veto efficiency; we consider an alternate signal MC that favors high-mass resonances decaying into high-multiplicity final states, where the fraction of final states, somewhat overestimated in our default sample, matches our previous measurement Nishida:2003yw ; and we vary the photon detection efficiency in both signal and background samples by its measured uncertainty ().
We also assign systematic uncertainties to the corrections applied to the moments: an alternate energy resolution correction that neglects the lower energy tail in the resolution is implemented and the difference is assigned as systematic uncertainty; a uncertainty on the binning correction for the second moment is assigned; we also implement a variation on the bias correction for the first moment while for the second moment the correction is re-calculated using the alternate signal MC sample.
The total systematic uncertainty on each moment measurement is obtained by summing the aforementioned contributions in quadrature (Tables 2 and 3).
| (GeV) | 1.8 | 1.9 | 2.0 | 2.1 | 2.2 | 2.3 |
|---|---|---|---|---|---|---|
| MC scaling | 0.021 | 0.012 | 0.006 | 0.003 | 0.002 | 0.001 |
| OFF scaling | 0.004 | 0.001 | 0.001 | 0.002 | 0.002 | 0.002 |
| ON/OFF efficiency | 0.000 | 0.000 | 0.000 | 0.000 | 0.000 | 0.000 |
| data/MC correction | 0.005 | 0.003 | 0.002 | 0.001 | 0.000 | 0.000 |
| other s in | 0.010 | 0.004 | 0.002 | 0.000 | 0.000 | 0.000 |
| veto efficiency | 0.001 | 0.001 | 0.000 | 0.000 | 0.000 | 0.000 |
| signal MC | 0.004 | 0.004 | 0.004 | 0.004 | 0.004 | 0.003 |
| efficiency | 0.001 | 0.001 | 0.000 | 0.000 | 0.000 | 0.000 |
| bias correction | 0.022 | 0.018 | 0.014 | 0.009 | 0.002 | 0.003 |
| total systematic | 0.033 | 0.023 | 0.016 | 0.010 | 0.005 | 0.004 |
| (GeV) | 1.8 | 1.9 | 2.0 | 2.1 | 2.2 | 2.3 |
|---|---|---|---|---|---|---|
| MC scaling | 0.0060 | 0.0027 | 0.0009 | 0.0003 | 0.0001 | 0.0001 |
| OFF scaling | 0.0018 | 0.0010 | 0.0006 | 0.0005 | 0.0005 | 0.0004 |
| ON/OFF efficiency | 0.0000 | 0.0000 | 0.0000 | 0.0000 | 0.0000 | 0.0000 |
| data/MC correction | 0.0010 | 0.0004 | 0.0001 | 0.0000 | 0.0000 | 0.0000 |
| other s in | 0.0024 | 0.0008 | 0.0002 | 0.0000 | 0.0000 | 0.0000 |
| veto efficiency | 0.0003 | 0.0001 | 0.0000 | 0.0000 | 0.0000 | 0.0000 |
| signal MC | 0.0007 | 0.0005 | 0.0004 | 0.0003 | 0.0002 | 0.0000 |
| efficiency | 0.0003 | 0.0001 | 0.0000 | 0.0000 | 0.0000 | 0.0000 |
| energy resolution | 0.0020 | 0.0020 | 0.0021 | 0.0022 | 0.0023 | 0.0024 |
| binning | 0.0008 | 0.0008 | 0.0008 | 0.0008 | 0.0008 | 0.0008 |
| bias correction | 0.0068 | 0.0040 | 0.0026 | 0.0005 | 0.0004 | 0.0011 |
| total systematic | 0.0099 | 0.0055 | 0.0036 | 0.0024 | 0.0025 | 0.0028 |
II.4 Results
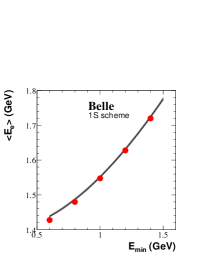
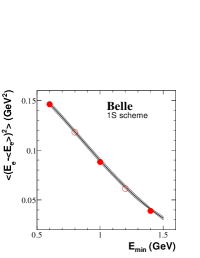
The measurements of the first and second moments of the photon energy spectrum in for minimum photon energies ranging from 1.8 GeV to 2.3 GeV are shown in Table 4 and Fig. 2. Our results agree with the data from CLEO Chen:2001fja and BaBar Aubert:2005cua .
| (GeV) | (GeV) | |
|---|---|---|
| 1.8 | ||
| 1.9 | ||
| 2.0 | ||
| 2.1 | ||
| 2.2 | ||
| 2.3 |


The statistical and systematic errors on the first and second moments at GeV are slightly different from the values quoted in Ref. Koppenburg:2004fz and supersede our previously published values. The change in the uncertainties is due to the use of the toy MC approach and to the additional contribution from the uncertainty in the bias correction.
The correlations between the different moment measurements are estimated using a toy MC approach: Starting from the efficiency corrected spectrum in Fig. 1 we create new spectra by generating values of a Gaussian random variable for the contents of each bin, where the mean and standard deviation of the Gaussian correspond to the bin yield and its uncertainty in the original spectrum. The moments and their fluctuations with respect to each other were measured for each generated spectrum, and finally averaged to yield the covariance matrix, from which the uncertainties due to statistics and systematics scaling were obtained. The covariance matrix was also obtained from systematic variations due to the aforementioned corrections to the moments. The method assumes 100% correlation of any two truncated moments due to any single systematic variation. The covariance matrices that are derived from statistics and systematics are added to yield the overall covariance matrix, from which the correlations between any of the truncated moments are deduced. Tables 57 show the correlation coefficients derived from this study.
| (GeV) | 1.8 | 1.9 | 2.0 | 2.1 | 2.2 | 2.3 | |
|---|---|---|---|---|---|---|---|
| 1.8 | |||||||
| 1.9 | |||||||
| 2.0 | |||||||
| 2.1 | |||||||
| 2.2 | |||||||
| 2.3 | |||||||
| (GeV) | 1.8 | 1.9 | 2.0 | 2.1 | 2.2 | 2.3 | |
|---|---|---|---|---|---|---|---|
| 1.8 | |||||||
| 1.9 | |||||||
| 2.0 | |||||||
| 2.1 | |||||||
| 2.2 | |||||||
| 2.3 | |||||||
| (GeV) | 1.8 | 1.9 | 2.0 | 2.1 | 2.2 | 2.3 | |
|---|---|---|---|---|---|---|---|
| 1.8 | |||||||
| 1.9 | |||||||
| 2.0 | |||||||
| 2.1 | |||||||
| 2.2 | |||||||
| 2.3 | |||||||
To cross-check these moment measurements, we extract the moments from the Kagan-Neubert (KN) photon spectrum Kagan:1998ym tuned to fit our data Limosani:2004jk ( GeV, GeV2). We generate the photon spectrum in the rest frame of the meson with these parameters and extract the moments in the range GeV. The results are plotted in Fig. 3 along with the moment measurements presented here. We find very good agreement between these independent methods.


III Extraction of and from inclusive decays
III.1 Experimental Inputs
Belle has measured the partial branching fractions and the first, second, third and fourth moments of the truncated electron energy spectrum in , , , and , for nine different electron energy thresholds (, 0.6, 0.8, 1.0, 1.2, 1.4, 1.6, 1.8 and 2.0 GeV) Urquijo:2006wd . This analysis uses events equivalent to 140 fb-1 of integrated luminosity. The hadronic decay of one meson is fully reconstructed and decays of the other are selected by requiring an identified electron amongst the particles remaining in the event.
In addition, Belle has measured the first, second central and second non-central moments of the hadron invariant mass squared () spectrum in , , and , for seven different lepton energy thresholds (, 0.9, 1.1, 1.3, 1.5, 1.7 and 1.9 GeV) Schwanda:2006nf . This analysis is also based on 140 fb-1 of data. Again, one meson is fully reconstructed and a charged lepton (electron or muon) from the decay of the other is required. The hadronic system is reconstructed by summing the 4-momenta of the particles remaining in the event.
The measurements of the first and second moments of the photon energy spectrum in , and , have been described previously in this document. They are available for six different photon energy thresholds (, 1.9, 2.0, 2.1, 2.2 and 2.3 GeV).
Hence, there are a total of 71 Belle measurements of inclusive spectra in decays available for the global analysis ref:1 . The measurements actually used in the 1S and kinetic mass scheme fit analyses are shown in Table 8: We have excluded measurements that do not have corresponding theoretical predictions; measurements with high cut-offs (i.e., electron energy and hadronic mass moments with GeV and photon energy moments with GeV) are not used to determine the HQ parameters, as theoretical expressions are not considered reliable in this region Benson:2004sg ; Uraltsev:2003bw ; finally, we have also excluded measurements where correlations with neighboring points are too high as these measurements do not add new information to the fit and introduce numerical problems such as negative eigenvalues of the covariance matrix.
| Measurements used | |
|---|---|
| : , 1.0, 1.4 GeV | |
| Lepton energy moments | : , 0.8, 1.0, 1.2, 1.4 GeV |
| : , 1.0, 1.4 GeV | |
| : , 1.0, 1.2 GeV | |
| Hadronic mass moments | : , 1.1, 1.3, 1.5 GeV |
| : , 0.9, 1.3 GeV | |
| Photon energy moments | : , 2.0 GeV |
| : , 2.0 GeV |
The value of is dependent on the average lifetime of neutral and charged mesons. In the following analyses we use ps based on Ref. Barberio:2007cr and assume equal production of charged and neutral mesons.
III.2 1S Mass Scheme Analysis
III.2.1 Theoretical Input
The parameters appearing in the OPE depend on the choice of the mass scheme, i.e., the definition of . The 1S scheme eliminates the -quark pole mass by relating it to the mass of the . Truncated spectral moments in have been derived in this scheme up to Bauer:2004ve . The theoretical expressions are of the form
| (1) |
where stands for any experimental observable in Table 8 and , , are perturbatively calculable coefficients that depend on . The computations include radiative contributions of and , the so-called BLM contribution at . The HQ parameters are at leading order, and at , and , , , , and at . The CKM magnitude enters through the predictions of the partial semileptonic branching fractions,
| (2) |
where is the 1S reference mass, , ps-1, and is an expression of the form of Eq. 1.
The analysis in the 1S mass scheme determines a total of seven parameters: , , , , , and . Following the prescriptions in Ref. Bauer:2004ve , is set to zero and the measured and mass splittings allow us to constrain some of the HQET matrix elements in Eq. 1: and . The parameter is the difference between the -quark and the reference mass, . We will present our results in terms of .
III.2.2 The Fit
The expressions in the 1S scheme are fitted to the data using the minimization technique and the MINUIT program James:1975dr . The covariance matrix used in the fit takes into account both experimental and theoretical uncertainties. Following the approach in Ref. Bauer:2004ve , an element of the combined experimental and theoretical error matrix is given by
| (3) |
where and denote the observables and is the experimental correlation matrix element. The total error on the observable is defined as
| for the th hadron moment , | |||||
| for the th lepton moment , | |||||
| (4) | |||||
| for the th photon moment , |
and , and . Here, are the experimental errors, are the coefficients of the last computed terms in the perturbation series (used to estimate the uncertainty on the uncalculated higher order perturbative terms), and is a dimensionless parameter that contains different theoretical uncertainties (uncalculated power corrections, uncalculated effects of order , and effects not included in the OPE, i.e., duality violation). For lepton and hadron moments, we fix Bauer:2004ve . For photon moments, the factor is 0.001 multiplied by the ratio of the energy difference from the endpoint, relative to that for GeV, to account for the increase in shape function effects as one limits the allowed region of the photon spectrum.
As the fit does not provide strong constraints on the parameters, we add the following extra terms to the function,
| (5) |
where (,) are both quantities of , and are the matrix elements of any of the operators in the fit. For the central value of the fit, we take MeV Bauer:2004ve .
III.2.3 Results and Discussion
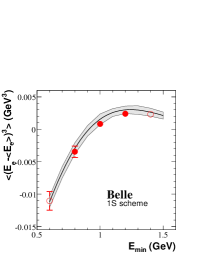
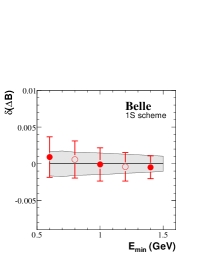
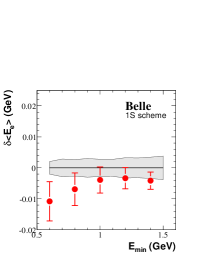
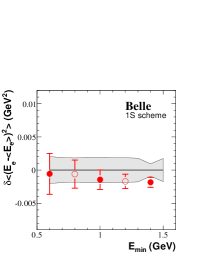
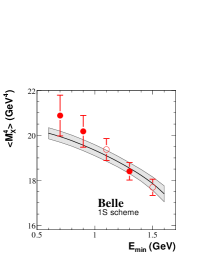
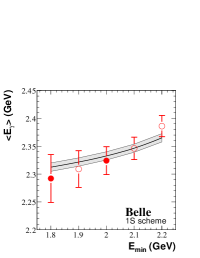
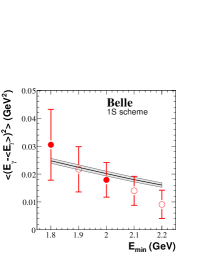
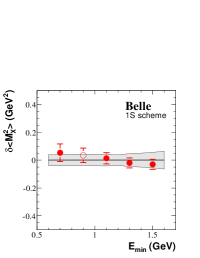
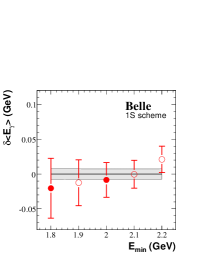
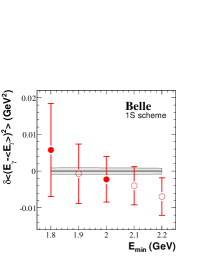
The results for the fit parameters are given in Table 9. Using the measurement of the partial branching fraction at GeV, we obtain for the semileptonic branching fraction (over the full lepton energy range) . A comparison of the measured moments and the 1S scheme predictions is shown in Figs. 4 and 5.
| (10-3) | (GeV) | (GeV2) | (GeV3) | (GeV3) | (GeV3) | (GeV3) | |
| value | 41.56 | 4.723 | 0.303 | 0.067 | 0.125 | 0.101 | 0.125 |
| (fit) | 0.68 | 0.055 | 0.046 | 0.030 | 0.005 | 0.056 | 0.005 |
| () | 0.08 | ||||||
| 1.000 | 0.121 | 0.003 | 0.195 | 0.008 | 0.432 | 0.021 | |
| 1.000 | 0.893 | 0.137 | 0.002 | 0.509 | 0.006 | ||
| 1.000 | 0.410 | 0.041 | 0.429 | 0.045 | |||
| 1.000 | 0.009 | 0.533 | 0.028 | ||||
| 1.000 | 0.005 | 0.000 | |||||
| 1.000 | 0.007 | ||||||
| 1.000 |

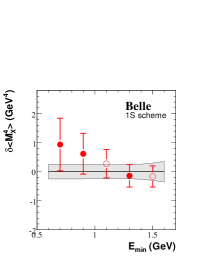
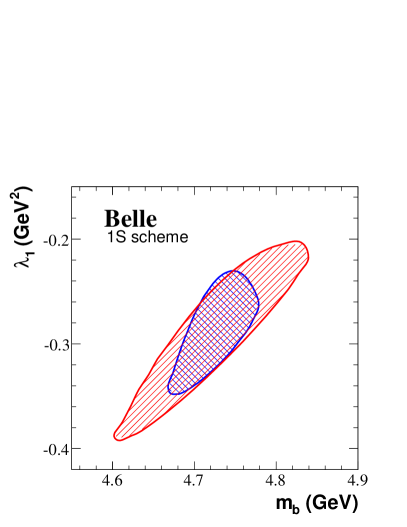
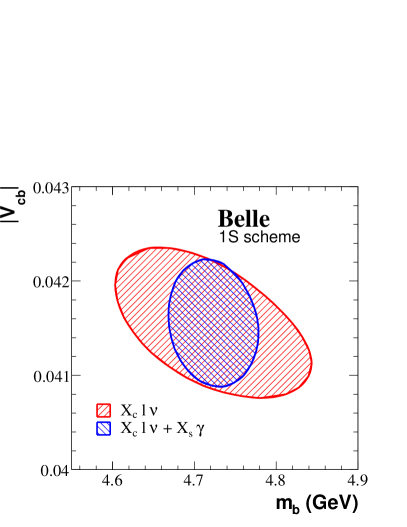
We have verified the stability of the fit by considering the following variations (Table 10): (a) by repeating the fit only for the data (21 measurements); (b) by releasing the constraint on the higher order parameters; (c) by repeating the fit with all theoretical uncertainties set to zero. In Table 10 the default fit corresponds to setup (d). Figure 6 shows the contour plots for the fits corresponding to setups (a) and (d) in Table 10.
| Setup | (10-3) | (GeV) | (GeV2) | |
|---|---|---|---|---|
| (a) | 6.4/14 | |||
| (b) | 5.6/18 | |||
| (c) | 16.6/18 | |||
| (d) | 7.3/18 |
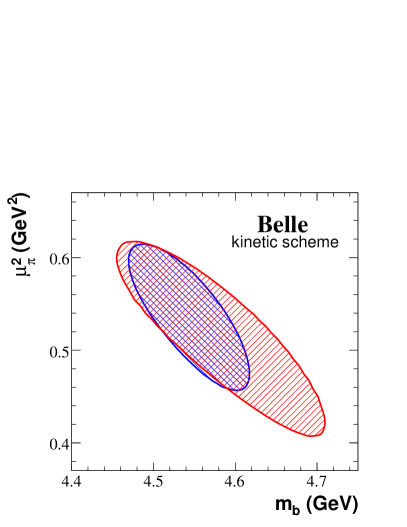
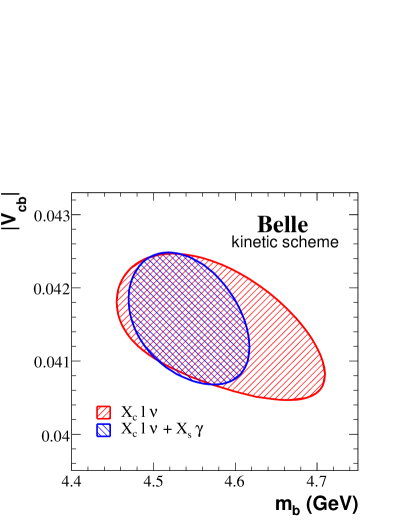
III.3 Kinetic Mass Scheme Analysis
III.3.1 Theoretical Input
Spectral moments of the lepton energy and hadronic mass in decays have been derived in the kinetic mass scheme up to Gambino:2004qm . Compared to the original publication, the theoretical expressions in our fit contain an improved calculation of the perturbative corrections to the lepton energy moments ref:2 and account for the dependence of the perturbative corrections to the hadronic mass moments Uraltsev:2004in . For the photon energy moments in , the (biased) OPE prediction and the bias correction have been calculated Benson:2004sg .
These expressions depend on the following set of non-perturbative parameters: the - and -quark masses and , and at and and at ref:3 . In our analysis, we determine these six parameters together with the semileptonic branching fraction (over the full lepton energy range) . The total number of parameters in the fit is thus seven.
The CKM magnitude is calculated using the following expression Benson:2003kp ,
| (6) | |||||
where is the semileptonic width of the meson.
III.3.2 The Fit
As in the 1S scheme case, the fit is performed using the minimization technique and the MINUIT program James:1975dr . The covariance matrix used is the sum of matrices corresponding to the experimental and theoretical uncertainties. The theoretical covariance matrix is constructed following the recipe in Ref. Gambino:2004qm :
The non-perturbative uncertainties (i.e., the uncertainties related to the expansion) are evaluated by varying and ( and ) by () around their “nominal” values of GeV2, GeV3, GeV2 and GeV3. The perturbative uncertainties (i.e., the uncertainties related to the expansion in ) are estimated by varying within () around the central value of 0.22 (0.3) for the lepton and photon energy (hadronic mass) moments. The difference in the treatment of for the hadronic mass moments is due to the fact that the calculation of the perturbative corrections to these moments is less complete.
The theoretical uncertainty in the moment predictions is the quadratic sum of these different contributions. The theoretical covariance matrix is then constructed by treating these errors as fully correlated for a given moment with different while they are treated as uncorrelated between moments of different order.
For the moments of the photon energy spectrum, we take 30% of the absolute value of the bias correction as its uncertainty. This additional theoretical error is considered uncorrelated for moments with different and different order.
The experimental data from mass splitting and heavy quark sum rules constrain the parameters and to GeV2 and GeV3, respectively. We account for these constraints by adding the following additional terms to the function,
| (7) |
To calculate using Eq. 6 and properly account for the correlations of the HQ parameters, we make a free parameter of the fit, calculate with Eq. 6 and add the following term to the function,
| (8) |
The uncertainty accounts for the experimental uncertainty in and an additional 1.4% theoretical uncertainty in extracting using Eq. 6 Benson:2003kp . We have verified that this method of calculating does not change the fit result for the other parameters.
III.3.3 Results and Discussion
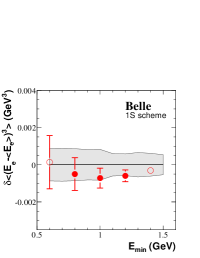
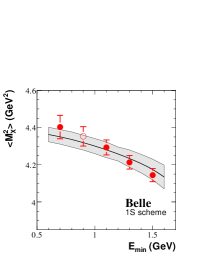
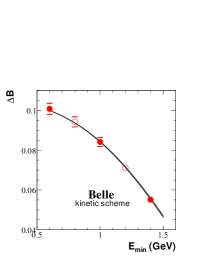
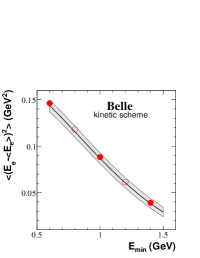
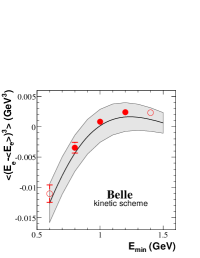
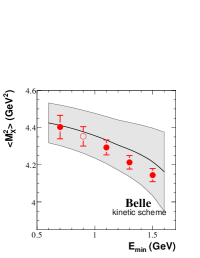
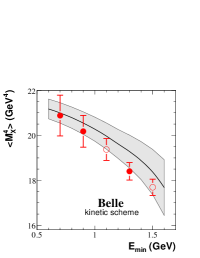
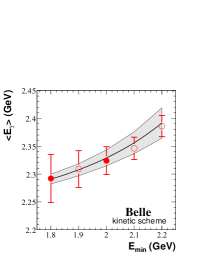
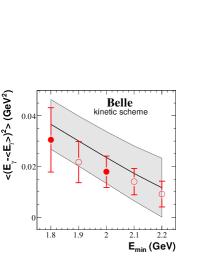
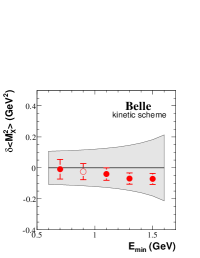
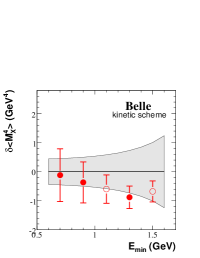
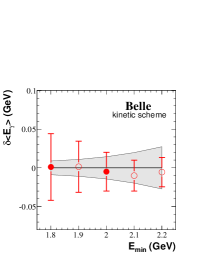
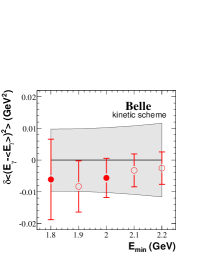
The results of the fit in the kinetic mass scheme are shown in Table 11. The value of the function at the minimum is 4.7 for degrees of freedom. The semileptonic branching fraction is found to be . The comparison of the measurements and the predictions in the kinetic scheme is shown in Figs. 7 and 8.
| (10-3) | (GeV) | (GeV) | (GeV2) | (GeV3) | (GeV2) | (GeV3) | |
| value | 41.58 | 4.543 | 1.055 | 0.539 | 0.166 | 0.362 | 0.153 |
| (fit) | 0.69 | 0.075 | 0.118 | 0.079 | 0.040 | 0.053 | 0.096 |
| 0.08 | |||||||
| (th) | 0.58 | ||||||
| 1.000 | 0.371 | 0.316 | 0.511 | 0.493 | 0.166 | 0.073 | |
| 1.000 | 0.988 | 0.783 | 0.702 | 0.178 | 0.187 | ||
| 1.000 | 0.771 | 0.715 | 0.262 | 0.108 | |||
| 1.000 | 0.777 | 0.205 | 0.080 | ||||
| 1.000 | 0.108 | 0.158 | |||||
| 1.000 | 0.103 | ||||||
| 1.000 |

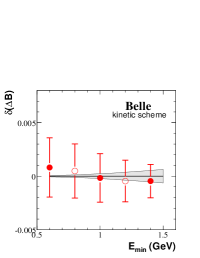
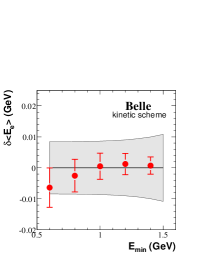
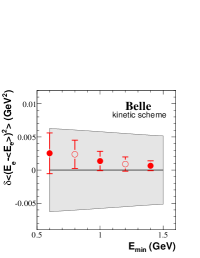
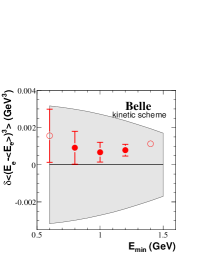
We have repeated the fit using the moments only, excluding data (Table 12). Figure 9 shows the contour plots for the fits corresponding to setups (a) and (b) in Table 12.
| Setup | (10-3) | (GeV) | (GeV2) | |
|---|---|---|---|---|
| (a) | 4.2/14 | |||
| (b) | 4.7/18 |
IV Summary
We have determined the first and second moments of the photon energy distribution in decays, and , for minimum photon energies in the meson rest frame ranging from 1.8 to 2.3 GeV using the measurement of this spectrum published in Ref. Koppenburg:2004fz . The results are given in Table 4. We have also evaluated the (statistical and systematic) self- and cross-correlations between these measurements (Tables 57).
In the second part of the present document, we have combined these measurements with recent Belle data on the lepton energy and hadronic mass moments in decays Urquijo:2006wd ; Schwanda:2006nf to extract , and other non-perturbative parameters using theoretical expressions derived in the 1S Bauer:2004ve and kinetic Gambino:2004qm ; Benson:2004sg schemes.
The fits give consistent values of in the two schemes. In the 1S scheme analysis we find and GeV. In the kinetic scheme, we obtain and GeV. Note that the values can only be compared after scheme translation. The fit results using only the data are and GeV in the 1S scheme, and and GeV in the kinetic scheme (see Tables 10 and 12).
The CKM magnitude and the -quark masses have been extracted with values that are consistent with previous determinations Bauer:2004ve ; Buchmuller:2005zv ; Abdallah:2005cx ; :2007yaa . In the 1S scheme has been measured with 1.6% precision. This is the most precise determination by any single experiment so far Abdallah:2005cx ; :2007yaa .
Acknowledgments
We thank the theorists working on the 1S scheme: C.W. Bauer, Z. Ligeti, M. Luke, A.V. Manohar and M. Trott, and those working on the kinetic scheme: P. Gambino, N. Uraltsev and I. Bigi for providing the Mathematica and Fortran codes that describe the respective calculations. We thank the KEKB group for the excellent operation of the accelerator, the KEK cryogenics group for the efficient operation of the solenoid, and the KEK computer group and the National Institute of Informatics for valuable computing and SINET3 network support. We acknowledge support from the Ministry of Education, Culture, Sports, Science, and Technology of Japan and the Japan Society for the Promotion of Science; the Australian Research Council, the Australian Department of Education, Science and Training, and the David Hay Postgraduate Writing-Up Award; the National Natural Science Foundation of China under contract No. 10575109 and 10775142; the Department of Science and Technology of India; the BK21 program of the Ministry of Education of Korea, the CHEP SRC program and Basic Research program (grant No. R01-2005-000-10089-0) of the Korea Science and Engineering Foundation, and the Pure Basic Research Group program of the Korea Research Foundation; the Polish State Committee for Scientific Research; the Ministry of Education and Science of the Russian Federation and the Russian Federal Agency for Atomic Energy; the Slovenian Research Agency; the Swiss National Science Foundation; the National Science Council and the Ministry of Education of Taiwan; and the U.S. Department of Energy.
References
- (1) N. Cabibbo, Phys. Rev. Lett. 10, 531 (1963); M. Kobayashi and T. Maskawa, Prog. Theor. Phys. 49, 652 (1973).
- (2) C. W. Bauer, Z. Ligeti, M. Luke, A. V. Manohar and M. Trott, Phys. Rev. D 70, 094017 (2004) [hep-ph/0408002].
- (3) O. Buchmuller and H. Flacher, Phys. Rev. D 73, 073008 (2006) [hep-ph/0507253].
- (4) J. Abdallah et al. [DELPHI Collaboration], Eur. Phys. J. C 45, 35 (2006) [hep-ex/0510024].
- (5) B. Aubert et al. [BaBar Collaboration], arXiv:0707.2670 [hep-ex].
- (6) D. Benson, I. I. Bigi, T. Mannel and N. Uraltsev, Nucl. Phys. B 665, 367 (2003) [hep-ph/0302262].
- (7) P. Gambino and N. Uraltsev, Eur. Phys. J. C 34, 181 (2004) [hep-ph/0401063].
- (8) D. Benson, I. I. Bigi and N. Uraltsev, Nucl. Phys. B 710, 371 (2005) [hep-ph/0410080].
- (9) P. Koppenburg et al. [Belle Collaboration], Phys. Rev. Lett. 93, 061803 (2004) [hep-ex/0403004].
- (10) P. Urquijo et al., Phys. Rev. D 75, 032001 (2007) [hep-ex/0610012].
- (11) C. Schwanda et al. [Belle Collaboration], Phys. Rev. D 75, 032005 (2007) [hep-ex/0611044].
- (12) R. A. Fisher, Annals Eugen. 7, 179 (1936).
- (13) G. C. Fox and S. Wolfram, Phys. Rev. Lett. 41, 1581 (1978).
- (14) A. L. Kagan and M. Neubert, Eur. Phys. J. C 7, 5 (1999) [hep-ph/9805303].
- (15) S. Nishida et al. [BELLE Collaboration], Phys. Rev. Lett. 93, 031803 (2004) [hep-ex/0308038].
- (16) S. Chen et al. [CLEO Collaboration], Phys. Rev. Lett. 87, 251807 (2001) [hep-ex/0108032].
- (17) B. Aubert et al. [BaBar Collaboration], Phys. Rev. D 72, 052004 (2005) [hep-ex/0508004].
- (18) A. Limosani and T. Nozaki [Heavy Flavor Averaging Group], hep-ex/0407052.
- (19) The measurements of and correspond to the same order in and are counted only once.
- (20) N. Uraltsev, In the Proceedings of 2nd Workshop on the CKM Unitarity Triangle, Durham, England, 5-9 Apr 2003, pp WG118 [hep-ph/0306290].
- (21) E. Barberio et al. [Heavy Flavor Averaging Group (HFAG) Collaboration], arXiv:0704.3575 [hep-ex].
- (22) F. James and M. Roos, Comput. Phys. Commun. 10, 343 (1975).
- (23) P. Gambino, private communication (2006).
- (24) N. Uraltsev, Int. J. Mod. Phys. A 20, 2099 (2005) [hep-ph/0403166].
- (25) In this analysis, all non-perturbative parameters in the kinetic scheme are defined at the scale GeV.