Another Non-segregated Blue Straggler Population in a Globular Cluster: the Case of NGC 241955affiliation: Based on observations with the NASA/ESA HST, obtained at the Space Telescope Science Institute, which is operated by AURA, Inc., under NASA contract NAS5-26555. Also based on SUBARU observations collected at the Hawaii National Astronomical Observatoty of Japan.
Abstract
We have used a combination of ACS-HST high-resolution and wide-field SUBARU data in order to study the Blue Straggler Star (BSS) population over the entire extension of the remote Galactic globular cluster NGC 2419. The BSS population presented here is among the largest ever observed in any stellar system, with more than 230 BSS in the brightest portion of the sequence. The radial distribution of the selected BSS is essentially the same as that of the other cluster stars. In this sense the BSS radial distribution is similar to that of Centauri and unlike that of all Galactic globular clusters studied to date, which have highly centrally segregated distributions and, in most cases, a pronounced upturn in the external regions. As in the case of Centauri, this evidence indicates that NGC 2419 is not yet relaxed even in the central regions. This observational fact is in agreement with estimated half-mass relaxation time, which is of the order of the cluster age.
1 INTRODUCTION
This paper is part of a series aimed at studying the complex interplay between dynamics and stellar evolution in a sample of globular clusters (GCs) with different structural properties. To this purpose we are using the so-called Blue Stragglers Star (BSS) population as a probe. BSS are the most abundant and common population of stars which significantly deviates from the evolutionary path defined by a simple, old stellar population. In the Color Magnitude Diagram (CMD), BSS define a sparsely populated sequence more luminous and bluer than the Turn-Off point (TO) of a normal hydrogen-burning main-sequence (MS). Hence they appear as stars more massive (see also Shara et al. 1997) and younger than the bulk of the cluster population. They are thought to form from the evolution of binary systems, either via mass-transfer/coalescence phenomena in primordial binaries (PB-BSS; McCrea, 1964; Zinn & Searle, 1976), or by stellar mergers induced by collisions (COL-BSS; Hills & Day, 1976). Since collisional stellar systems like GCs dynamically evolve over a time-scale significantly shorter than their age, BSS are expected to have sunk into the cluster core, as have the majority of the most massive objects (like binaries and other binary by-products) harbored in the system.
In many GCs the projected radial distribution of BSSs has been found to be bimodal: highly peaked in the center, with a clear-cut dip at intermediate radii, and with an upturn in the external regions. Such a behavior has been confirmed in at least 7 GCs: M3, 47 Tuc, NGC 6752, M5, and M55, NGC 6388 (all references in Dalessandro et al. 2007) and M53 (Beccari et al. 2008). Dynamical simulations (Mapelli et al. 2006; Lanzoni et al. 2007a,c) suggest that the observed central peak is mainly due to COL-BSS formed in the core and/or PB-BSS sunk into the center because of dynamical friction, while the external rising branch is made of PB-BSS evolving in isolation in the cluster outskirts. Even in those GCs that do not show any bimodality the BSS always appear to be significantly more segregated in the central regions than the reference cluster stars. The only exception to these general observational features is Centauri (hereafter Cen): the large population of BSS discovered by Ferraro et al. (2006, hereafter F06) in this giant stellar system has the same radial distribution of the normal cluster stars. This is a clear evidence that Cen is not fully relaxed, even in the central regions, and therefore, the dynamical evolution of the cluster has not significantly altered the radial distribution of these stars. It is likely that the vast majority of BSS observed in this cluster are the progeny of primordial binaries evolved in isolation (see also Mapelli et al. 2006).
Here we direct our attention to another massive cluster (NGC2419) which shares a number of properties with Cen. This remote object ( kpc; Harris et al. 1997) is one of the most luminous clusters in the Galaxy (; see Bellazzini 2007, herefater B07), similar to Cen and M54 (NGC 6715). It has been suggested that both of the latter clusters are the remnants of stripped cores of dwarf spheroidals (see, e.g., Layden & Sarajedini 2000; Bekki & Freeman 2003). With its high luminosity and half-light radius ( pc; B07), NGC 2419 lies (together with Cen and M54) in the plane well above the locus defined by all the other Galactic GCs. Indeed, it is the most significant outlier, thus suggesting that it also might be the stripped core of a former dwarf galaxy (van den Bergh & Mackey 2004; Mackey & van den Bergh 2005). Further, Newberg et al. (2003) suggested that NGC 2419 could be somehow connected with the Sagittarius (Sgr) dwarf spheroidal, since it seems to be located in a region with an overdensity of type-A stars which is in the same plane as the tidal tails of Sgr. However, the high-quality CMDs of NGC 2419 recently published by Ripepi et al. (2007, hereafter R07; see also B07) do not show any evidence of multiple stellar populations, in contrast to Cen (Lee et al. 1999; Pancino et al. 2000; Bedin et al. 2004; Rey et al. 2004; Sollima et al. 2005) and possibly M54 (Layden & Sarajedini 2000; see also Monaco et al. 2005). It is however possible that for such a metal-poor cluster (; Ferraro et al. 1999b), the range in metallicities for the sub-population components is so small that different sequences cannot be seen in the CMD (Mackey & van den Bergh 2005; Federici et al. 2007).
In order to further investigate the dynamical status and the stellar populations of this remote cluster, here we present a multi-wavelength study of BSS in NGC 2419. By combining HST high-resolution data, with wide-field SUBARU images, we sampled the total radial extension of the cluster. This allowed us to study and compare the projected radial distributions of BSS and other cluster stars in different evolutionary stages. The data and photometric reductions are described in § 2. A general overview of the CMD is discussed in § 3. The BSS population is described in § 4, and the Discussion is presented in § 5.
2 OBSERVATIONS AND DATA ANALYSIS
2.1 The data sets
To study the crowded cores of high-density systems and simultaneously cover the total cluster extensions, a combination of high resolution observations of the central regions and complementary wide-field images is needed.
1. High resolution set – This is composed of a series of public images obtained with the Wide Field Channel of the Advanced Camera for Surveys (ACS) on board the Hubble Space Telecope (HST): two F435W ( filter) images with sec each, two F555W ( filter) images with sec, and two F814W ( filter) images with sec (Prop GO9666, P.I. Gilliland). These are the highest resolution () observations available to date for NGC 2419. Unfortunately the ACS images are off-centered (see Figure 1), and they do not completely sample the most central region of the cluster. As in previous works (see, e.g., Dalessandro et al. 2007), average ACS images were obtained in each filter, and they were corrected for geometric distorsion and effective flux (Sirianni et al. 2005). The data reduction has been performed using the ROMAFOT package (Buonanno et al. 1983), specifically developed to perform accurate photometry in crowded regions (Buonanno & Iannicola 1989).
2. Wide field set – We have used a set of public and images obtained with the SUBARU Prime Focus Camera (Suprime-Cam) of the 8.2 m SUBARU telescope at the Hawaii National Astronomical Observatoty of Japan. The Suprime-Cam is a mosaic of ten CCDs, which covers a field of view (FoV) with a pixel scale of . A combination of long-exposures ( sec) and median exposure ( sec) images has been retrieved from the Subaru Archive Web site (SMOKA). As shown in Figure 2, the cluster is centered in the chip #2 and it is totally included in the five adjacent chips; therefore only these six chips have been considered in the present study. We have applied standard pre-reduction procedures (correction for bias, flat-field and overscan) using IRAF111IRAF is distributed by the National Optical Astronomy Observatory, which is operated by the Association of Universities for Research in Astronomy, Inc., under cooperative agreement with the national Science Foundation tools. The reduction was performed independently for each image using the PSF fitting software DoPhot (Schechter et al. 1993).
2.2 Astrometry, center of gravity and photometric calibration
The ACS and SUBARU data have been placed on the absolute astrometric system by using the stars in common between each single chip and the SDSS data set used by B07, that, in turn, was astrometrized on the GSC-II astrometric reference star catalog. Hundreds of stars have been matched in each chip, thus allowing a very precise determination of the stellar absolute positions. The resulting rms residuals (a measure of the internal astrometric accuracy) were of the order of both in Right Ascension () and Declination ().
The photometric calibration of the ACS catalog has been performed in the VEGAMAG stystem using the relations and zero-points described in Sirianni et al. (2005). Then, the SUBARU catalog has been homogenized to the ACS one. In order to transform of the instrumental SUBARU magnitudes into the ACS VEGAMAG system, a subsample of a few hundred stars in common between the SUBARU and the ACS FoVs has been selected, and the following relations have been obtained:
| (1) |
| (2) |
where and are the instrumental and magnitudes in the SUBARU sample referred to 1 second exposure. In this way a final list of absolute positions and homogeneous (VEGAMAG) magnitudes for all the stars in the two catalogs was obtained.
In order to determine the Center of Gravity () of the cluster, we have computed the barycenter of all the stars found in the ACS catalog at a distance from the center quoted by Harris (1996). A circular region of radius is the maximum available area completely covered by the ACS observations (see Fig. 1). The absolute positions (, ) of the stars have been averaged using an iterative technique described in previous works (e.g., Montegriffo et al. 1995; Ferraro et al. 2003). We have excluded stars brighter than since they are saturated in the ACS images. The same procedure has been repeated for three different magnitude cuts (, , and ) in order to check for any possible statistical or spurious fluctuations. The three measures agree within and their mean value has been adopted as best estimate of : and , with an uncentainty of in both and . This new determination is in agreement with that listed by Harris (1996).
Given the coordinates of , we have divided the dataset in two main samples: the HST sample, which includes all the stars found in the ACS catalog, and the SUBARU sample, that consists of stars not included in the ACS FoV and lying at from the cluster center. The latter choice implies that a small region (a segment of a circle located North from the cluster center) is covered neither by the HST nor by the SUBARU sample (see Fig.2). This conservative choice is made to avoid incompletness effects of the ground based observations in the most crowded central regions of the cluster.222However, note that the annular region between and from the cluster center is well sampled (at ) by the ACS sample.
3 CMD overall characteristics and the HB morphology
The CMD of stars in the HST sample is shown in Figure 3. This is the deepest CMD ever published for NGC 2419, reaching down to . All the main cluster evolutionary sequences are clearly defined and well populated. The stars in the brightest () portion of the red giant branch (RGB) are not shown in the figure, because they are heavily saturated in these exposures. The MS-TO of the cluster is located at . Particularly notable is the horizontal branch (HB) morphology, which looks quite complex, with a long HB blue tail (BT) extending well below the cluster MS-TO. The peak of the HB population is located at and . The HB population significantly decreases with decreasing luminosity along the BT. A poorly populated region (a gap?) is visible at , separating the extreme extention of the BT and a clump of stars extending down to . Following the nomenclature adopted in Dalessandro et al. (2007), these are extreme HB (EHB) stars with the faintest ones being Blue Hook (BHk) stars. Definitive assignment to these groups will require UV photometry.
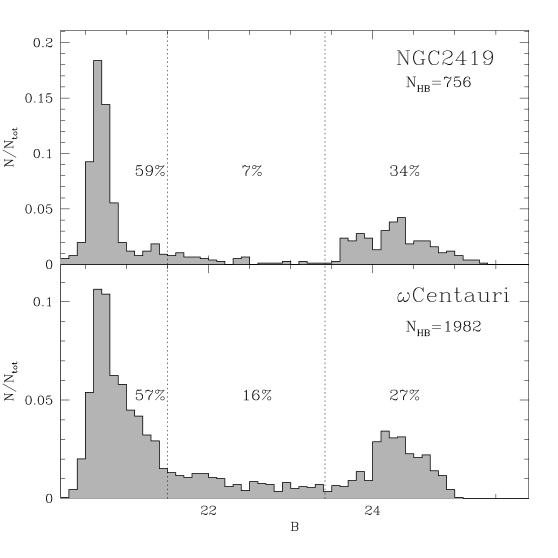
In Figure 4 we show a direct comparison between the HB of NGC 2419, and that of Cen (from Ferraro et al. 2004), suitably shifted (by magnitudes) in order to match the HB level of NGC 2419. The two HBs show very similar extension and morphology. The only significant difference is that EHB/BHk stars in NGC 2419 are much more spread-out in color than the same population in Cen. The rms scatter between the magnitude measurements in the two single images, is and mag in the and bands, respectively. Thus the photometric error in is mag at the level of BHk stars. The observed color spraed is about 4 and may thus be real. To demonstrate more clearly the striking similiarity of these HBs, in Figure 5 we show the normalized magnitude distribution of HB stars. The percentage of stars in three portions of the branch is also designated in the figure. Beyond general appearance, the HBs are quantitatively similar: (i) both the HBs extend for almost 4.5 mag; (ii) both the distributions show a well defined peak, an extended tail and a EHB/BHk clump; (iii) the bulk of the HB population () is localized in the brightest 1 magnitude portion of the branch; (iv) the BT is 10–12% of the population; (v) both the EHB/BHk clumps extend for roughly 1.5 magnitudes and they comprise of the total HB population.
As discussed in Dalessandro et al. (2007), the nature of BHk stars is still unclear: they may be related to the so-called late hot flashers (Moehler et al., 2004, Catelan 2007), or due to high helium abundances (as suggested by Busso et al. 2007, in the case of NGC6388; see also Caloi & D’Antona 2007; D’Antona et al. 2005), or related to the evolution of binary systems (Heber et al., 2002). However, the detection of a population of BHk stars in a low-metallicity cluster as NGC 2419 clearly demonstrates that the process producing these extremely hot HB stars can efficiently work in any metallicity environment: NGC 6388 (), NGC 2808 (), Cen (, M54 ( and NGC 2419 (). It is interesting to note that NGC 2419 is very massive as are the other BHk clusters. We have also checked the EHB/BHk radial distributions with respect to the brightest portion of the HB and the RGB. The significance of the difference has been quantified with a Kolmogorov-Smirnov (KS) test: the radial distribution of the BHk population is consistent with that of normal cluster stars, in agreement with similar findings in NGC 6388 (Rich et al. 1997, Dalessandro et al. 2007) and Cen (Ferraro et al. 2004). However, the evidence presented in Sect. 4.2 demonstrate that NGC 2419 is not relaxed even in the central regions, hence no segregation is expected for these stars even in the case they were binaries. Moreover, as discussed in Dalessandro et al. (2007), it is important to remember that the lack of segregation of the EHB/BHk population is not a firm proof of the non-binarity of EHB/BHk stars, since they could be low-mass binaries, with a total mass similar (or even lower) than “normal” cluster stars (for example, a 0.5 He-burning star with a 0.2 He white dwarf companion).
3.1 Density profile and distance modulus estimate
The ) CMDs of the HST and SUBARU samples defined in Section 2.2 are shown in Figure 6. Thanks to the high-resolution ACS images of the cluster core and the wide FoV of the SUBARU observations, we have properly sampled the stellar population over the entire cluster extension. We have then used this data-set to determine the projected density profile of NGC 2419 using direct star counts, from out to about .
Stars with are saturated in the ACS sample and therefore have been excluded from the analysis; however, since they are small in number, this produces a negligible effect on the global result. In order to avoid incompleteness biases we have also excluded stars fainter than . Using the same procedure described in Ferraro et al. (1999a) the whole sample has been divided in 24 concentric annuli, each centered on and suitably split in a number of subsectors. The number counts have been calculated in each subsector and the corresponding densities were obtained dividing them by the sampled area (taking into account the incomplete spatial coverage of the region between and ). The stellar density of each annulus has then be defined as the average of the subsector densities and its standard deviation is computed from the variance among the subsectors. The resulting projected surface density profile is plotted in Figure 7. As apparent, the outermost two points show a flattening of the stellar number density, and their average (corresponding to stars/arcmin2) has therefore been used as an estimate of the background contribution. The derived radial density profile is well fit by an isotropic single-mass King model (solid line in Fig. 7), with concentration and core radius , yielding a “formal” value of the cluster tidal radius of and a half-mass radius of . These parameters are essentially equal to those obtained by B07 and in good agreement with other previous determinations (see, e.g., Table 2 in B07).
We have used the available high-quality data set also for deriving an independent estimate of the distance to NGC 2419. To do this, we compared the CMD shown in Fig. 3, to that of M92 (NGC 6341), one of the “prototype” Galactic GCs, with similar metallicity ([Fe/H], Ferraro et al. 1999b). We have used a combination of WFPC2 and ACS data of M92 (F.R. Ferraro et al. 2008, in preparation), obtained through filters F555W () and F814W (). We have shifted the CMD of M92 onto that of NGC 2419 until a good match between the main evolutionary sequences (RGB, HB, sub-giant branch and TO region) of the two clusters was reached (see Figure 8). This has required a color shift and , similar to that obtained by Harris et al. (1997) from an analogous comparison based on independent data sets. Figure 8 shows that a really nice matching of all the evolutionary sequences of the two clusters can be achieved. This evidence also suggests that the two clusters have a similar age (in agreement with Harris et al. 1997, who estimated an age difference of Gyr for the two objects).
By assuming the distance modulus and the reddening for M92 (Ferraro et al. 1999b), and by using the standard absorption coefficient ( and ), we have obtained and , corresponding to a true distance modulus , for NGC 2419. The reddening obtained from this procedure is in good agreement with the value derived by Harris et al. (1997), who quoted , and it is also agreement with the value adopted by R07 within the errors. Taking a conservative estimate of mag, we finally adopt . This yields a real distance kpc. Within the uncertanties, this estimate is in agreement with both that found by Harris et al. (1997; kpc) and that obtained by R07 using the mean luminosity of the RR Lyrae stars ( kpc). Assuming this distance, the physical dimension of the core radius and of the half-mass radius of the cluster can be obtained: given and (see above), we obtain pc and pc, respectively. By adopting the total integrated magnitude quoted by B07, the absolute cluster magnitude is . This value, combined with the size of the the half-mass radius, confirms the anomalous position of NGC 2419 in the versus plane (van den Bergh & Mackey 2004).
4 THE POPULATION OF BSS
4.1 Population selection
To select the BSS population we have chosen to use the () CMD, in which the BSS sequence is better defined. To avoid spurious effects due to sub-giant branch star blends and Galaxy field star contamination, only stars brighter than (corresponding to 1 mag above the TO) and with have been selected (see Figure 9). The resulting number of candidate BSS in the HST sample is 183. The position of the bulk of these stars in the ACS () CMD has then been used to define the BSS selection box for the SUBARU sample. This is shown in Figure 10, with the faint and red edges corresponding to and , respectively. The resulting number of candidate BSS found in the entire SUBARU sample is 67, out of which 49 are found within the “safe” distance of from the cluster center. This distance is sligthly larger than the “formal” tidal radius obtained in Sect. 3.1 and takes into account possible uncertanties in the determination of the latter. The positions and magnitudes of the all the 232 candidate BSS thus selected are listed in Table 1, which is available in full size in electronic form.333Several SX Phoenicis variables have been found by R07. However a direct comparison between these stars and our BSS sample is not possible, since the R07 catalog is not yet published.
Reference populations representative of the “normal” cluster stars are needed to properly study the BSS radial distribution. We considered both the HB and the RGB. Since the HST and the SUBARU samples have the and filters in common, we performed a homogeneous selection of these populations in the plane. The HB selection box (see Fig. 10) has been drawn to limit the contribution of field contamination in the bright-red portion of the sequence (i.e., we have required that at ) and in order to exclude the EHB/BHk clump (). The EHB/BHk stars populate a region located magnitude below the MS-TO (see Fig. 8), which is very close to the detection limit of the and observations. Thus, they could be severely affected by incompletness bias, and we have therefore preferred not to include them in the HB reference population. However, since their radial distribution is indistinguishable from that of the other HB stars, this exclusion has negligible effect on the following results. The total number of HB stars thus selected within is 765, with 528 found in the HST sample and 237 in the SUBARU one. The RGB population has been selected along the RGB mean ridge line between and (see the selection box in Fig. 10). This choice has been dictated by the fact that the brightest portion of the RGB sequence is saturated in the HST sample, and its faintest portion is contaminated by Galactic field stars, especially in the SUBARU sample. The total number of these stars within is 3250, with 2337 found in the HST sample and 913 in the SUBARU one.
4.2 BSS radial distribution
A first qualitative comparison between the cumulative radial distribution of BSS and that of the reference populations (see Figure 11) has been performed using the KS test. This gives 70% and 50% probabilities that the BSS population is extracted from the same population as the HB and RGB stars, respectively. Hence there is preliminary evidence that the radial distribution of BSS is indistinguishable from that of the “normal” cluster population, in contrast to what found in most of the typical GCs (see references in Dalessandro et al. 2007).
For a more detailed analysis, we have used the same technique described in previous works (see, e.g., F06). The sampled area within has been divided in 5 concentric annuli centered on . In each of these we have counted the number of BSS, HB and RGB stars. However, the examination of the external regions () of the SUBARU sample CMD suggests that the selected (BSS, HB, and RGB) populations can be affected by contamination from stars in the Galactic field. In order to account for this effect we adopted the statistical correction as used in previous papers (see, e.g., Dalessandro et al. 2007). To do this we selected a rectangular region of located at , i.e. well beyond the formal tidal radius of the cluster. The CMD of this region clearly shows that the Galaxy field population is dominant relative to the cluster one. Then we counted the number of stars in this region lying in the BSS, HB and RGB selection boxes showed in Fig. 6 and derived the following values of the field star densities: , and . These quantities allow us to estimate the impact of the field contamination on the selected samples: 6 BSS (), 12 HB () and 31 RGB(), essentially all in the most external annulus, could be field stars (see Table 2). Though the effect of the field contamination is small, in the following we use the statistically decontaminated samples in order to determine the population ratios and the radial distribution.
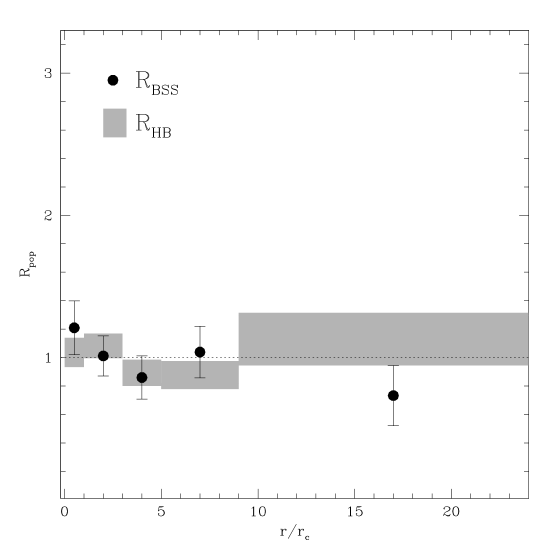
By using the King model, the distance modulus and the reddening estimated in Sect. 3.1, the luminosity sampled in each annulus () has also been estimated. Then for each annulus we have computed the double normalized ratio defined in Ferraro et al. (1993):
| (3) |
with pop= BSS, HB and RGB. We find that and are essentially constant and close to unity (see in Figure 12). This is what expected for any post-MS population according to the stellar evolution theory (Renzini & Fusi Pecci 1988). Surprisingly we also find that the double normalized ratio of BSS is constant, and it is fully consistent with the reference populations (Fig. 12). Using the number counts listed in Table 2, we have also computed the specific frequencies , and . We find that all these ratios are almost costant all over the entire extension of the cluster (see Figure 13), confirming again that no signatures of mass segregation are visible for the BSS population of NGC 2419.444Note that this result is independent of which portion of the RGB is selected. In fact, similar results are obtained also by considering the RGB in the same magnitude range of the BSS.
5 DISCUSSION
In most previously surveyed Galactic GCs (M3; 47 Tuc, NGC 6752,M5, M55, NGC 6388, M53) the BSS radial distribution has been found to be bimodal (higly peaked in the core, decreasing to a minimun at intermediate radii, and rising again in the external regions). The mechanisms leading to bimodal radial distributions have been studied for some clusters using dynamical simulations (see Mapelli et al. 2004, 2006; Lanzoni et al. 2007a,c): the observed central peak is mainly made up of collisionally formed BSS and/or PB-BSS sunk into the core because of dynamical friction; the external rising branch is composed of PB-BSS evolving in isolation in the cluster outskirts. In contrast, the BSS radial distribution of NGC 2419 is essentially the same as that of the other “normal” stars in the cluster. Previously, Cen was the only GC known to have a flat BSS radial distribution. F06 (see also Meylan & Heggie 1997) argued that two-body relaxation had not led to the complete relaxation of Cen even in the central core. Our result here suggests that the same situation holds for NGC 2419.
We can compare this observational evidence with theoretical time-scales expected on the basis of the cluster structural parameters. Following equation (10) of Djorgovski (1993), we computed the cluster central relaxation time () by adopting for the average stellar mass, and for the mass-to-light ratio and for the band solar magnitude. The integrated magnitude obtained in Sect. 3.1 then leads to a total cluster mass of , and a total number of stars of . By assuming (Pryor & Meylan 1993), and given the value of the core radius ( pc) derived in Sect. 3.1, we obtain Gyr, which is about half the cluster age (–13 Gyr; Harris et al. 1997). Thus some evidence of mass segregation should be visible at least in the core, at odds with the observed flat distribution of BSS. We can also compute the characteristic relaxation time-scale for stars as massive as BSS (; see F06) at the cluster half-mass radius () using equation (10) of Davies et al. (2004). Since pc (see Sect. 3.1) we obtain Gyr, thus suggesting that no significant segregation is expected for stars as massive as the BSS in the outer parts of the clusters, in agreement with our observational results. This result is similar to that found for Cen by F06 where the relaxation time in the core was found to be half the cluster age. In the case of Cen a number of possible explanations were examined; for instance, the possibility that Cen is the relic of a partially disrupted galaxy, which was much more massive in the past. A similar argument can be advocated for NGC 2419, which has also been suspected to be the relic of a small dwarf galaxy interacting with the Milky Way (van den Bergh & Mackey 2004; Federici et al. 2007 and references therein). However, it should be noted that the above estimates of the relaxation times are rough, and since the predicted value of is only a factor of 2 smaller than the cluster age, more detailed computations are needed before further interpret these results.
From the observational side, the BSS radial distribution shown in Figs. 12 and 13 suggests that in NGC 2419 (as in Cen) stellar collisions have played a minor (if any) role in modifying the radial distribution of massive objects and probably also in generating exotic binary systems. If dynamical evolution plays a central role in NGC 2419, the observed flat BSS distribution can be explained only by invoking an ad hoc formation/destruction rate balancing the BSS population in the core and in the outer region of the cluster. It is more likely that this flat distribution arises because the BSS we are observing result from the evolution of primordial binaries whose radial distribution has not been altered by the dynamical evolution of the cluster. Thus, as in the case of Cen, the BSS population observed in NGC 2419 could be a pure population of PB-BSS, and it can be used to evaluate the incidence of such a population in stellar systems.
As in previous papers (see e.g. Ferraro et al. 1995, F06) here we compute the PB-BSS frequency as the number of BSS normalized to the sampled luminosity in units of : (see the bottom panel of Fig. 13). This quantity is useful for estimating the expected number of BSS generated by PBs for each fraction of the sampled light in any stellar system, resolved or not555This quantity is also important in evaluating the incidence of creation/destruction rate of BSS in the central region of high-density clusters, where collisions can have played a major role in producing collisional BSS.. For NGC 2419, we find (see Fig. 13). Before comparing this quantity to that found in Cen by F06, we must account for the fact that the adopted BSS selection criteria are different in the two clusters. In NGC 2419 we considered BSS brighter than ; this threshold corresponds to at the distance of Cen, using the value needed to shift the HB of Cen onto that of NGC 2419 (see Fig.5). By adopting this threshold, 104 BSS are found in the ACS FoV of Cen, and by considering the sampled luminosity, we obtain for this cluster.666Of course, such a value is slightly smaller than that () obtained in F06 by considering the entire sample of BSS with This comparison suggests that the number of BSS per unit sampled light in NGC 2419 is twice as large than that in Cen.777A similar result is obtained if selecting the BSS population of NGC 2419 down to the same threshold used by F06 for the BSS in Cen, i.e. (which corresponds to at the distance of NGC 2419). Under the hypothesis that the vast majority of these BSS are generated by the evolution of PBs, the different values could result from a different binary frequency in the two clusters, since PB-BSS are expected to strongly depend on the fraction of binaries in the cluster. Indeed the first direct correlation between these two quantities (the binary fraction and the BSS frequency) has been recently detected in a sample of 13 low-density clusters by Sollima et al. (2008). Such a connection strongly supports a scenario in which the evolution of PBs is the main formation channel for BSS in low-density environments.
The case of NGC 2419 further supports the idea that important signatures of the dynamical evolution of the parent cluster are imprinted in the radial distribution of the BSS population: indeed the most recent results collected by our group (see Ferraro et al. 2003, 2006; Lanzoni et al. 2007a,b,c; Dalessandro et al. 2007) are building the ideal data-base from which such signatures can be read and interpreted, and are already confirming this hyphothesis.
References
- Beccari et al. (2008) Beccari et al. 2008, in press in the ApJ, (arXiv:0802.2613)
- Bedin et al. (2004) Bedin, L. R., Piotto, G., Anderson, J., Cassisi, S., King, I. R., Momany, Y., & Carraro, G. 2004, ApJ, 605, L125
- Bekki & Freeman (2003) Bekki, K., & Freeman, K. C. 2003, MNRAS, 346, L11
- Bellazzini (2007) Bellazzini, M. 2007, A&A, 473, 171
- Buonanno et al. (1983) Buonanno, R., Buscema, G., Corsi, C. E., Ferraro, I., & Iannicola, G. 1983, A&A, 126, 278
- Buonanno & Iannicola (1989) Buonanno, R., & Iannicola, G. 1989, PASP, 101, 294
- Busso et al. (2007) Busso, G., et al. 2007, A&A, 474, 105
- Caloi & D’Antona (2007) Caloi, V., & D’Antona, F. 2007, A&A, 463, 949
- Catelan (2007) Catelan, M. 2007, ArXiv e-prints, 708, arXiv:0708.2445
- D’Antona et al. (2005) D’Antona, F., Bellazzini, M., Caloi, V., Pecci, F. F., Galleti, S., & Rood, R. T. 2005, ApJ, 631, 868
- Davies et al. (2004) Davies, M. B., Piotto, G., & de Angeli, F. 2004, MNRAS, 349, 129
- Djorgovski (1993) Djorgovski, S. 1993, in ASPC Conf. Ser. 50, Structure and Dynamics of Globular Clusters, ed. S. G. Djorgovski & G. Meylan (San Francisco: ASP), 373D
- Dalessandro et al. (2007) Dalessandro, E., Lanzoni, B., Ferraro, F. R., Rood, R. T., Milone, A., Piotto, G., & Valenti, E. 2007, ArXiv e-prints, 712, arXiv:0712.4272
- Federici et al. (2007) Federici, L., Bellazzini, M., Galleti, S., Fusi Pecci, F., Buzzoni, A., & Parmeggiani, G. 2007, A&A, 473, 429
- Ferraro et al. (1993) Ferraro, F. R., Fusi Pecci, F., Cacciari, C., Corsi, C., Buonanno, R., Fahlman, G. G., & Richer, H. B. 1993, AJ, 106, 2324
- Ferraro et al. (1995) Ferraro, F. R., Fusi Pecci, F., & Bellazzini, M. 1995, A&A, 294, 80
- Ferraro et al. (1999a) Ferraro, F. R., Paltrinieri, B., Rood, R. T., & Dorman, B. 1999a, ApJ 522, 983
- Ferraro et al. (1999b) Ferraro F. R., Messineo M., Fusi Pecci F., De Palo M. A., Straniero O., Chieffi A.,& Limongi M. 1999b, AJ, 118, 1738
- Ferraro et al. (2003) Ferraro, F. R., Sills, A., Rood, R. T., Paltrinieri, B., & Buonanno, R. 2003, ApJ, 588, 464
- Ferraro et al. (2004b) Ferraro, F. R., Sollima, A., Pancino, E., Bellazzini, M., Straniero, O., Origlia, L., & Cool, A. M. 2004, ApJ, 603, L81
- Ferraro et al. (2006) Ferraro, F. R., Sollima, A., Rood, R. T., Origlia, L., Pancino, E., & Bellazzini, M. 2006, ApJ, 638, 433 (F06)
- Harris (1996) Harris, W.E. 1996, AJ, 112, 1487
- Harris et al. (1997) Harris, W. E., et al. 1997, AJ, 114, 1030
- Heber et al. (2002) Heber, U., Moehler, S., Napiwotzki, R., Thejll, P., & Green, E. M. 2002, A&A, 383, 938
- Hills & Day (1976) Hills, J. G., & Day, C. A. 1976, Astrophys. Lett., 17, 87
- Lanzoni et al. (2007) Lanzoni, B., Dalessandro, E., Ferraro, F. R., Mancini, C., Beccari, G., Rood, R. T., Mapelli, M., & Sigurdsson, S. 2007a, ApJ, 663, 267
- Lanzoni et al. (2007b) Lanzoni, B., et al. 2007b, ApJ, 663, 1040
- Lanzoni et al. (2007d) Lanzoni, B., Dalessandro, E., Perina, S., Ferraro, F. R., Rood, R. T., & Sollima, A. 2007c, ApJ, 670, 1065
- Layden & Sarajedini (2000) Layden, A. C., & Sarajedini, A. 2000, AJ, 119, 1760
- Lee et al. (1999) Lee, Y.-W., Joo, J.-M., Sohn, Y.-J., Rey, S.-C., Lee, H.-C., & Walker, A. R. 1999, Nature, 402, 55
- Mackey & van den Bergh (2005) Mackey, A. D., & van den Bergh, S. 2005, MNRAS, 360, 631
- Mapelli et al. (2004) Mapelli, M., Sigurdsson, S., Colpi, M., Ferraro, F. R., Possenti, A., Rood, R. T., Sills, A., & Beccari, G. 2004, ApJ, 605, L29
- Mapelli et al. (2006) Mapelli, M., Sigurdsson, S., Ferraro, F. R., Colpi, M., Possenti, A., & Lanzoni, B. 2006, MNRAS, 373, 361
- McCrea (1964) McCrea, W. H. 1964, MNRAS, 128, 147
- Meylan & Heggie (1997) Meylan, G., & Heggie, D. C. 1997, A&A Rev., 8, 1
- Moehler et al. (2004) Moehler, S., Sweigart, A. V., Landsman, W. B., Hammer, N. J., & Dreizler, S. 2004, A&A, 415, 313
- Monaco et al. (2005) Monaco, L., Bellazzini, M., Ferraro, F. R., & Pancino, E. 2005, MNRAS, 356, 1396
- Montegriffo et al. (1995) Montegriffo, P., Ferraro, F. R., Fusi Pecci, F., & Origlia, L. 1995, MNRAS, 276, 739
- Newberg et al. (2003) Newberg, H. J., et al. 2003, ApJ, 596, L191
- Pancino et al. (2000) Pancino, E., Ferraro, F. R., Bellazzini, M., Piotto, G., & Zoccali, M. 2000, ApJ, 534, L83
- Pryor & Meylan (1993) Pryor C., & Meylan G., 1993, Structure and Dynamics of Globular Clusters. Proceedings of a Workshop held in Berkeley, California, July 15-17, 1992, to Honor the 65th Birthday of Ivan King. Editors, S.G. Djorgovski and G. Meylan; Publisher, Astronomical Society of the Pacific, Vol. 50, 357
- Renzini & Fusi Pecci (1988) Renzini, A., & Fusi Pecci, F. 1988, ARA&A, 26, 199
- Rey et al. (2004) Rey, S.-C., Lee, Y.-W., Ree, C. H., Joo, J.-M., Sohn, Y.-J., & Walker, A. R. 2004, AJ, 127, 958
- Rich et al. (1997) Rich, R. M., et al. 1997, ApJ, 484, L25
- Ripepi et al. (2007) Ripepi, V., et al. 2007, ApJ, 667, L61
- Schechter et al. (1993) Schechter, P. L., Mateo, M., & Saha, A. 1993, PASP, 105, 1342
- Shara et al. (1997) Shara, M. M., Saffer, R. A., & Livio, M. 1997, ApJ, 489, L59
- Sirianni et al. (2005) Sirianni, M., et al. 2005, PASP, 117, 1049
- Sollima et al. (2005) Sollima, A., Pancino, E., Ferraro, F. R., Bellazzini, M., Straniero, O., & Pasquini, L. 2005, ApJ, 634, 332
- Sollima et al. (2008) Sollima, A., Lanzoni, B., Beccari, G., Ferraro, F. R., & Fusi Pecci, F. 2008, (arXiv:0801.4511)
- van den Bergh & Mackey (2004) van den Bergh, S., & Mackey, A. D. 2004, MNRAS, 354, 713
- Zinn & Searle (1976) Zinn, R., & Searle, L. 1976, ApJ, 209, 734
| Name | RA | DEC | B | V | I |
|---|---|---|---|---|---|
| [degree] | [degree] | ||||
| BSS 1 | 114.5346238 | 38.8659223 | 21.67 | 21.48 | 21.19 |
| BSS 2 | 114.5317934 | 38.8778178 | 21.97 | 21.84 | 21.60 |
| BSS 3 | 114.5545324 | 38.8522824 | 22.01 | 21.86 | 21.55 |
| BSS 4 | 114.5290061 | 38.8781085 | 21.96 | 21.87 | 21.78 |
| BSS 5 | 114.5563785 | 38.8777071 | 22.03 | 21.88 | 21.67 |
| BSS 6 | 114.5375980 | 38.8849180 | 21.99 | 21.88 | 21.70 |
| BSS 7 | 114.5426076 | 38.8723283 | 22.20 | 21.98 | 21.72 |
| BSS 8 | 114.5322465 | 38.8824554 | 22.08 | 21.98 | 21.86 |
| BSS 9 | 114.5321660 | 38.8802393 | 22.10 | 21.99 | 21.81 |
| BSS 10 | 114.5314467 | 38.8844550 | 22.11 | 21.99 | 21.72 |
| BSS 11 | 114.5389799 | 38.8741541 | 22.20 | 22.04 | 21.83 |
| BSS 12 | 114.5180869 | 38.8707066 | 22.20 | 22.04 | 21.88 |
| BSS 13 | 114.5333262 | 38.8735631 | 22.24 | 22.09 | 21.62 |
| BSS 14 | 114.5186506 | 38.8555156 | 22.15 | 22.09 | 22.05 |
| BSS 15 | 114.5631273 | 38.8567423 | 22.34 | 22.10 | 21.72 |
| BSS 16 | 114.5350018 | 38.8575038 | 22.36 | 22.14 | 21.79 |
| BSS 17 | 114.5220854 | 38.8869184 | 22.32 | 22.14 | 21.83 |
| BSS 18 | 114.5559528 | 38.8756214 | 22.36 | 22.14 | 21.82 |
| BSS 19 | 114.5308496 | 38.8836661 | 22.36 | 22.15 | 21.86 |
| BSS 20 | 114.5052076 | 38.8695694 | 22.27 | 22.18 | 22.06 |
| BSS 21 | 114.5479750 | 38.8829417 | 22.39 | 22.23 | 21.98 |
| BSS 22 | 114.5542824 | 38.8787225 | 22.35 | 22.23 | 22.04 |
| BSS 23 | 114.5279917 | 38.8771869 | 22.33 | 22.23 | 22.05 |
| BSS 24 | 114.5289397 | 38.8789566 | 22.35 | 22.25 | 22.22 |
| BSS 25 | 114.5402618 | 38.8322954 | 22.45 | 22.30 | 21.80 |
| BSS 26 | 114.5544769 | 38.8807888 | 22.51 | 22.30 | 21.96 |
| BSS 27 | 114.5179647 | 38.8667478 | 22.53 | 22.35 | 22.06 |
| BSS 28 | 114.5208423 | 38.8864626 | 22.44 | 22.37 | 22.17 |
| BSS 29 | 114.5099740 | 38.8743802 | 22.49 | 22.38 | 22.18 |
| BSS 30 | 114.5707475 | 38.8723047 | 22.56 | 22.39 | 22.14 |
| BSS 31 | 114.5349532 | 38.8807603 | 22.62 | 22.43 | 22.14 |
| BSS 32 | 114.5373408 | 38.8847449 | 22.68 | 22.43 | 22.06 |
| BSS 33 | 114.5255999 | 38.8898043 | 22.69 | 22.46 | 22.23 |
| BSS 34 | 114.5213599 | 38.8819734 | 22.63 | 22.49 | 22.32 |
| BSS 35 | 114.5624518 | 38.8577883 | 22.68 | 22.51 | 22.22 |
| BSS 36 | 114.5502354 | 38.8587983 | 22.65 | 22.52 | 22.29 |
| BSS 37 | 114.5724785 | 38.8543265 | 22.70 | 22.52 | 22.22 |
| BSS 38 | 114.5377048 | 38.8776849 | 22.74 | 22.56 | 22.38 |
| BSS 39 | 114.5367933 | 38.8863131 | 22.75 | 22.56 | 22.25 |
| BSS 40 | 114.5370632 | 38.8841385 | 22.65 | 22.57 | 22.41 |
| BSS 41 | 114.5416913 | 38.8744374 | 22.80 | 22.57 | 22.20 |
| BSS 42 | 114.5328193 | 38.8783052 | 22.61 | 22.57 | 22.29 |
| BSS 43 | 114.5410755 | 38.8636039 | 22.70 | 22.58 | 22.35 |
| BSS 44 | 114.5443444 | 38.8841840 | 22.78 | 22.58 | 22.18 |
| BSS 45 | 114.5355871 | 38.8586443 | 22.72 | 22.59 | 22.29 |
| BSS 46 | 114.5330413 | 38.8827233 | 22.75 | 22.59 | 22.34 |
| BSS 47 | 114.5100504 | 38.8739744 | 22.78 | 22.59 | 22.38 |
| BSS 48 | 114.5394051 | 38.8758936 | 22.74 | 22.60 | 22.44 |
| BSS 49 | 114.5271347 | 38.8795152 | 22.76 | 22.61 | 22.42 |
| BSS 50 | 114.5277051 | 38.8748074 | 22.77 | 22.64 | 22.42 |
| BSS 51 | 114.5364186 | 38.8728954 | 22.88 | 22.65 | 22.22 |
| BSS 52 | 114.5358544 | 38.8787353 | 22.86 | 22.66 | 22.44 |
| BSS 53 | 114.4982285 | 38.8531324 | 22.78 | 22.67 | 22.14 |
| BSS 54 | 114.5145126 | 38.8789390 | 22.88 | 22.69 | 22.41 |
| BSS 55 | 114.5136075 | 38.8758341 | 22.84 | 22.70 | 22.50 |
| BSS 56 | 114.5436548 | 38.8769220 | 22.94 | 22.70 | 22.35 |
| BSS 57 | 114.5435517 | 38.8814084 | 22.92 | 22.70 | 22.40 |
| BSS 58 | 114.5381816 | 38.8832314 | 22.99 | 22.71 | 22.25 |
| BSS 59 | 114.5366860 | 38.8800032 | 22.88 | 22.72 | 22.39 |
| BSS 60 | 114.5285765 | 38.8761503 | 22.82 | 22.72 | 22.40 |
| BSS 61 | 114.5653514 | 38.8672278 | 22.90 | 22.74 | 22.41 |
| BSS 62 | 114.5319576 | 38.8456597 | 22.89 | 22.74 | 22.52 |
| BSS 63 | 114.5332823 | 38.8808548 | 22.90 | 22.75 | 22.50 |
| BSS 64 | 114.5201658 | 38.8716290 | 23.05 | 22.75 | 22.49 |
| BSS 65 | 114.5182917 | 38.8645682 | 22.93 | 22.76 | 22.43 |
| BSS 66 | 114.5422667 | 38.8810701 | 23.00 | 22.77 | 22.48 |
| BSS 67 | 114.5383605 | 38.8855947 | 23.02 | 22.77 | 22.42 |
| BSS 68 | 114.5228769 | 38.8715036 | 22.95 | 22.78 | 22.58 |
| BSS 69 | 114.5655782 | 38.8738971 | 22.95 | 22.79 | 22.54 |
| BSS 70 | 114.5508635 | 38.8556174 | 22.91 | 22.80 | 22.44 |
| BSS 71 | 114.5248251 | 38.8798819 | 23.03 | 22.80 | 22.50 |
| BSS 72 | 114.5330946 | 38.8782802 | 22.94 | 22.81 | 22.42 |
| BSS 73 | 114.5300473 | 38.8726778 | 22.99 | 22.82 | 22.42 |
| BSS 74 | 114.5258531 | 38.8844487 | 22.98 | 22.82 | 22.57 |
| BSS 75 | 114.5348296 | 38.8738382 | 23.04 | 22.84 | 22.40 |
| BSS 76 | 114.5148586 | 38.8769283 | 23.00 | 22.85 | 22.74 |
| BSS 77 | 114.5516168 | 38.8734430 | 23.02 | 22.85 | 22.62 |
| BSS 78 | 114.5466460 | 38.8781617 | 23.02 | 22.86 | 22.60 |
| BSS 79 | 114.5394030 | 38.8844577 | 23.08 | 22.86 | 22.43 |
| BSS 80 | 114.5282537 | 38.8767212 | 23.03 | 22.88 | 22.50 |
| BSS 81 | 114.5306900 | 38.8770293 | 23.08 | 22.89 | 22.55 |
| BSS 82 | 114.5385251 | 38.8771382 | 23.00 | 22.90 | 22.66 |
| BSS 83 | 114.5235814 | 38.8729527 | 23.16 | 22.92 | 22.48 |
| BSS 84 | 114.5355456 | 38.8739955 | 23.18 | 22.92 | 22.46 |
| BSS 85 | 114.5333547 | 38.8705373 | 23.05 | 22.93 | 22.76 |
| BSS 86 | 114.5268290 | 38.8888513 | 23.08 | 22.93 | 22.65 |
| BSS 87 | 114.5286345 | 38.8824567 | 23.17 | 22.95 | 22.57 |
| BSS 88 | 114.5272080 | 38.8829733 | 23.15 | 22.97 | 22.68 |
| BSS 89 | 114.5297549 | 38.8842508 | 23.17 | 22.97 | 22.74 |
| BSS 90 | 114.5374061 | 38.8851489 | 23.23 | 22.98 | 22.72 |
| BSS 91 | 114.5305231 | 38.8777378 | 23.19 | 22.99 | 22.63 |
| BSS 92 | 114.5306248 | 38.8655249 | 23.12 | 23.00 | 22.44 |
| BSS 93 | 114.5298495 | 38.8808827 | 23.18 | 23.00 | 22.55 |
| BSS 94 | 114.5250029 | 38.8861768 | 23.26 | 23.00 | 22.62 |
| BSS 95 | 114.5319072 | 38.8857620 | 23.20 | 23.01 | 22.75 |
| BSS 96 | 114.5766634 | 38.8573333 | 23.27 | 23.02 | 22.64 |
| BSS 97 | 114.5540530 | 38.8462298 | 23.17 | 23.03 | 22.62 |
| BSS 98 | 114.5446661 | 38.8786382 | 23.24 | 23.04 | 22.85 |
| BSS 99 | 114.5416242 | 38.8825834 | 23.19 | 23.04 | 22.57 |
| BSS 100 | 114.5559916 | 38.8782646 | 23.32 | 23.06 | 22.67 |
| BSS 101 | 114.5467694 | 38.8799242 | 23.34 | 23.07 | 22.71 |
| BSS 102 | 114.5245139 | 38.8773725 | 23.24 | 23.07 | 22.71 |
| BSS 103 | 114.5335661 | 38.8876156 | 23.24 | 23.07 | 22.85 |
| BSS 104 | 114.5338201 | 38.8808881 | 23.32 | 23.07 | 22.79 |
| BSS 105 | 114.5251903 | 38.8708786 | 23.30 | 23.07 | 22.63 |
| BSS 106 | 114.5155847 | 38.8515763 | 23.25 | 23.08 | 22.62 |
| BSS 107 | 114.5482144 | 38.8762432 | 23.24 | 23.09 | 22.69 |
| BSS 108 | 114.5283801 | 38.8804424 | 23.32 | 23.09 | 22.73 |
| BSS 109 | 114.5272202 | 38.8806563 | 23.33 | 23.09 | 22.75 |
| BSS 110 | 114.5329037 | 38.8787814 | 23.21 | 23.10 | 22.82 |
| BSS 111 | 114.5648250 | 38.8809186 | 23.39 | 23.10 | 22.67 |
| BSS 112 | 114.5655476 | 38.8353859 | 23.08 | 23.11 | 22.62 |
| BSS 113 | 114.5340609 | 38.8672425 | 23.38 | 23.11 | 22.72 |
| BSS 114 | 114.5241875 | 38.8826388 | 23.39 | 23.11 | 22.76 |
| BSS 115 | 114.5440484 | 38.8728605 | 23.33 | 23.12 | 22.70 |
| BSS 116 | 114.5318474 | 38.8804939 | 23.31 | 23.12 | 22.82 |
| BSS 117 | 114.4975565 | 38.8498301 | 23.36 | 23.14 | 22.69 |
| BSS 118 | 114.5308869 | 38.8858920 | 23.31 | 23.14 | 22.65 |
| BSS 119 | 114.5319236 | 38.8814812 | 23.39 | 23.14 | 22.77 |
| BSS 120 | 114.5365736 | 38.8749561 | 23.34 | 23.14 | 22.74 |
| BSS 121 | 114.5548031 | 38.8770840 | 23.36 | 23.15 | 22.84 |
| BSS 122 | 114.5698279 | 38.8632929 | 23.43 | 23.15 | 22.88 |
| BSS 123 | 114.5429103 | 38.8833364 | 23.26 | 23.15 | 22.81 |
| BSS 124 | 114.5180654 | 38.8526066 | 23.35 | 23.15 | 22.81 |
| BSS 125 | 114.5713938 | 38.8644595 | 23.41 | 23.15 | 22.81 |
| BSS 126 | 114.5151887 | 38.8881692 | 23.29 | 23.16 | 22.85 |
| BSS 127 | 114.4971710 | 38.8503894 | 23.39 | 23.18 | 22.80 |
| BSS 128 | 114.5389324 | 38.8662627 | 23.35 | 23.18 | 22.72 |
| BSS 129 | 114.5653667 | 38.8735289 | 23.35 | 23.19 | 22.80 |
| BSS 130 | 114.5290415 | 38.8850904 | 23.46 | 23.19 | 22.82 |
| BSS 131 | 114.5263335 | 38.8860022 | 23.29 | 23.20 | 22.80 |
| BSS 132 | 114.5704264 | 38.8781784 | 23.35 | 23.20 | 22.91 |
| BSS 133 | 114.5450942 | 38.8616024 | 23.42 | 23.21 | 22.90 |
| BSS 134 | 114.5261968 | 38.8738325 | 23.43 | 23.21 | 22.75 |
| BSS 135 | 114.5411974 | 38.8462718 | 23.46 | 23.21 | 22.85 |
| BSS 136 | 114.5459761 | 38.8828031 | 23.37 | 23.21 | 22.86 |
| BSS 137 | 114.5219796 | 38.8885754 | 23.44 | 23.25 | 22.97 |
| BSS 138 | 114.5550069 | 38.8277938 | 23.47 | 23.26 | 22.97 |
| BSS 139 | 114.5343111 | 38.8853578 | 23.49 | 23.27 | 22.86 |
| BSS 140 | 114.5707653 | 38.8713824 | 23.52 | 23.27 | 22.85 |
| BSS 141 | 114.5633208 | 38.8755186 | 23.52 | 23.28 | 22.91 |
| BSS 142 | 114.5372475 | 38.8697969 | 23.58 | 23.29 | 22.83 |
| BSS 143 | 114.5128112 | 38.8761214 | 23.54 | 23.30 | 22.95 |
| BSS 144 | 114.5303288 | 38.8832148 | 23.55 | 23.31 | 22.99 |
| BSS 145 | 114.5293403 | 38.8792390 | 23.56 | 23.31 | 22.81 |
| BSS 146 | 114.5403815 | 38.8621857 | 23.46 | 23.32 | 22.93 |
| BSS 147 | 114.5328409 | 38.8759082 | 23.58 | 23.34 | 23.02 |
| BSS 148 | 114.5058275 | 38.8390039 | 23.55 | 23.35 | 22.96 |
| BSS 149 | 114.5354601 | 38.8773111 | 23.55 | 23.38 | 22.94 |
| BSS 150 | 114.5289120 | 38.8672031 | 23.58 | 23.38 | 22.88 |
| BSS 151 | 114.5165945 | 38.8734688 | 23.51 | 23.39 | 23.01 |
| BSS 152 | 114.5364602 | 38.8814663 | 22.50 | 22.51 | 22.27 |
| BSS 153 | 114.5340522 | 38.8779415 | 22.62 | 22.62 | 22.42 |
| BSS 154 | 114.5347666 | 38.8829015 | 22.75 | 22.79 | 22.62 |
| BSS 155 | 114.5593850 | 38.8513222 | 22.80 | 22.76 | 22.40 |
| BSS 156 | 114.5358572 | 38.8710266 | 22.88 | 22.91 | 22.47 |
| BSS 157 | 114.5439332 | 38.8315146 | 22.97 | 22.98 | 22.51 |
| BSS 158 | 114.5550096 | 38.8666358 | 22.95 | 22.60 | 22.59 |
| BSS 159 | 114.5358955 | 38.8824612 | 23.24 | 22.88 | 22.63 |
| BSS 160 | 114.5736822 | 38.8698082 | 23.27 | 22.95 | 22.64 |
| BSS 161 | 114.5383375 | 38.8831536 | 23.28 | 22.89 | 22.53 |
| BSS 162 | 114.5363135 | 38.8768683 | 23.34 | 22.97 | 22.70 |
| BSS 163 | 114.5411630 | 38.8818491 | 23.37 | 22.99 | 22.73 |
| BSS 164 | 114.5385990 | 38.8814390 | 23.46 | 23.16 | 22.74 |
| BSS 165 | 114.5303744 | 38.8839579 | 23.53 | 23.22 | 22.90 |
| BSS 166 | 114.5342489 | 38.8869653 | 23.55 | 23.52 | 23.12 |
| BSS 167 | 114.5326253 | 38.8762184 | 23.56 | 23.18 | 22.82 |
| BSS 168 | 114.5274273 | 38.8465093 | 22.44 | 22.52 | 22.09 |
| BSS 169 | 114.5294680 | 38.8762898 | 21.67 | - | 21.58 |
| BSS 170 | 114.5590138 | 38.8529876 | 22.61 | - | 22.13 |
| BSS 171 | 114.5352678 | 38.8831155 | 23.27 | - | 22.54 |
| BSS 172 | 114.5293589 | 38.8824958 | 23.28 | - | 22.54 |
| BSS 173 | 114.5331303 | 38.8781672 | 22.37 | - | 21.82 |
| BSS 174 | 114.5372462 | 38.8804816 | 22.38 | - | 21.92 |
| BSS 175 | 114.5371350 | 38.8825563 | 23.11 | - | 22.68 |
| BSS 176 | 114.5299404 | 38.8833588 | 23.03 | - | 22.66 |
| BSS 177 | 114.5377141 | 38.8839299 | 22.28 | - | 21.96 |
| BSS 178 | 114.5318896 | 38.8816916 | 23.40 | - | 22.72 |
| BSS 179 | 114.5338975 | 38.8878113 | 22.30 | - | 21.76 |
| BSS 180 | 114.5354840 | 38.8848507 | 21.99 | - | 21.99 |
| BSS 181 | 114.5416767 | 38.8787643 | 22.16 | - | 21.86 |
| BSS 182 | 114.5274273 | 38.8465093 | 22.44 | - | 22.09 |
| BSS 183 | 114.5430587 | 38.8788861 | 22.52 | - | 22.27 |
| BSS 184 | 114.6046393 | 38.8739340 | - | 21.61 | 21.50 |
| BSS 185 | 114.4732159 | 38.8794161 | - | 22.22 | 22.11 |
| BSS 186 | 114.5948464 | 38.8317186 | - | 22.29 | 22.18 |
| BSS 187 | 114.4921101 | 38.8826003 | - | 22.36 | 22.13 |
| BSS 188 | 114.4795474 | 38.8950070 | - | 22.42 | 22.00 |
| BSS 189 | 114.5742838 | 38.8787606 | - | 22.51 | 22.11 |
| BSS 190 | 114.5769900 | 38.8517555 | - | 22.53 | 22.25 |
| BSS 191 | 114.5235357 | 38.9041986 | - | 22.57 | 22.32 |
| BSS 192 | 114.6028209 | 38.8986391 | - | 22.59 | 22.26 |
| BSS 193 | 114.5780235 | 38.8817962 | - | 22.63 | 22.39 |
| BSS 194 | 114.5205417 | 38.9003089 | - | 22.65 | 22.44 |
| BSS 195 | 114.5574956 | 38.8950661 | - | 22.68 | 22.37 |
| BSS 196 | 114.6020290 | 38.8716163 | - | 22.69 | 22.43 |
| BSS 197 | 114.4870399 | 38.8486762 | - | 22.73 | 22.39 |
| BSS 198 | 114.5278361 | 38.9056871 | - | 22.74 | 22.37 |
| BSS 199 | 114.4868008 | 38.8777003 | - | 22.75 | 22.48 |
| BSS 200 | 114.5698058 | 38.8856298 | - | 22.80 | 22.43 |
| BSS 201 | 114.5631611 | 38.9001108 | - | 22.80 | 22.45 |
| BSS 202 | 114.5728569 | 38.9152703 | - | 22.80 | 22.53 |
| BSS 203 | 114.5344124 | 38.9094217 | - | 22.82 | 22.45 |
| BSS 204 | 114.4987279 | 38.9233287 | - | 22.84 | 22.50 |
| BSS 205 | 114.4950878 | 38.9045856 | - | 22.90 | 22.61 |
| BSS 206 | 114.5542729 | 38.8926652 | - | 22.93 | 22.61 |
| BSS 207 | 114.4846796 | 38.8934777 | - | 22.96 | 22.63 |
| BSS 208 | 114.4793021 | 38.8865969 | - | 22.96 | 22.81 |
| BSS 209 | 114.4748604 | 38.9055783 | - | 22.98 | 22.61 |
| BSS 210 | 114.5080023 | 38.9026343 | - | 22.97 | 22.72 |
| BSS 211 | 114.5573887 | 38.8903576 | - | 22.98 | 22.63 |
| BSS 212 | 114.5204611 | 38.9028901 | - | 23.08 | 22.85 |
| BSS 213 | 114.5705620 | 38.8861123 | - | 23.09 | 22.81 |
| BSS 214 | 114.5548202 | 38.9085582 | - | 23.11 | 22.72 |
| BSS 215 | 114.5422886 | 38.8977372 | - | 23.12 | 22.84 |
| BSS 216 | 114.4864816 | 38.8823681 | - | 23.16 | 22.77 |
| BSS 217 | 114.5658903 | 38.8861262 | - | 23.17 | 22.84 |
| BSS 218 | 114.5066897 | 38.8939685 | - | 23.20 | 22.79 |
| BSS 219 | 114.4888325 | 38.8881818 | - | 23.27 | 22.80 |
| BSS 220 | 114.5077125 | 38.9123421 | - | 23.27 | 22.81 |
| BSS 221 | 114.4809893 | 38.8830761 | - | 23.27 | 23.04 |
| BSS 222 | 114.5560389 | 38.8862473 | - | 23.29 | 23.07 |
| BSS 223 | 114.4463878 | 38.8771839 | - | 22.20 | 22.10 |
| BSS 224 | 114.3957223 | 38.8532619 | - | 22.65 | 22.27 |
| BSS 225 | 114.4183885 | 38.8968389 | - | 22.86 | 22.52 |
| BSS 226 | 114.4386092 | 38.8140150 | - | 22.90 | 22.59 |
| BSS 227 | 114.3704635 | 38.8294846 | - | 23.09 | 22.73 |
| BSS 228 | 114.5111720 | 38.9412987 | - | 22.61 | 22.43 |
| BSS 229 | 114.5357260 | 39.0140900 | - | 22.74 | 22.47 |
| BSS 230 | 114.4848049 | 38.9588305 | - | 22.99 | 22.67 |
| BSS 231 | 114.7046122 | 38.8578500 | - | 22.18 | 21.92 |
| BSS 232 | 114.6843307 | 38.9221184 | - | 23.28 | 22.83 |
| 0 | 20 | 56 | 160 | 745 | 0.21 | ||
| 20 | 60 | 71 | 253 | 1137 | 0.31 | ||
| 60 | 100 | 41 | 142 | 592 (1) | 0.21 | ||
| 100 | 180 | 43 (1) | 121 (1) | 497 (3) | 0.18 | ||
| 180 | 500 | 15 (5) | 77 (11) | 248 (27) | 0.09 |
Note. — The values listed out of the parenthesis correspond to the number of stars assumed to belong to the cluster (and thus used in the analysis), while those in the parenthesis are estimated to be contaminating field stars (see Sect. 4.2).