Noise invoked resonances near a homoclinic bifurcation
in the glow discharge plasma
Abstract
Stochastic Resonance (SR) and Coherence Resonance (CR) have been studied experimentally in the discharge plasma close to a homoclinic bifurcation. For the SR phenomena, it is observed that a superimposed subthreshold periodic signal can be recovered via stochastic modulations of the discharge voltage. Furthermore, it is realized that even in the absence of a subthreshold deterministic signal, the system dynamics can be recovered and optimized using noise. This effect is defined as CR in the literature. In the present experiments, induction of SR and CR are quantified using the Absolute Mean Difference (AMD) and Normalized Variance (NV) techniques respectively. AMD is a new statistical tool to quantify regularity in the stochastic resonance and is independent of lag.
pacs:
52.80.Hc 05.40.-a 05.45.Xt 05.20.-yI Introduction
Stochastic Resonance (SR) is a phenomena in which the response of the nonlinear system to a weak periodic input signal is amplified/optimized by the presence of a particular level of noise JPhysA:benzi , i.e, a previously untraceable subthreshold signal applied to a nonlinear system, can be detected in the presence of noise. Furthermore, there exists an optimal level of noise for which the most efficient detection takes place prl:bruce ; pre:parmananda . SR has been observed in many physical, chemical and biological systems prl:bruce ; pre:parmananda ; JStatPhys:moss ; prl:longtin ; JPhysChem:foster ; JPhysChem:Amemiya ; pre:santos ; prl:kitajo . Coherence Resonance (CR) is the phenomena wherein regularity of the dynamical behavior emerges by virtue of an interplay between the autonomous nonlinear dynamics and the superimposed stochastic fluctuations. In CR, analogous to SR, the extent of provoked regularity depends upon the amplitude of added noise prl:gang ; prl:pikovsky . The CR effect too has been studied exhaustively, both theoretically and experimentally, in a wide range of nonlinear systems prl:Lin I ; pop:dinklage ; prl:Giacomelli ; pre:miyakawa ; pre:Santos1 ; prl:avila .
The nonlinearity in plasma systems arises from the most fundamental processes, namely the wave-wave and wave-particle interactions. Different modes may be excited due to nonlinear coupling of waves and plasma components and the character of the oscillations is primarily determined by the plasma parameters and perturbations pr:duncan ; pr:sturrock ; pop:Shokri . In the present work, possibility of observing noise invoked resonances in a glow discharge plasma is explored. However, as a precursor to the experiments involving noise, a systematic analysis of the autonomous dynamics is performed. This includes identification and characterization of the bifurcation in the vicinity of the set-point employed for the noise related experiments.
II Experimental setup
The experiments were performed in a hollow cathode dc glow discharge plasma. The schematic diagram of the experimental setup is presented in Fig 1. A hollow Stainless Steel (S.S) tube of length and of diameter () 45 mm was used as the cathode and a central rod of length and 1.6 mm was employed as the anode. The whole assembly was mounted inside a vacuum chamber and was pumped down to a pressure of about 0.001 mbar using a rotary pump. The chamber was subsequently filled with the Argon gas up to a pre-determined value of neutral pressure by a needle valve. Finally a discharge was struck by a dc Discharge Voltage (DV), which could be varied in the range of 01000 V.

The noise and subthreshold periodic square pulse generators were coupled with DV through a capacitor [Fig. 1]. In all the experiments DV was used as the bifurcation parameter while the remaining system parameters like pressure etc., were maintained constant. The system observable was the electrostatic floating potential, which was measured using a Langmuir probe of diameter = 0.5 mm and length 2 mm. The tip of this Langmuir probe was placed in the center of the electrode system as indicated in Fig. 1. The plasma density and the electron temperature were determined to be of the order of 107cm-3 and 34 eV respectively. Furthermore, the electron plasma frequency () was observed to be around 28 MHz, whereas the ion plasma frequency () was measured to be around 105 kHz.
III Autonomous Dynamics
Before studying the noise induced dynamics, we characterized the behavior of the autonomous system. Not surprisingly, it was observed that at different chamber pressures, discharge struck at different voltages. Fig 2 shows the breakdown voltage () at different , where p and d are the filling pressure and radius of the cathode respectively. This breakdown voltage () initially decreases with an increase in , goes through a minimum value resembling a typical Paschen curve and then begins to increase with increasing . It is observed that the system is excitable for the region Paschen minima. In the lower side it shows Self Organized Criticality Physleta:jaman . In this excitable domain, the system dynamics are irregular (complex) at the initial stages of the discharge voltage and upon increasing DV they become regular (period-one) as shown in Fig 3. Further augmentation of DV modifies the oscillation profile and results in the induction of typical relaxation oscillations chaos:Nurujjaman .


The time period (T) of these relaxation oscillations increases dramatically upon further incrementing DV. This eventually results in the vanishing of the limit cycle behavior beyond a critical DV (). For larger values of DV, the autonomous dynamics exhibit a steady state fixed point behavior. Time traces from top to bottom in the left panel of Fig 4 depict this period lengthening of the oscillatory behavior. A systematic analysis of the increment in the period (T), presented in Fig. 4[(a) right panel], indicates that the autonomous dynamics undergo a critical (exponential) slowing down. Consequently, the vs T curve can be fitted by a straight line, where is the bifurcation point separating the oscillatory domain and the steady state behavior. The results of Fig 4 indicate that the system dynamics undergo a homoclinic bifurcation at resulting in the loss of oscillations.

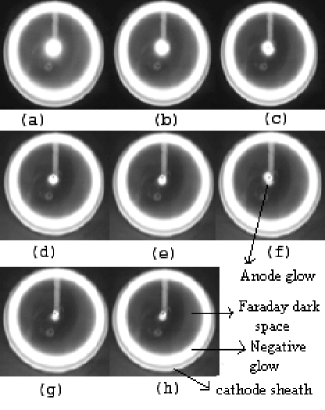
An anode glow is observed with these oscillations. Figs 5(a) shows that the glow with largest size, appears when the discharge is struck at a typical pressure of 0.95 mbar and its size decreases with increase in the DV until it finally disappears [Figs 5(a)5(h)]. This may some types of unstable structure in the plasma and produces such oscillation of the instabilities chaos:Nurujjaman .


IV Noise induced resonance in glow discharge
In this section experimental results involving noise generated resonances, namely SR and CR are presented.
IV.1 Stochastic Resonance
For our experiments on stochastic resonance, the reference voltage was chosen such that and therefore the autonomous dynamics, by virtue of an underlying homoclinic bifurcation, exhibit steady state behavior. The discharge voltage was thereafter perturbed , where is the subthreshold periodic pulse train chosen for which , (subthreshold signal does not cause the system to cross over to the oscillatory regime) and is the added Gaussian white noise with amplitude . Subthreshold periodic square pulse of width and duration 2 ms was constructed using Fluke PM5138A function generator. Meanwhile, the gaussian noise produced using the HP 33120A noise generator was subsequently amplified using a noise amplifier.
Fig. 6 show time series of the system response in the presence of an identical subthreshold signal for three different amplitudes of imposed noise. The subthreshold periodic pulse train is also plotted, in the top most graph of the left panel, for comparison purposes. Fig. 6(a) shows that there is little correspondence between the subthreshold signal and the system response for a low noise amplitude. However, there is excellent correspondence at an intermediate noise amplitude [Fig. 6(b)]. Finally, at higher amplitudes of noise the subthreshold signal is lost amidst stochastic fluctuations of the system response [Fig. 6(c)]. Absolute mean difference (AMD), used to quantify the information transfer between the subthreshold signal and the system response, is defined as . and are the inter-peak interval of the response signal and mean peak interval of the subthreshold periodic signal respectively.
Fig 6(d) shows that the experimentally computed AMD versus noise amplitude D curve has a unimodal structure typical for the SR phenomena. The minima in this curve corresponds to the optimal noise level for which maximum information transfer between the input and the output takes place.
IV.2 Coherence Resonance
For the experiments on coherence resonance DV ) was located such that the floating potential fluctuations exhibit fixed point behavior. In order to minimize the effect of parameter drift, a set-point () quite far from the homoclinic bifurcation () was chosen. Subsequently, superimposed noise on the discharge voltage was increased and the provoked dynamics analyzed. The normalized variance (NV) was used to quantify the extent of induced regularity. It is defined as , where is the time elapsed between successive peaks. It is evident that more regular the induced dynamics the lower the value of the computed NV. For purely periodic dynamics the NV goes to zero.
Fig. 7 (left panel) show the time series of the floating potential fluctuations for different noise levels and Fig 7(d) (right panel) is the experimental NV curve as a function of noise amplitude D. The point (a) in Fig 7(d) (time series shown in Fig. 7(a)) is associated with a low level of noise where the activation threshold is seldom crossed, generating a sparsely populated irregular spike sequence. As the noise amplitude is increased, the NV decreases, reaching a minimum (b) in Fig 7(d) (time series shown in Fig. 7(b)) corresponding to an optimum noise level where maximum regularity of the generated spike sequence is observed. As the amplitude of superimposed noise is increased further, the observed regularity is destroyed manifested by an increase in the NV; label (c) in Fig 7(d) (time series shown in Fig. 7(c)). This is a consequence of the dynamics being dominated by noise.
V Discussion
The effect of noise has been studied experimentally near a homoclinic bifurcation in glow discharge plasma system. Our study demonstrates the emergence of SR for periodic subthreshold square pulse signals and the induction of CR via purely stochastic fluctuations. In SR experiments, the efficiency of information transfer was quantified using AMD instead of the power norm which has been utilized elsewhere pre:parmananda . The advantage of using this method in comparison to the power norm () pre:parmananda lies in the fact that AMD remains independent of the lag between the measured floating potential and the applied periodic square pulse. This is of relevance in our experimental system, where invariably there exists a lag, at times varying in time due to the parameter drifts. For the CR experiments it was occasionally observed that while with an initial increase in noise amplitude (D) NV reaches a minimum, the subsequent rise of NV for even higher amplitudes of noise was suppressed. This leads to the modification of the unimodal profile, a signature of the CR phenomenon. A possible explanation for this suppression is that by virtue of the superimposed high frequency noise (bandwidth 500 KHz) and fast responding internal plasma dynamics, the system has the capability of exciting high frequency regular modes within the ion plasma frequency (105 kHz). This in turn leads to the persistence of low NV values. Finally, in Refs prl:Lin I ; pop:dinklage both the destructive and constructive role of noise (CR only) have been reported for glow discharge and magnetized rf discharge plasma systems respectively. However, both these experiments were carried out in the vicinity of the Hopf bifurcation. In contrast, for the present work we studied both stochastic (SR) and coherence resonance (CR) in the neighborhood of the homoclinic bifurcation.
Appendix A Calculation of Absolute Mean Difference(AMD)
Regularity in the stochastic resonance has been done by calculating cross-correlation (). But in this case this is not suitable, because, as we also measuring floating potential at different location in side the plasm there is always a lag between periodic signal that is applied in the plasma and output. This lag also varies with time because the plasma conditions are changing continuously with time. Therefore cross-correlation between output and input signal gives wrong estimation. So we have proposed a statistics which will be independent of lag and defined as follows:
1. First calculate mean inter-peak distance () of the periodic signal.
2. Calculate inter-peak distances () of the output signal.
3. Calculate ()
4. Take absolute.
5. This will perfectly describe the regularity for stochatic resonance for periodic subthreshold signa.
and this may be called Absolute Mean Difference (AMD).
where , are the output signal inter-peak distance and mean peak distance of the subthreshold periodic signal respectively.
References
- (1) Roberto Benzi, Alfonso Sutera, and Angelo Vulpiani, J. Phys. A: Math Gen. 14, L453-L457 (1981).
- (2) Hu Gang, T. Ditzinger, C. Z. Ning, and H. Haken, Phys. Rev. Lett. 71, 807 (1993).
- (3) Arkady S. Pikovsky and Jürgen Kurths,Phys. Rev. Lett. 78, 777 (1997).
- (4) Bruce Mc Namara, Kurt Wiesenfeld, and Rajarshi Roy, Phys. Rev. Lett. 60, 2626 (1988).
- (5) P. Parmananda, Gerardo J. Escalera Santos, M. Rivera, and Kenneth Showalter, Phys. Rev. E 71, 031110 (2005).
- (6) F. Moss, A. Bulsara, and M. F. Shlesinger, J. Stat. Phys. 70, 1 (1993).
- (7) A. Longtin, A. Bulsara, and F. Moss, Phys. Rev. Lett. 67, 656 (1991).
- (8) A. Föster, M. Merget, and F. W. Schneider, J. Phys. Chem. 100, 4442 (1996).
- (9) T. Amemiya, T. Ohmori, M. Nakaiawa, and T. Yamaguchi, J. Phys. Chem. 102, 4537 (1998).
- (10) G. J. Escalera Santos and P. Parmananda, Phys. Rev. E 65, 067203 (2002).
- (11) Keiichi Kitajo, Daichi Nozaki, Lawrence M. Ward and Yoshiharu Yamamoto, Phys. Rev. Lett.90, 218103 (2003).
- (12) Lin I and Jeng-Mei Liu, Phys. Rev. Lett. 74, 3161 (1995).
- (13) A. Dinklage, C. Wilke and T. Klinger, Phys. Plasmas 6, 2968 (1999).
- (14) Giovanni Giacomelli, Massimo Giudici, Salvador Balle, and Jorge R. Tredicce, Phys. Rev. Lett.84, 3298 (2000).
- (15) Kenji Miyakawa and Hironobu Isikawa, Phys. Rev. E 66, 046204 (2002).
- (16) Gerardo J. Escalera Santos, M. Rivera, M. Eiswirth, and P. Parmananda, Phys. Rev. E 70, 021103 (2004).
- (17) Jhon F. Martine Avila, Hugo L. D. de S. Cavacante, and J.R. Rios Leite, Phys. Rev. Lett. 93, 144101 (2004).
- (18) Duncan H. Looney, and Sanborn C. Brown, Phys. Rev. 93, 965 (1954).
- (19) P. A. Sturrock, Phys. Rev. 117, 1426 (1960).
- (20) B. Shokri, S. M. Khorashadizadeh, Phys. Plasmas 13, 052116 (2006).
- (21) Md. Nurujjaman, and A.N.Sekar Iyengar, Phys Letts A 360, 717 (2007).
- (22) Md. Nurujjaman, Ramesh Narayanan, and A. N. Sekar Iyengar, CHAOS 17, 043121 (2007).