Fundamental questions relating to ion conduction in disordered solids
Abstract
A number of basic scientific questions relating to ion conduction in homogeneously disordered solids are discussed. The questions deal with how to define the mobile ion density, what can be learned from electrode effects, what is the ion transport mechanism, the role of dimensionality, and what are the origins of the mixed-alkali effect, of time-temperature superposition, and of the nearly-constant loss. Answers are suggested to some of these questions, but the main purpose of the paper is to draw attention to the fact that this field of research still presents several fundamental challenges.
pacs:
66.30.H-; 77.22.Gm; 72.80.NgI Introduction
Ion conduction in glasses, polymers, nanocomposites, highly defective crystals, and other disordered solids plays an increasingly important role in technology. Considerable progress has been made recently, for instance with solid-oxide fuel cells, electrochemical sensors, thin-film solid electrolytes in batteries and supercapacitors, electrochromic windows, oxygen-separation membranes, functional polymers, etc.kna00 ; dub03 ; kha04 ; kna04 ; vin06 ; hui07 ; nik07 ; gro08 ; fun08 The applied perspective is an important catalyst for work in this field. In this paper, however, the focus is on basic scientific questions. This is relevant because ion transport in disordered materials remains poorly understood. There is no simple, broadly accepted model; it is not even clear whether any generally applicable, simple model exists. Given the intense current interest in the field – with hundreds of papers published each year – it is striking that there is no general consensus on several fundamental questions.bun98 This is in marked contrast to other instances of electrical conduction in condensed matter where a much better understanding has been achieved, e.g., for electronic conduction in metals, semiconductors, and superconductors, as well as for ion conduction by defects in crystals.
This paper summarizes and discusses basic scientific questions relating to ion conduction in (mainly) homogeneously disordered solids owe63 ; tom77 ; tul80 ; ing87 ; vin87 ; kre89 ; ang90 ; mar91 ; ang92 ; hei03 ; mai95 . The main motivation is not to suggest or provide answers, but to inspire to further research into the fundamentals of ion conduction in disordered solids. A question that is not addressed below, which has been a point of controversy particularly during the last decade, is how to best represent ac data, via the conductivity or the electric modulus,alm1983 ; dyr91 ; ell94 ; moy94 . By now this has been thoroughly discussed in the literature, and we refer the interested reader to the discussion in Refs. nga00, ; sid01, ; hod05, that present and summarize the differing viewpoints.
II How to define mobile ion density?
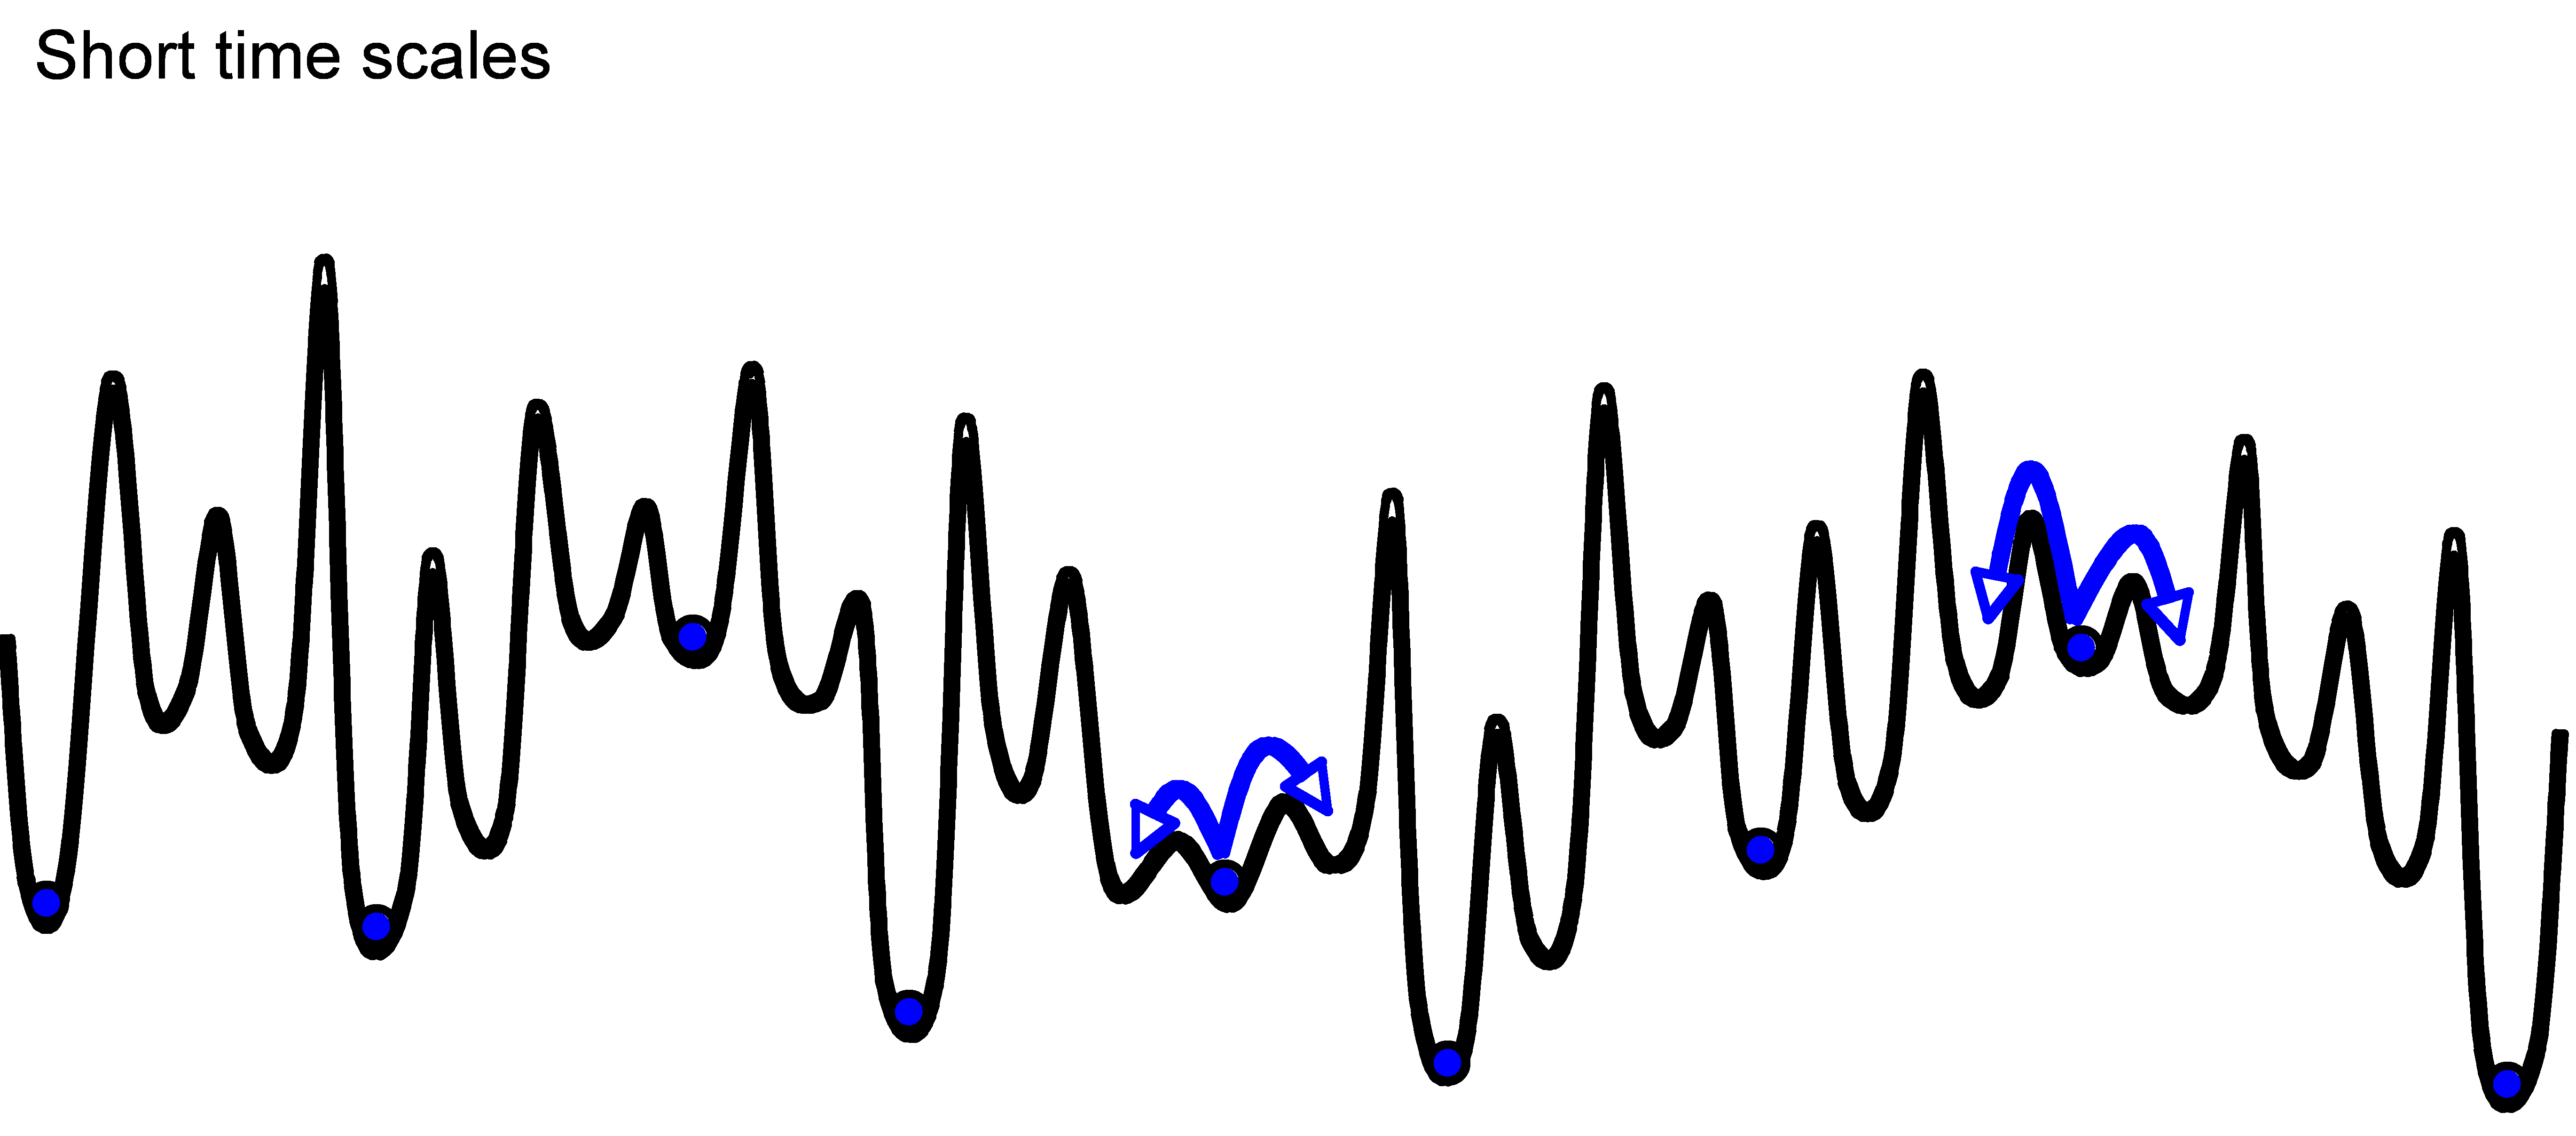
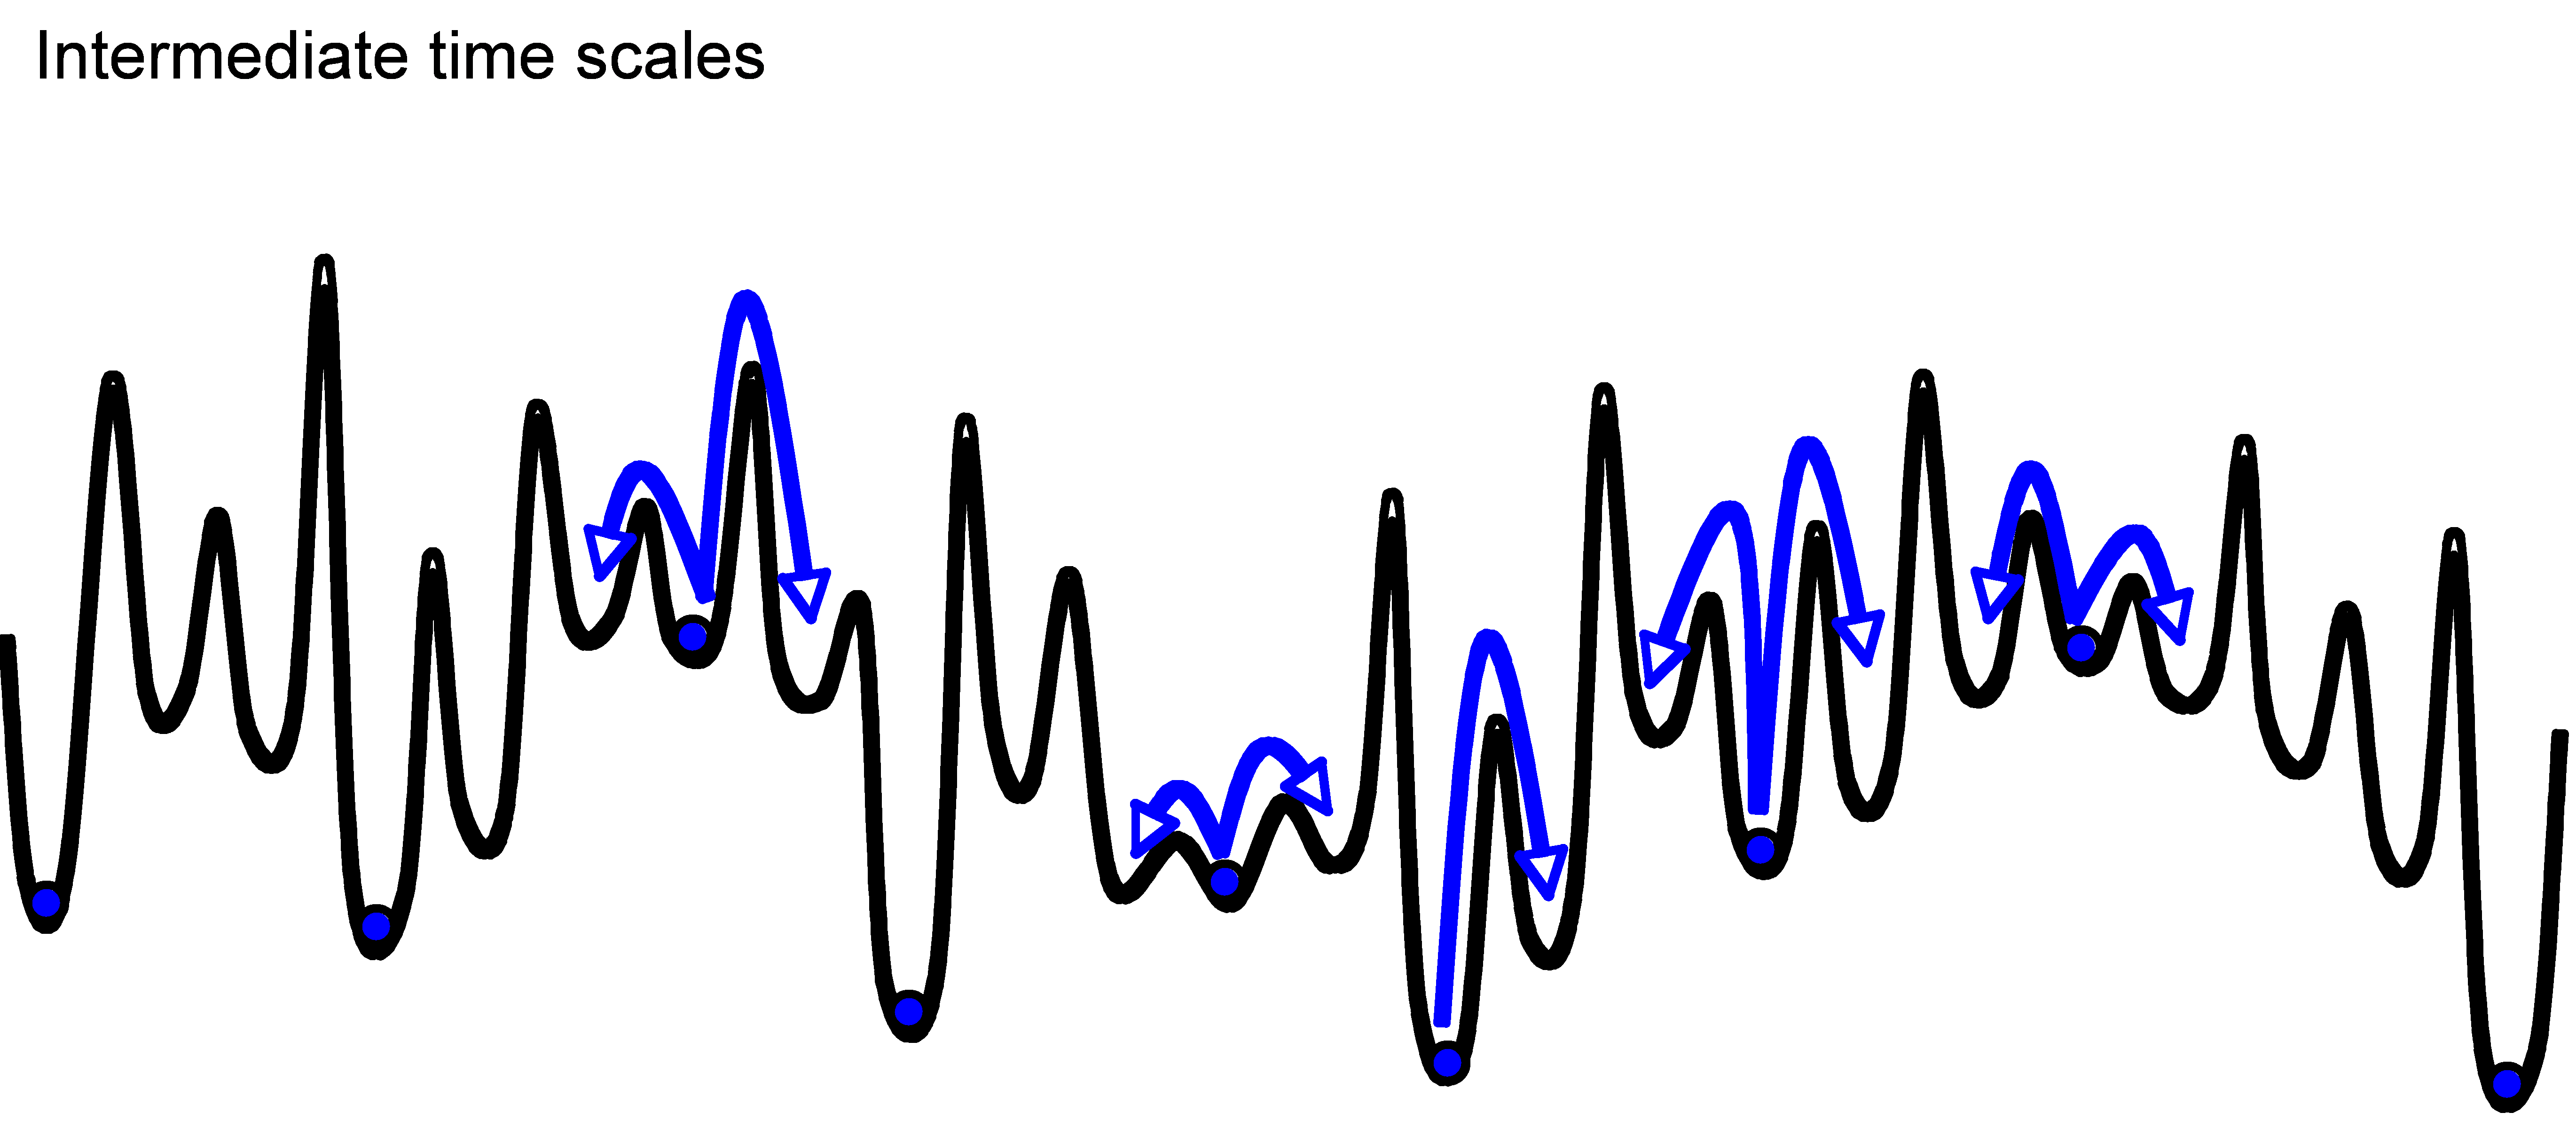
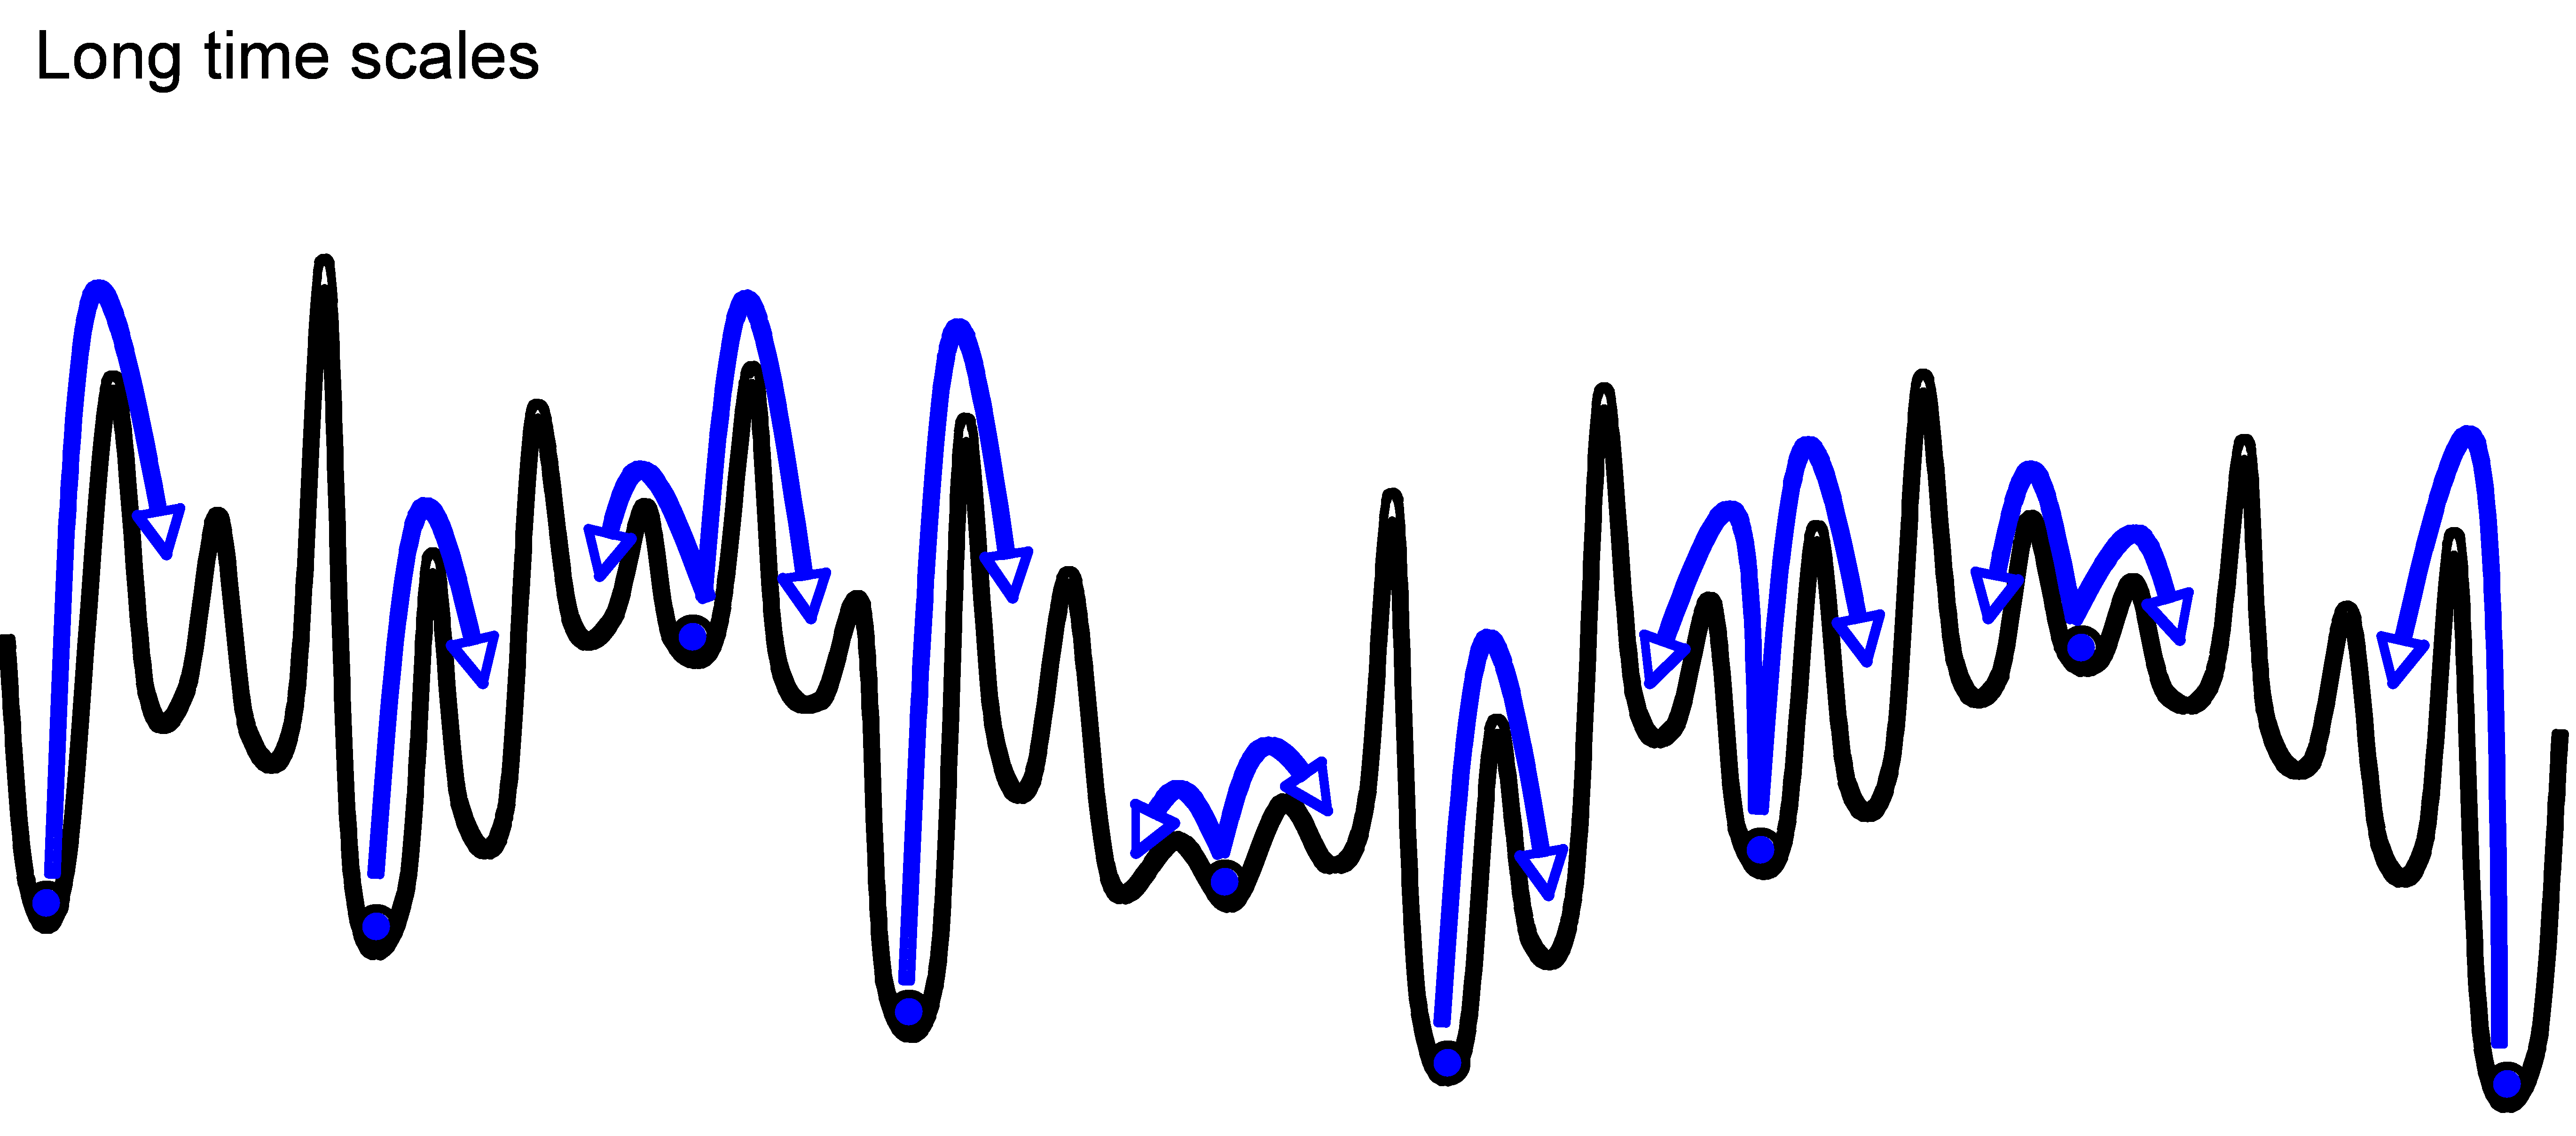
Ion motion in disordered solids is fundamentally different from electronic conduction in crystalline solids. Ions are much heavier than electrons so their motion is far less governed by quantum mechanical descriptions. Below typical vibrational frequencies ( GHz) ion motion can be described by activated hopping between (usually) charge compensating sites. Moving ions carry charge, of course, and thus produce an electrical response which can be detected by a variety of experimental techniques. Unlike crystals, the potential energy landscape experienced by an ion in a glass or otherwise disordered solid is irregular and contains a distribution of effective depths and barrier heights, as sketched in Fig. 1. The effective energies result from differing binding energies at residence sites and differing saddle point energies between residence sites, and they are influenced by interactions between the ions. With increasing time scale, the ions can explore larger parts of space by overcoming higher energy barriers.
Following standard arguments, suppose ions with charge are subjected to an electric field . The field exerts the force on each ion, resulting in an average drift velocity in the field direction. The ion mobility is defined by . If the number of mobile ions per unit volume is , the current density is given by . Thus we obtain the following expression for the dc conductivity defined by :
| (1) |
This equation expresses the simple fact that the conductivity is proportional to the ion charge, to the number of mobile ions, and to how easily an ion is moved through the solid. As such, Eq. (1) is an excellent starting point for discussing how the conductivity depends on factors like temperature and chemical composition. Or is it? We shall now argue that the above conventional splitting of the conductivity into a product of mobility and mobile ion density involves non-trivial assumptions.
Except at very high temperatures ion motion in solids proceeds via jumps between different ion sites. Most of the time an ion vibrates in a potential-energy minimum defined by the surrounding matrix. This motion does not contribute to the frequency-dependent conductivity except at frequencies above the GHz range; only ion jumps between different minima matter. The mobility reflects the long-time average ion displacement after many jumps. The fact that ions spend most of their time vibrating in potential energy minima, however, makes the definition of mobile ion density less obvious: How to define the number of mobile ions when all ions are immobile most of the time?
Intuitively, Eq. (1) still makes sense. Imagine a situation where some ions are very tightly bound (“trapped”) while others are quite mobile. In this situation one would obviously say that the density of mobile ions is lower than the total ion density. The problem, however, is that the tightly bound ions sooner or later become mobile, and the mobile ions sooner or later become trapped: By ergodicity, in the long run all ions of a given type must contribute equally to the conductivity. Thus on long time scales the “mobile” ion density must be the total ion concentration. This “long run” may be years or more, and ions trapped for so long are for all practical purposes immobile. Nevertheless, unless there are infinite barriers in the solid, which is unphysical, in the very long run all ions are equivalent.
The question how many ions contribute to the conductivity makes good sense, however, if one specifies a time scale. Thus for a given time it is perfectly well-defined to ask: On average, how many ions move beyond pure vibration within a time window of length ? If the average concentration of ions moving over time is denoted by and is the total ion concentration, ergodicity is expressed by the relation
| (2) |
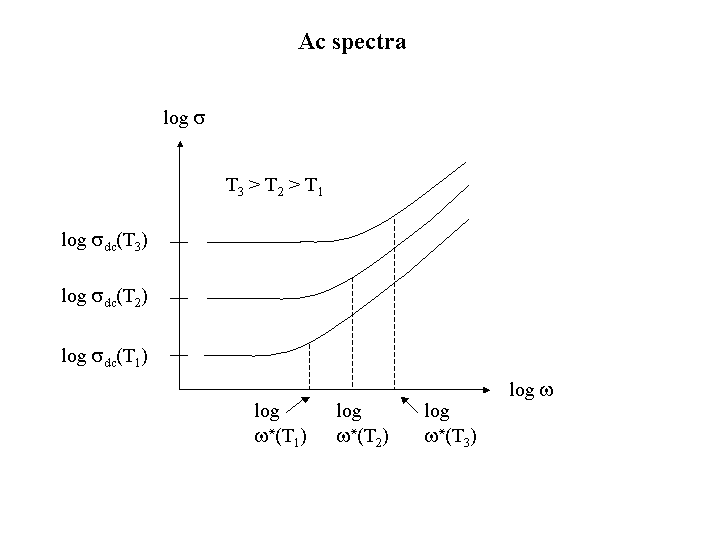
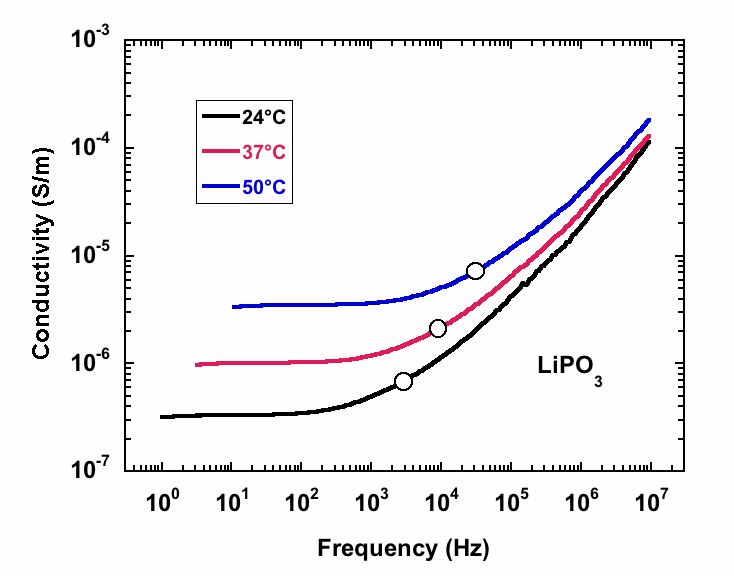
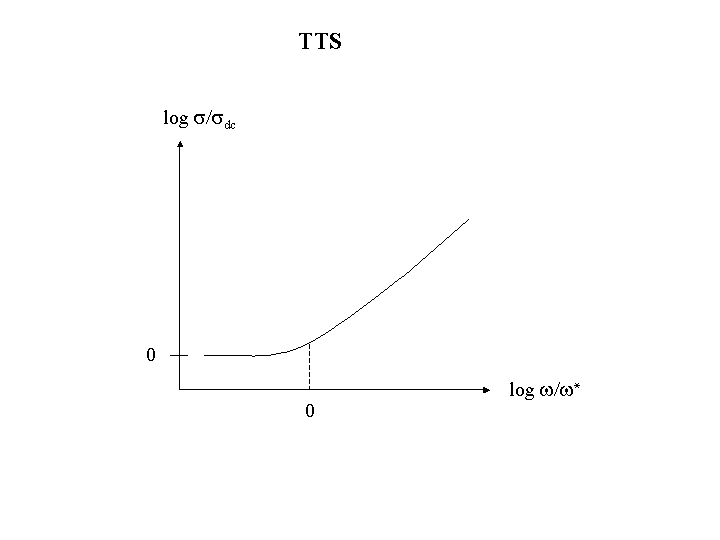
An obvious question is how to determine experimentally. A popular method of determining the “mobile ion density” – without explicit reference to time scale – is by application of the Almond-West (AW) formalismalm83a ; alm83b ; hai94 that takes advantage of the frequency dependence of the conductivity. We proceed to discuss this approach. First note that in ion conductors with structural disorder, the short-time ion dynamics is characterized by back-and-forth motion over limited ranges, “subdiffusive” dynamics, whereas the long-time dynamics is characterized by random walks resulting in long-range ion transport, “diffusive” dynamics (Fig. 1).dyr88 ; maa91 ; fun93 ; maa95 ; dyr00 The back-and-forth motion leads to dispersive conductivity at high frequencies, while the long-range transport leads to the low-frequency plateau marking the dc conductivity (Fig. 2). There is experimental evidence that in materials with high ion concentration, at any given time only part of the ions are actively involved in back-and-forth motion.rol01 ; mur04 .
A widely applied description of conductivity spectra in the low-frequency regime (i.e., below 100 MHz) is a Jonscher type power law,
| (3) |
where we have written the equation in a form such that the crossover frequency marking the onset of ac conduction, , is given by . Equation (3) is sometimes referred to as the Almond and West (AW) formula, although Almond and West did not consider Jonscher’s “universal dielectric response” of disordered systems, but introduced their formula to describe defective crystals with an activated number of charge carriers. Nevertheless, when applying Eq. (3) to strongly disordered systems, as, e.g. ionic glasses, many authors in the literature follow the physical interpretation suggested by Almond and West and identify the crossover frequency with a “hopping rate”. Thus combining this ansatz with the Nernst-Einstein relation gives
| (4) |
as an equation to determine the number density of “mobile ions”, (after typically assuming jump lengths Å).
However, if one accepts that Eq. (3) provides a good fit to spectra in the low-frequency regime – it generally fails at frequencies above 100 MHz – the estimate of an effective number density of “mobile ions” based on Eq. (4) is questionable. Application of the fluctuation-dissipation theorem implies the following expression, where and and are numbers that are roughly of order unity ( is an in principle time-scale-dependent Haven ratio hav65 ; ter75 ; isa99 reflecting ion-ion correlations and is a numerical factor reflecting the conductivity spectrum at onset of ac conduction, see Appendix A):
| (6) |
If the mean-square displacement obeys one has , but unfortunately the quantity does not generally have this approximate value. In a simple models where all ions have similar jump rate, is indeed roughly times the fraction of ions that have jumped within time . It is not possible to model the universally observed strong frequency dispersion of the conductivity without assuming a wide spread of jump rates, however, and in such models like the random barrier model (RBM) considered below is much larger than . Generally, gives an approximate upper limit for the fraction of ions that have moved in the time window . Ignoring the less significant factor , this implies that . To summarize, only in models where all ions have similar jump rates does give an estimate of how many ions on average jump over the time interval of length .
An alternative suggestion for obtaining information about the “number of mobile ions” is based on analyzing the electrode polarization regime of conductivity spectra for ion conductors placed between blocking electrodes.sch94 ; tom98 ; kle06 ; mar08 However, theoretical analyses of the spectra are often based on Debye-Hückel-type approaches,sch94 ; tom98 ; kle06 ; mar08 the applicability of which is far from obvious at high ion density. Thus while it is a potentially useful idea, more theoretical work is needed before observations of electrode effects may lead to safe conclusions regarding the number of mobile ions (see the next section that outlines the a simple approximate description); one still needs to specify the time scale that the number of mobile ions refers to. – Solid-state NMR methods such as motional narrowing experimentsriv04 ; ber05 ; mus06 and the analysis of multi-time correlation functions of the Larmor frequency,boh03 ; boh07 provide information about the number of ions moving on the time scale that these methods monitor (milliseconds to seconds).
The question “what is the density of mobile ions?” is thus well defined only when it refers to a particular time scale. This is because according to standard ergodicity arguments, if the time scale is taken to infinity, all ions contribute equally and the density of mobile ions is the total ion density . A natural choice of time scale is that characterizing the onset of ac conduction, the of the above equations. Choosing this time scale leads to a classification of ion conductors into two classes: Those for which is comparable to the total ion density : (“strong electrolyte case” tul80 ), and those for which (“weak electrolyte case” rav77 ; ing80 ). The latter class includes solids where ion conduction proceeds by the vacancy mechanism (Sec. VII).
III What can be learnt from electrode polarization?
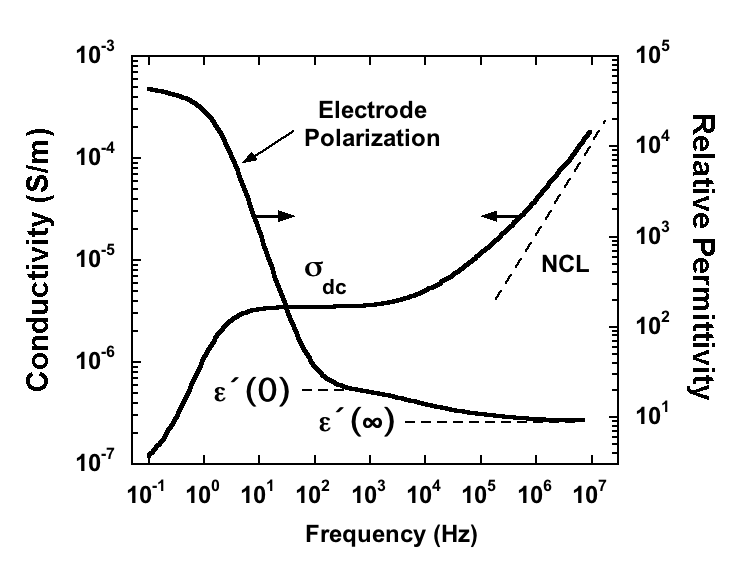
As is well known, the ac conductivity is a complex function. Thus associated with the real part there is also an imaginary component; the latter determines the real part of the frequency-dependent permittivity. For the study of ion conduction in disordered solids the use of blocking or partially blocking metal electrodes is convenient. In this case, the high-frequency parts of ac conductivity and permittivity spectra are governed by ion movements in the bulk of the solid electrolyte, while the low-frequency part is governed by so-called “electrode polarization” effects, as shown in Fig. 3. Since the ions are blocked by the metal electrode, there is accumulation or depletion of ions near the electrodes, leading to the formation of space-charge layers. The voltage drops rapidly in these layers, which implies a huge electrical polarization of the material and a near-absence of electric field in the bulk sample at low frequencies. The build-up of electrical polarization and the drop of the electric field in the bulk are reflected in an increase of the ac permittivity and a decrease of the ac conductivity with decreasing frequency.isa76 For completely blocking electrodes , of course. – Whenever both ions and electrons conduct, a number of electrochemical techniques exist for evaluating transference numbers of ions and electrons, including galvanic cells, polarization, and permeation techniques.kna04 ; hey77 ; rie91 ; rie97
Systematic experimental and theoretical studies of electrode polarization effects in electrolytes began in the 1950s in works was carried out by Macdonald mac53 , Friauf fri54 , Ilschner ils58 , Beaumont bea67 , and others. Their approaches were based on differential equations for the motion (diffusion and drift) of charge carriers under the influence of chemical and electrical potential gradients. These equations were combined with the Poisson equation and linearized with respect to the electric field. Thereby, expressions for the ac conductivity and permittivity at low electric field strengths were derived. These are mean-field approaches in the sense that a mobile charge carrier interacts with the average field produced by the electrode and the other mobile carriers baz04 .
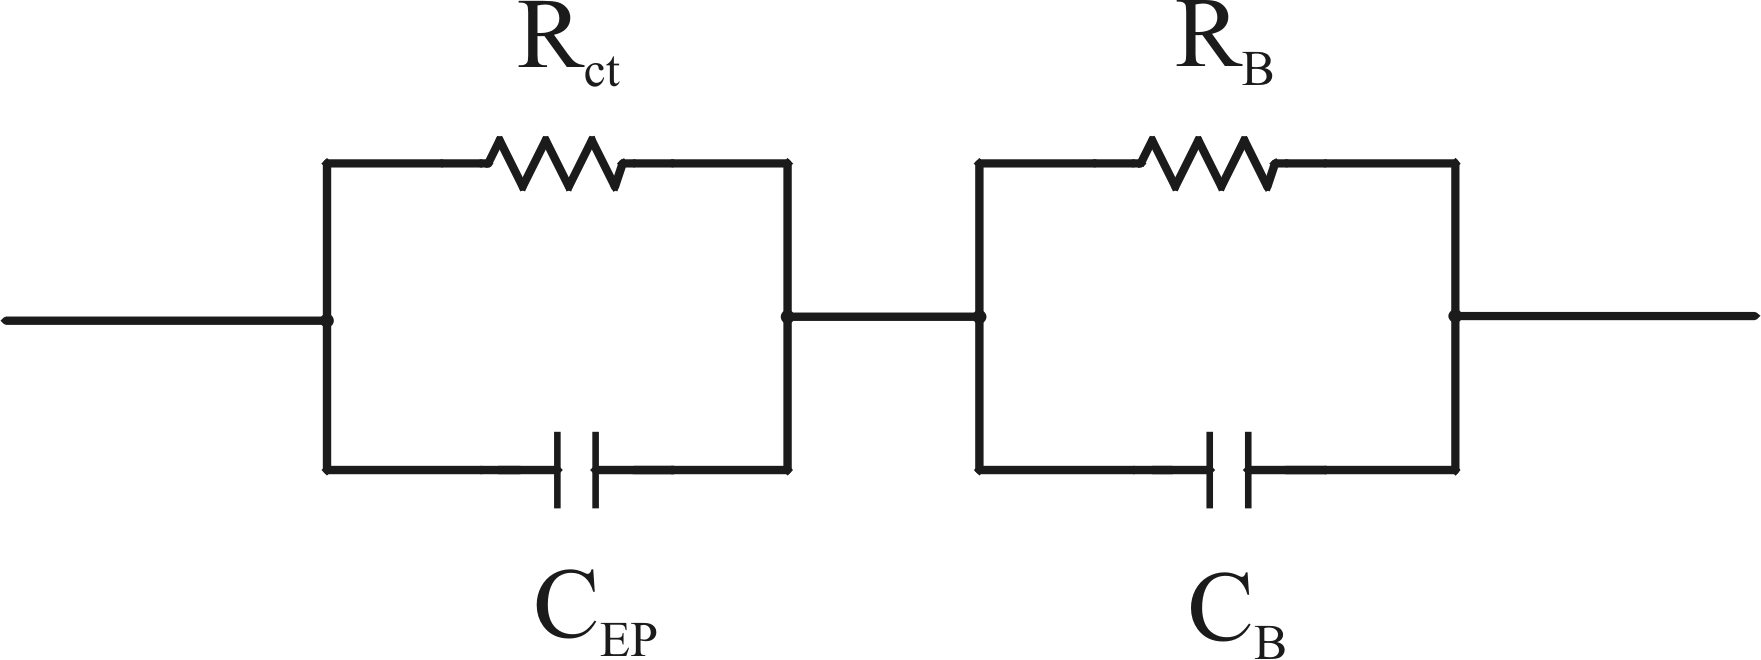
When charge carrier formation and recombination can be neglected and the sample thickness is much larger than the space-charge layer thickness, the theoretical expressions can be approximately mapped onto the simple electrical equivalent circuit shown in Fig. 4 if the frequency dependence of the bulk conductivity is ignored. Ion transport in the bulk is described by the element. The space charge layers are described by a capacitance , and, in case of a discharge of the mobile ions at the electrode, a (generally large) parallel charge transfer resistance . The element acts in series with the element. In the cases and that usually apply, the equivalent circuit leads to the following expressions for the frequency-dependent conductance (real part of the admittance) and capacitance (imaginary part of the admittance):
| (7) |
and
| (8) |
with and denoting the sample area, where the Debye length is defined by
| (9) |
From these expressions a number density of mobile ions can be calculated that is the density of mobile ions referring to the time scale for build up of electrode polarization, where .
In the absence of ion discharge, i.e., when , the equivalent circuit reduces to an RC element in series with a capacitor. The existence of a finite charge transfer resistance leads to the occurrence of a conductance plateau at low frequencies with plateau value given by
| (10) |
In addition, the static capacitance becomes slightly smaller than :
| (11) |
This mean-field approach should apply to materials with low , such as ionic defect crystals and diluted electrolyte solutions. Its applicability to disordered solids with high ion density is far from obvious. Nevertheless, quite a number of ac spectra of ion conducting glasses and polymers were traditionally analyzed and interpreted utilizing the above equations. Thereby, number densities of mobile ions were calculated and compared to the total ion content of the samples. For instance, Schütt and Gerdes concluded that in alkali silicate and borosilicate glasses only between 1 ppm and 100 ppm of the alkali ions are mobile sch92 . Similar results were obtained by Tomozawa on silica glass with impurity ions tom98 and by Pitarch et al. from voltage-dependent measurements of on a sodium aluminosilicate glass pit03 . Klein et al. carried out measurements on ionomers containing alkali ions and found ratios of mobile alkali ions to the total alkali ion content ranging from about 10 ppm to 500 ppm kle06 .
For a critical discussion of such experimental results and their interpretation, it is important to consider limitations of both experiment and theory. Regarding the experimental situation there are in particular two important points: (i) The roughness of the electrode/solid electrolyte interface is usually not taken into account. Especially in a frequency range where the length scale of the potential drop at the electrodes is comparable to the roughness of the interface, the roughness must have a considerable influence on the ac conductivity and permittivity. (ii) The surface-near regions of ion conductors often exhibit a chemical composition that is significantly different from the bulk. For instance, in ionic glasses, surface corrosion is initiated by an alkali-proton exchange. Such deviations from the bulk composition should have a strong influence on the ac spectra when the potential drop occurs very close to the surface, i.e., at high capacitance values close to the static capacitance plateau and in the static capacitance plateau regime.
From a theoretical point of view, serious limitations of the applicability of mean-field approaches to disordered solids derive from: (i) The interactions between the ions are not taken into account; (ii) surface space charges in disordered solids may exist even without the application of an external electric field, due to ion exchange processes at the surface or due to an interaction of mobile ions with the metal electrode. Thus more sophisticated theories should take into account the possibility of an open-circuit potential difference between electrodes and solid electrolyte.
In summary, considerable efforts in both experiment and theory is required in order to carry out measurements on well-defined electrode/electrolyte interfaces and to obtain a better theoretical understanding of what kind of information may be derived from electrode polarization effects. It is clearly worthwhile to pursue this direction of research, and it would also be worthwhile to look into what can be learned from electrode effects in the strong-field case where the electrode polarization becomes nonlinear.
IV What causes the mixed-alkali effect?
A prominent phenomenon occurring in ion-conducting glasses is the mixed-alkali effect (for reviews, see hug68 ; isa68 ; day76 ; ing94 ). This effect is the increase of the mobility activation energy of one type of ion when it is gradually replaced by a second type of mobile ion. This leads to changes of the tracer diffusion coefficients over several orders of magnitude at low temperatures, and to a minimum in the dc-conductivity , when the mixing ratio of two mobile ions and is varied (for recent systematic experimental studies, see e.g. Refs. vos04a, ; vos04b, ).
Much progress has been made over the last two decades for explaining the mixed-alkali effect maa92 ; bun94 ; hun94 ; gre95 ; hab95 ; hun95 ; hab96 ; swe98 ; tom98b ; bar99 ; maa99 ; sch99 ; kir00 ; swe01 ; swe03 ; bun04 ; hab04b ; imr06 ; hab07b ; zie08 . Compelling evidence now exists that its origin is of structural character, associated with a mismatch effect maa92 where sites in the glassy network favorable for one type of mobile ion are unfavorable for the other type of mobile ion. This evidence comes from EXAFS gre95 ; gre91 ; hou93 , NMR gee97 and infrared spectroscopy kam93 ; kam96 ; kam98 , x-ray and neutron scattering experiments in combination with reverse Monte-Carlo modeling swe01 and bond valence sum analyses swe03 , molecular orbital calculations uch92 ; uch99 , molecular dynamics simulations hab95 ; bal93 ; lam03 ; lam05 and theoretical work based on microscopic and semi-microscopic approaches maa92 ; hun94 ; maa99 ; bar99 ; kir00 . In hopping systems, the mismatch effect can be modeled by site energies that are different for different types of mobile ions, i.e., a low-energy site for one type is a high-energy site for the other type.
Recently it was possible also to explain the peculiar behavior of the internal friction in mixed-alkali glasses pei05 ; maa06a . When a mixed-alkali glass fibre is twisted at a certain frequency, two mechanical loss peaks can be identified well below the glass-transition temperature: the single-alkali peak that with beginning replacement becomes smaller and moves to higher temperatures, and the mixed-alkali peak that at the same time becomes higher and moves to lower temperatures (for a review of experimental results, see zda79 ). Based on general theoretical considerations it was shown that the mixed-alkali peak can be traced back to mutual exchanges of two types of mobile ions and the single-alkali peak to exchanges of the (majority) ion with vacancies. As a consequence, large mixed-alkali peaks are predicted for ion types with small mismatch where ion-ion exchange processes are more likely to occur. This agrees with experimental observations. Moreover, it could be shown that the occurrence of large mixed-alkali peaks at small mixing ratios can be understood if the fraction of empty sites is small. This gives independent evidence for the small fraction of empty sites found in theoretical arguments dyr03 as well as in molecular dynamics simulations lam03 ; lam05 ; hab04 ; vog04b (section VII).
Despite this progress over the past years, there are still many issues awaiting experimental clarification and theoretical explanation. A point less addressed so far in the microscopic modelling is the behavior of the viscosity as reflected in a minimum of the glass-transition temperature upon mixing. This softening of the glass structure at intermediate mixing ratios may significantly influence ion transport properties. The mixed-alkali effect becomes weaker with total mobile ion content day76 in agreement with theoretical expectations.maa92 However, a systematic theoretical study of this feature has not yet been undertaken. Overall, there is still no consistent theoretical account of all main signatures of the mixed-alkali effect.
We finally note that a mixed-alkali effect also occurs in crystals with structure of - and -alumina type, where the ion motion is confined to two-dimensional conduction planes.cha78 ; fos81 ; bru83 A quantitative theory has been developed for this based on the wealth of structural information available.mey96 ; mey98 The key point is that and ions have different preference to become part of mobile defects, and this preference is caused by a different interaction of the ions with the local environment. In this respect the origin of the mixed-alkali effect in crystals has similarities to that in glasses. However, different from the host network in glasses, the host lattice in the crystalline systems is almost unaffected by the mixing of the two types of mobile ions.
V What is the origin of time-temperature superposition?
Different suggestions were made in the past to characterize the similar ac responses observed for different types of ion conductors in frequency regimes not exceeding 100 MHz. The simplest description is the power-law frequency dependence proposed by Jonscher (Eq. (3)).jon77 ; jon83 The power-law description is not accurate, however, because the exponent must generally increase somewhat with frequency in order to fit experiment properly, and also because the asymptotic low-frequency behavior is inconsistent with experiment that imply for ().dyr00 ; fun07 A more general approach is to consider the scaling associated with time-temperature superposition (TTS) for any particular ion conductor bow06 ; mur07 ; pap07 . The scaling ansatz reads
| (12) |
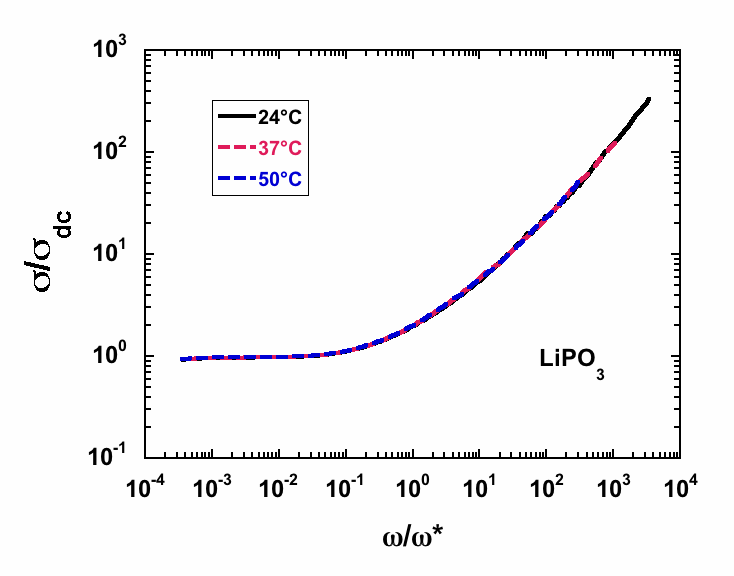
Here is the so-called scaling function and the previously defined angular frequency marking onset of ac conduction. Any solid that obeys TTS is, equivalently, referred to as obeying scaling. As an example Fig. 5(b) illustrates how the spectra of Fig. 2(b) scale to a common so-called master curve.
Barton,bar66 Nakijama,nak72 and Namikawanam75 long ago verified that for many ion- (and some electron-) conducting disordered solids
| (13) |
where is a constant of order of unity and is the dielectric strength, i.e., the difference between static and high-frequency dimensionless dielectric constants. Equation (13) is known as the BNN relation.dyr86 By considering the low-frequency expansion of the conductivity a connection can be made between the scaling behavior Eq. (12) and the BNN relation.sch00 The argument assumes analyticity of the scaling function for small , which is in fact necessary in order to have a well-defined dielectric strength.die02 One has for with the constant being real. Accordingly, one obtains for which implies . Thus TTS and analyticity imply the BNN relation – but do not mathematically garantee that .
To the best of our knowledge, TTS applies for all single-ion conducting glasses and crystals with structural disorder. This remarkable fact suggests that disorder is intimately linked to TTS. In crystals with structural disorder, such as RbAg4I5 and -alumina, different types of ion sites exist with different energies.bet69 ; fun84 ; fun06 In addition, the interionic Coulomb interactions cause a significant spread in the potential energies of the ions. In glasses, the disorder of the glass matrix leads to a broad distribution of ion site energies and barrier heights and thus to a broad distribution of jump rates.sva99 ; vog04a This may explain why, even in single-modified glasses (i.e., with only one type of ion) with low number ion density and corresponding weak interionic Coulomb interactions, violations of TTS have not been observed.rol97 ; sid99a
In contrast, crystals with low concentrations of point defects routinely show TTS violations. Examples are materials with intrinsic Frenkel or Schottky defects, such as alkali and silver halides.fun96a In these materials, the interactions between the small number of defects are weak and the defects are partly bound to counter charges. Therefore, on short time scales the defects carry out localized movements close to the counter charges. These localized movements are not correlated to the long-range ion transport, and consequently the conductivity spectra do not obey TTS.
Violations of TTS are also found in materials with more than one type of mobile ion. Examples are mixed-alkali glassescra02 , as for instance 2 Ca(NO3)2 3 KNO3 (CKN) melts.pim95 ; sin05 Below the glass transition temperature (K) CKN is believed to be a pure K+ ion conductor and it obeys TTS, but at higher temperatures Ca2+ ions most likely also contribute significantly to the conductivity (above K CKN again obeys TTS sin05 ). Other examples are some polymer electrolytes above their glass-transition temperature where the polymer chains carry out segmental movements. Here different types of movements with different characteristic length scales contribute to the conductivity spectra, which generally results in TTS deviations.sid96
The simplest model exhibiting the scaling properties Eqs. (12) and (13) is perhaps the random barrier model (RBM), see, e.g., Ref. dyr00, for a review. In this model hopping of a single particle on a lattice with identical site energies is considered, where the energy barriers for jumps between neighboring sites are randomly drawn from a smooth probability distribution. The particles must overcome a critical “percolation” energy barrier to exhibit long-range motion (a review of percolation theory with particular emphasis on ion diffusion was given by Bunde and Havlin bun96 ). The time to overcome the percolation barrier, , determines the characteristic frequency marking onset of ac conduction: .dyr00 The percolation energy barrier – acting as a bottleneck – also determines the dc conductivity temperature dependence. Thus percolation explains why a wide distribution of barriers nevertheless results in an Arrhenius dc conductivity (which is observed for most disordered ion-conducting solids). Incidentally, the BNN relation’s rough proportionality, , also follows from percolation determining the conduction properties.
The scaling function of the RBM is universal in the “extreme disorder limit” where the jump rates vary over several decades; this limit is approached as temperature is lowered. Universality means that the ac response in scaled units becomes independent of both temperature and activation energy probability distribution. This was shown by extensive computer simulations involving barriers distributed according to a Gaussian, an exponential, an inverse power law, a Cauchy distribution, etc.dyr00 ; sch02 It was recently shownsch08 that if and is a suitably scaled frequency, except at low frequencies where the conductivity approaches the dc level, the universal RBM ac conductivity is to a good approximation given by the equation
| (14) |
This expression implies an approximate power-law frequency dependence of the ac conductivity with an exponent that slowly converges to unity at very high frequencies – not simply an exponent of as one might naively guess. A very accurate representation of the RBM universal ac conductivity is given in Appendix B.
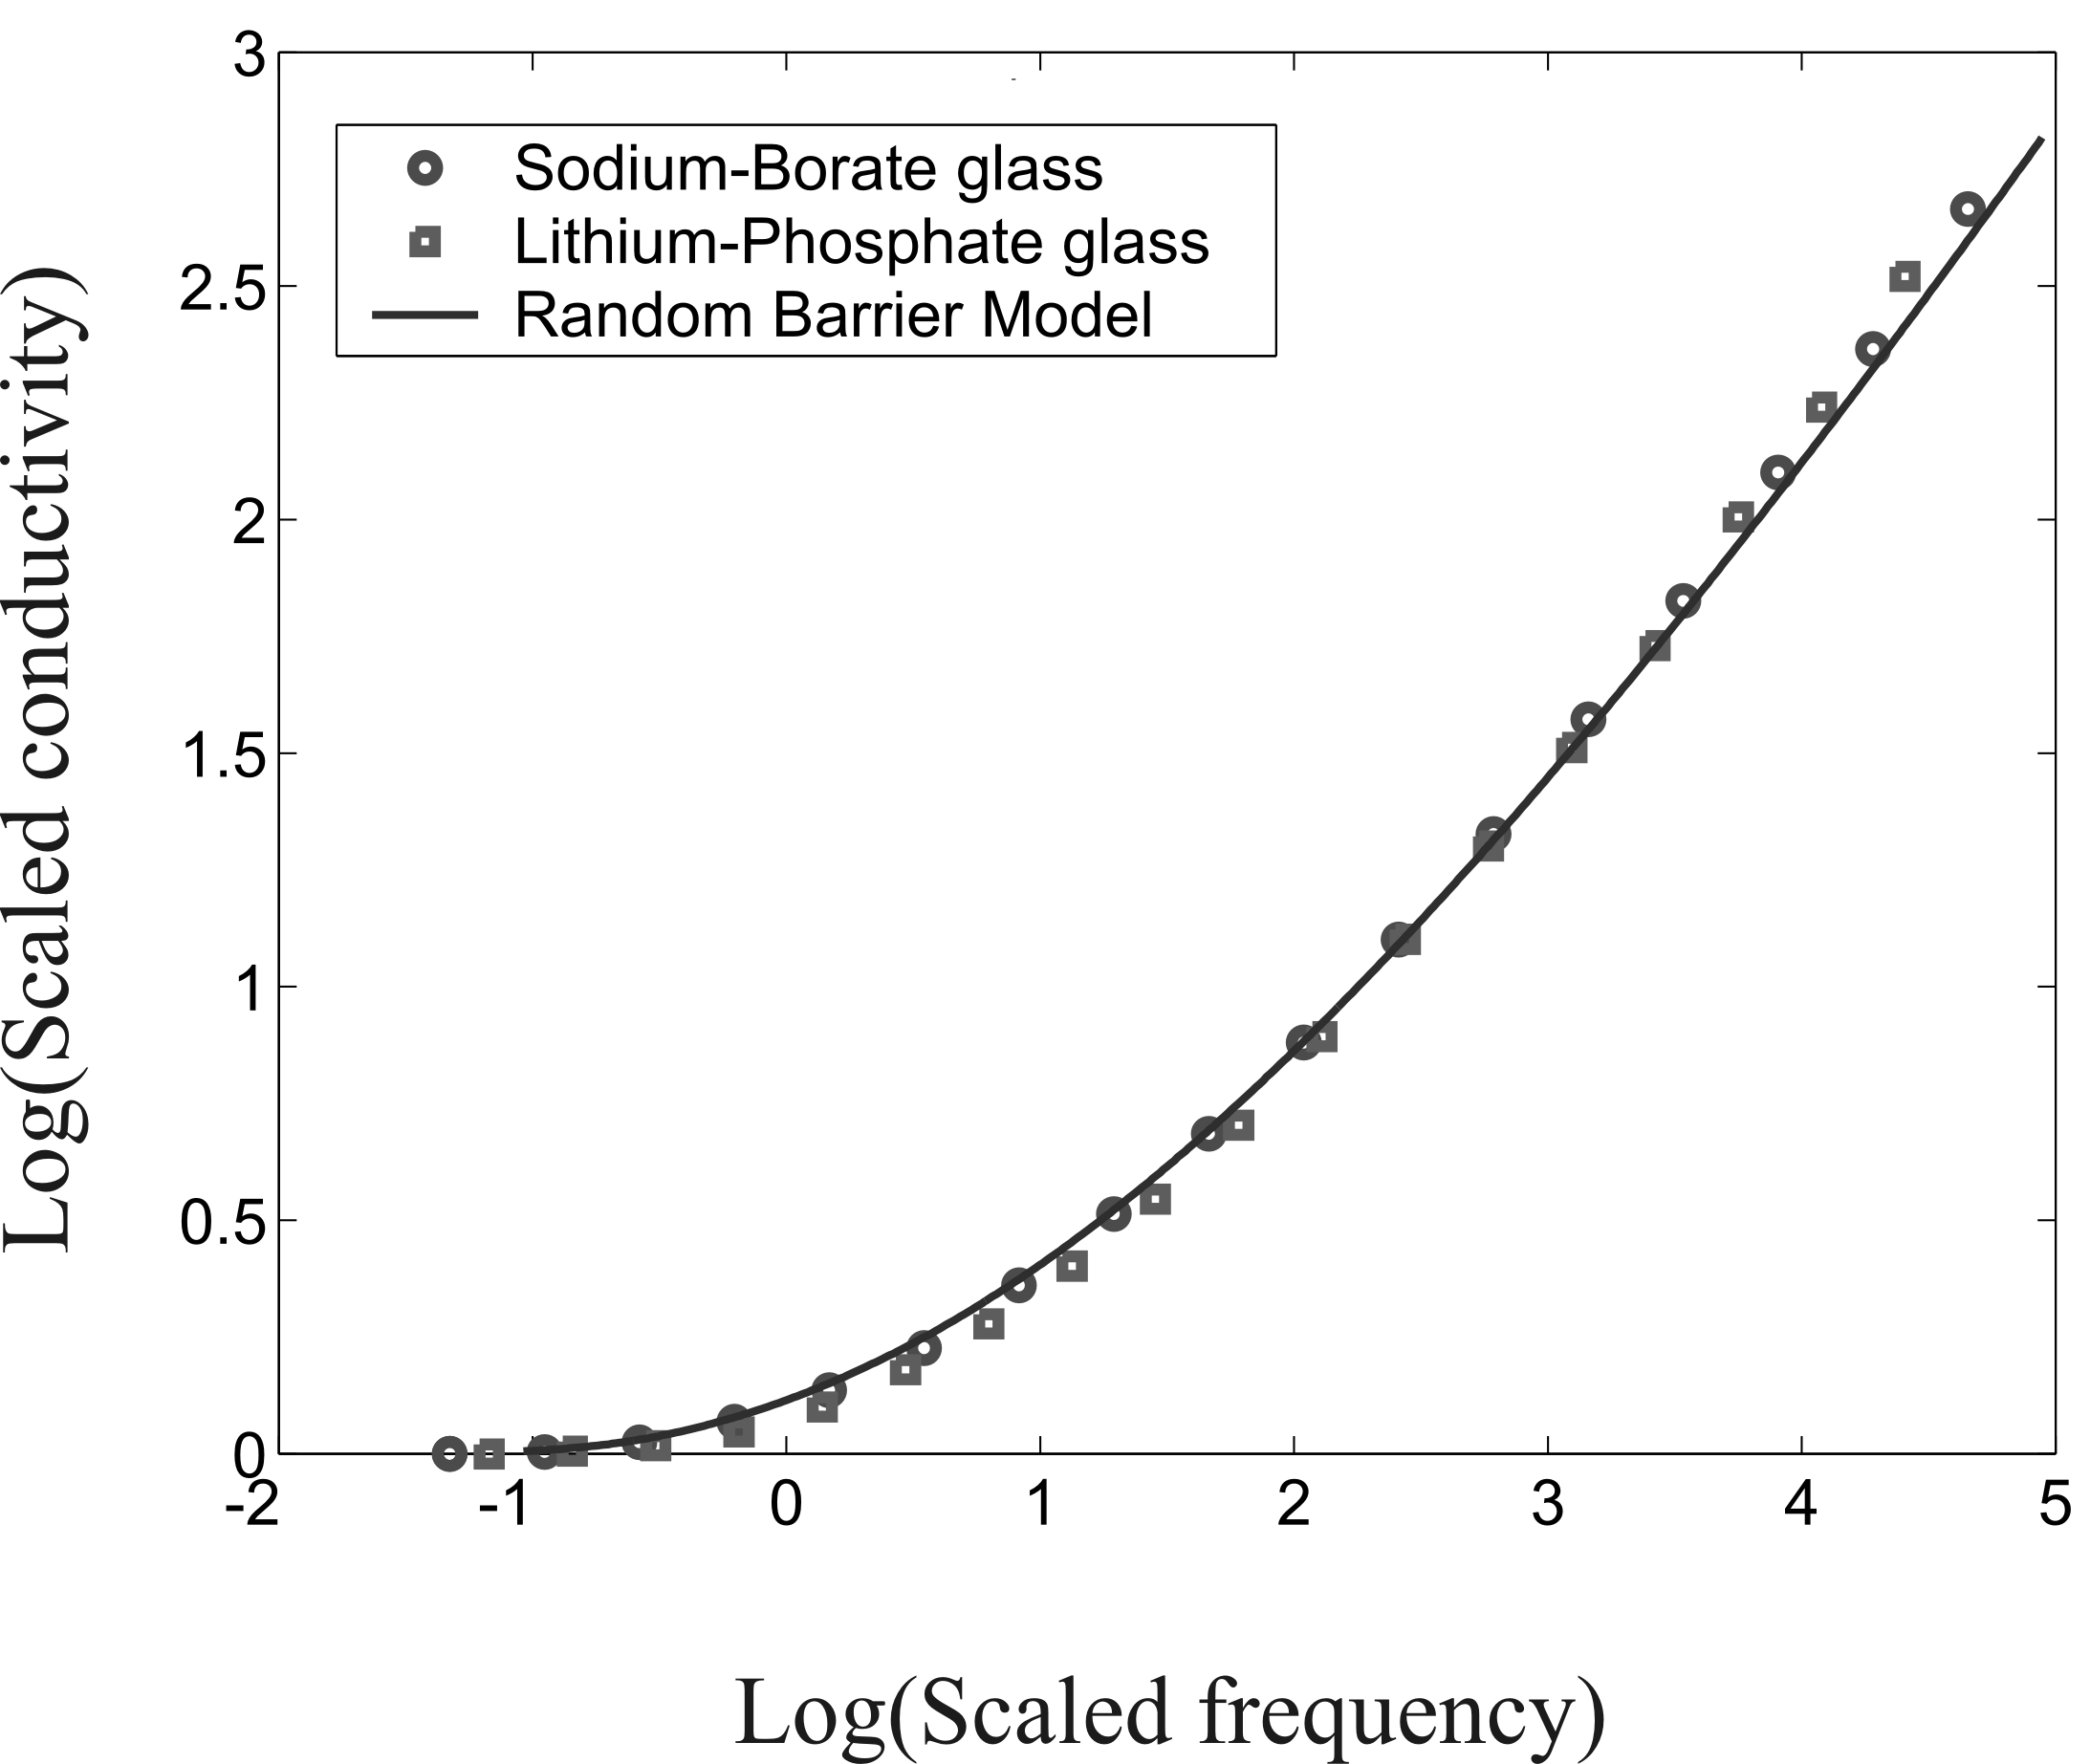
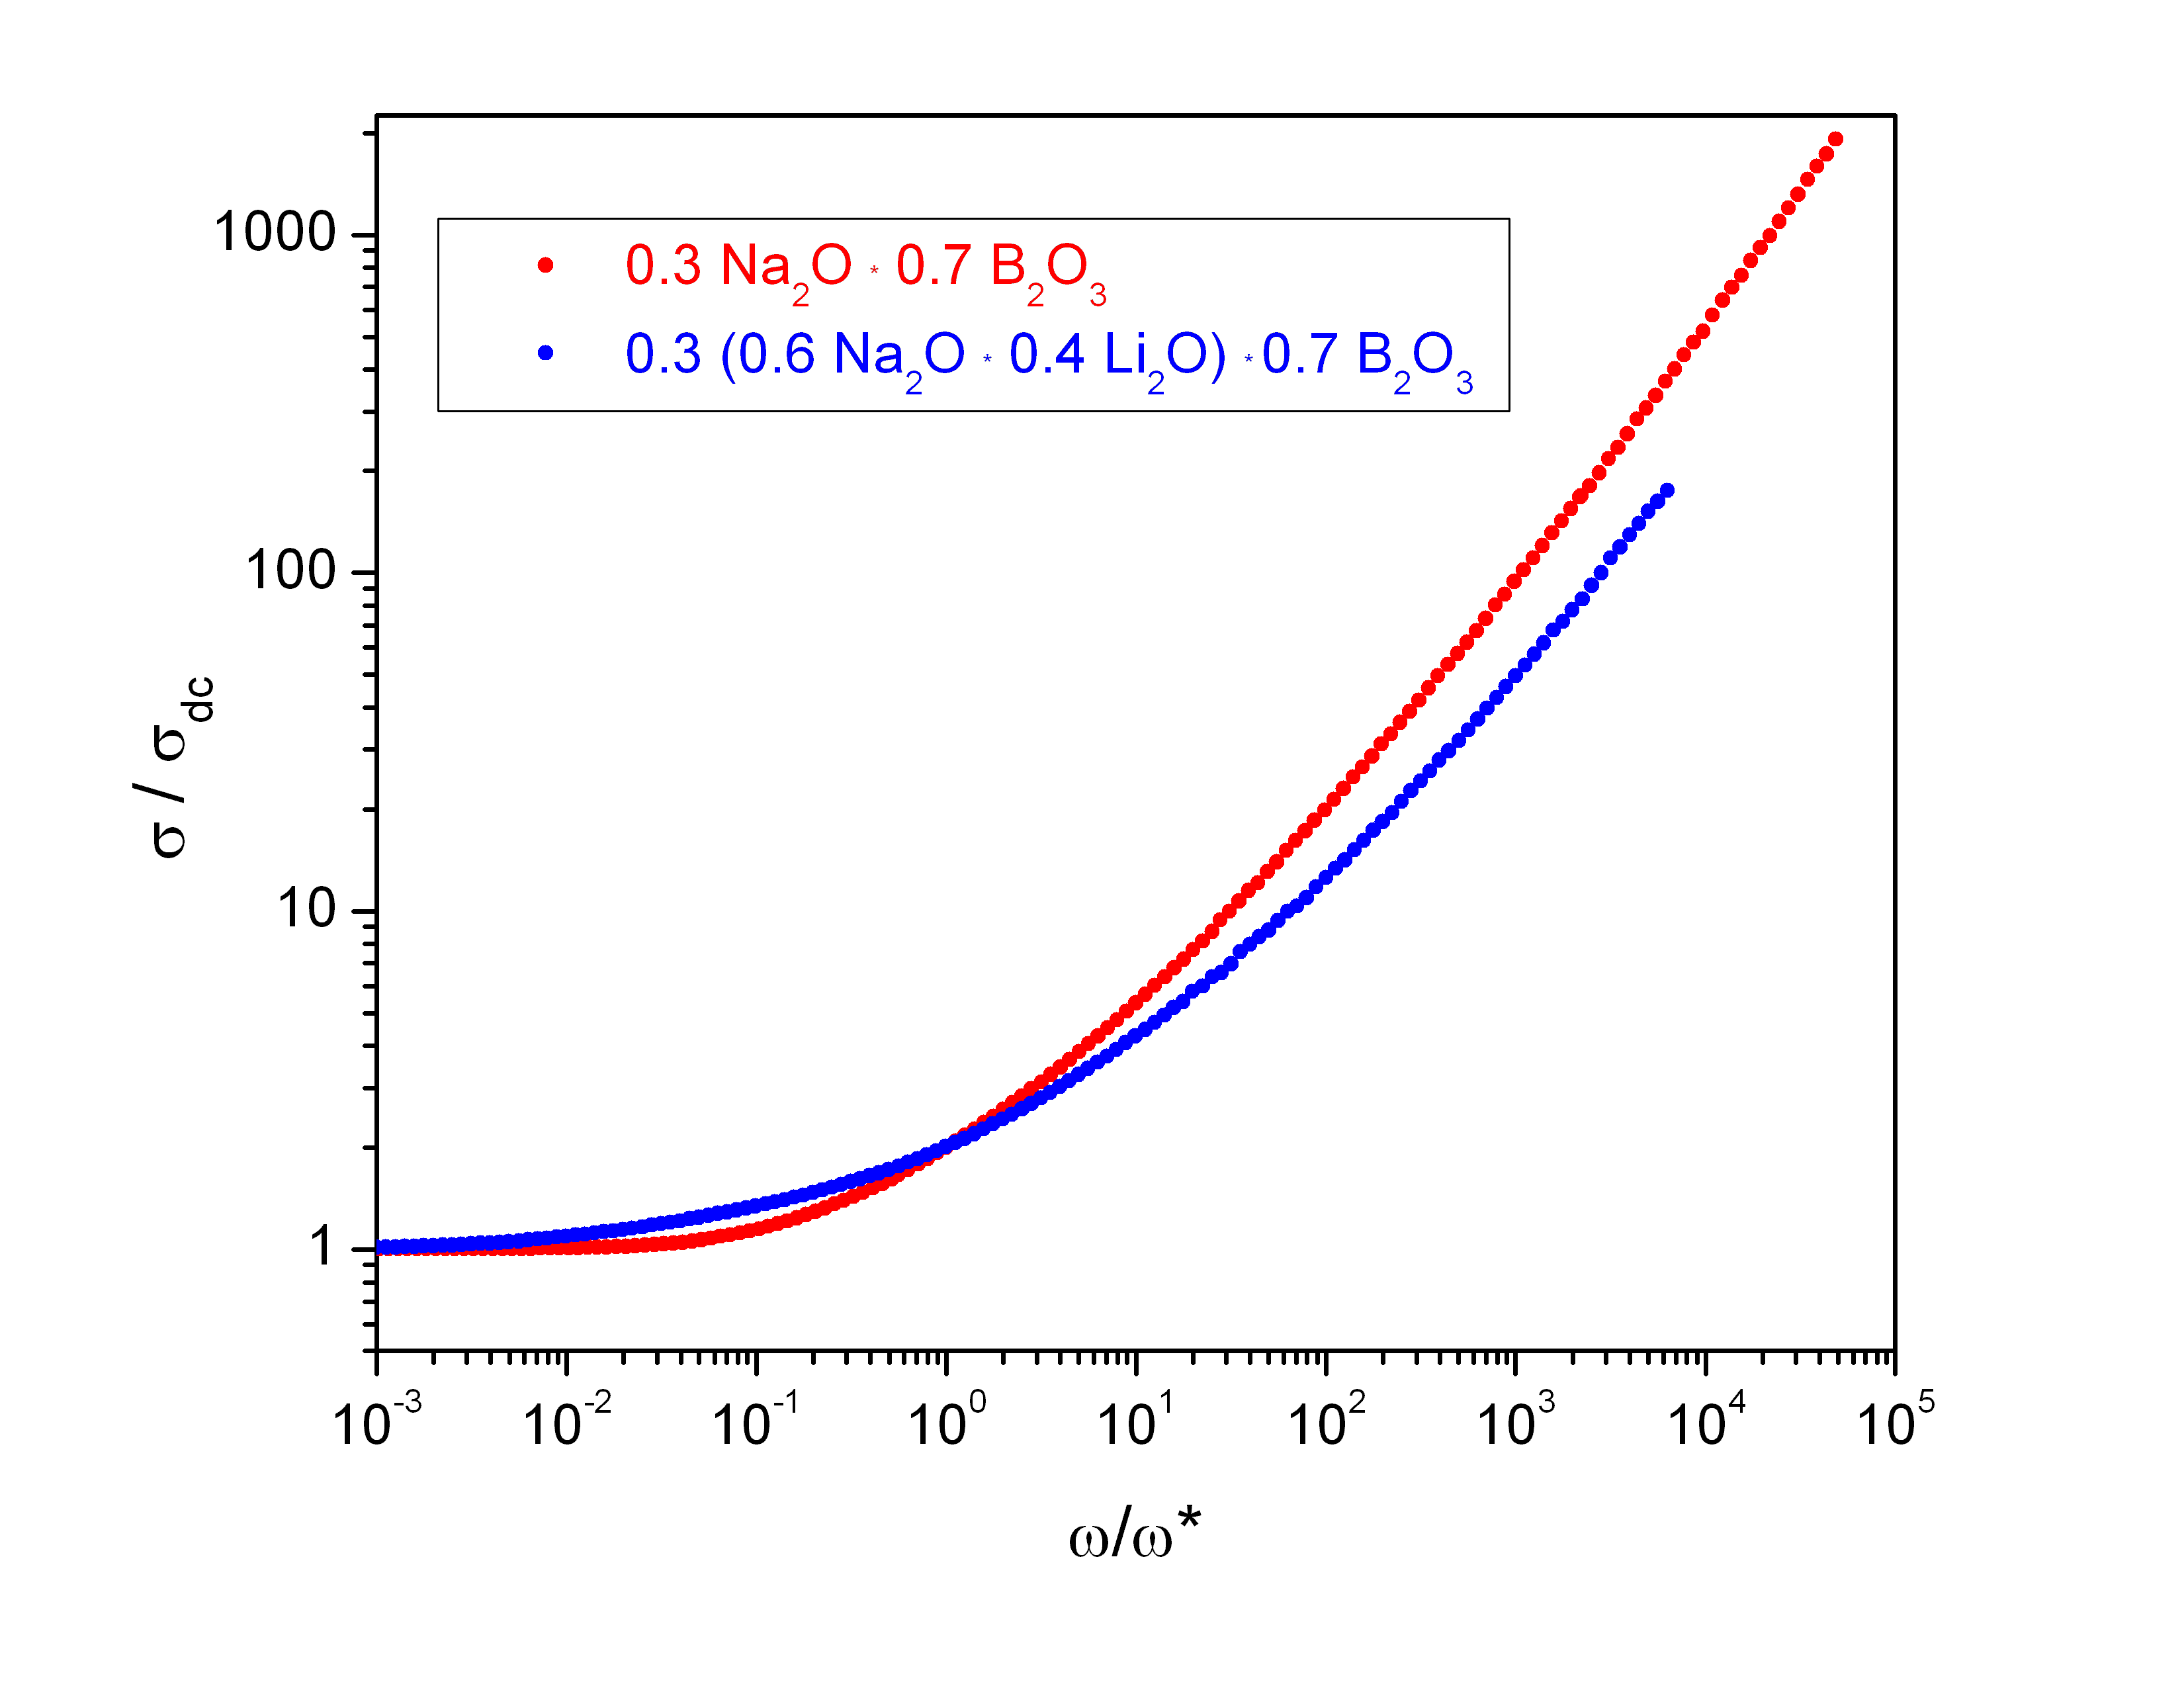
The RBM scaling function is usually close to, but rarely identical to those of experiments.dyr00 ; bar99 ; rol01a As an example Fig. 6(a) shows the RBM universal ac conductivity (full curve) with the Lithium-Phosphate data of Fig. 2(b) at the lowest temperature (C) and the Sodium-Borate data of Fig. 6(b), where both data sets were empirically scaled on the frequency axis. Figure 6(b) shows data also for a mixed-alkali glass; these data deviate significantly from the approximate ac universality represented by the red curve. It appears that, on the one hand, the RBM captures the essential features of the ion dynamics for single-ion conducting disordered solids, and that, on the other hand, deviations from the RBM universal ac conductivity may provide important information about specific features of the solid in question mur04 . Thus the RBM may be regarded as the “ideal gas” model for ac conduction in disordered solids.
In the RBM the dispersive transport properties are governed by strong disorder, forcing the ions to explore percolation paths for long-range motion.hun93 ; ish07 Macroscopic alternatives to the RBM (but with similar basic physics dyr00 ), which apply if the sample has microstructure, have also been studied.dyr93 ; alm04 In most cases except that of nanocrystalline materials, however, the disorder is believed to be on the atomic scale.
Single-particle models like the RBM or its generalizations are simple and attractive for understanding the origin of TTS, but there are a number of challenges to this approach as well as open questions that one must keep in mind:
-
(i)
For glasses the stoichiometry can be varied to a large extent. Related to changes in composition there are changes in activation energies, as for example a lowering of the activation energy with increasing mobile ion content or an increase of activation energy when one type of mobile ion is successively replaced by another type (the mixed-alkali effect, Sec. IV). These effects are not dealt with in the RBM unless the model is modified in an ad hoc manner to allow for significant changes in the barrier distribution and mismatch effects with respect to different ion types. The simplest models accounting for these effects are hopping systems with site exclusion,bar99 ; maa99 i.e., where there can be at most one ion at each site. Interestingly, such “Fermionic” hopping systems with site energy disorder often obey TTS.por00 ; pas06 Moreover, calculations for the corresponding single-particle systems yield scaling functionssch07 that are close to the RBM universal scaling function. A conclusive picture of the scaling properties of these type of models remains to be established, however.
-
(ii)
Recent molecular dynamics simulationslam03 ; hab04 ; vog04b ; lam05 ; mue07 and theories for the internal friction behavior in mixed-alkali glassespei05 show that often only few of the potential ion sites are vacant (typically ). This is expected on general grounds, since during the cooling process a glass tends to a state of low free energy, thus with few defects.dyr03 It would be interesting to investigate whether hopping models with a low concentration of vacant sites generally obey TTS.
-
(iii)
The Coulomb interactions between ions can be estimated from their mean distance , where is the number density of ions. At room temperature, typical plasma parameters are in the range 30-80. In view of the confined geometry of the diffusion (percolation) pathsmey04 the local interactions may be even stronger. Hence it is important to clarify whether hopping models with Coulomb interaction obey TTS and, if so, how the scaling function is affected by the interactions (for a general overview of Coulomb interactions effects on dispersive transport properties, see e.g. Ref. die02, ). Early studies of Coulomb interaction effects in hopping models with percolative disordermaa91 showed that Coulomb interactions give rise to a strong conductivity dispersion, but TTS was not observed. This might be due to the fact that in these early simulations temperature was not low enough. Another reason could be that, as in the RBM, a smooth and broad distribution of barrier or site energies is required for scaling. Indeed, simulation studies of many-particle hopping in the RBM with Coulomb interactions show agreement with the scaling behavior for low and moderate particle concentrations in the limit of low temperatures.rol01a Overall, however, the problem is far from being settled; in particular if one takes into account that the fraction of empty sites should be small and that critical tests for other types of structural disorder such as site energy disorder, have not yet been performed. Due to the long-range nature of the Coulomb force, one could argue that its contribution to the energy landscape (sites and saddle points) provides an overall mean-field contribution. This hypothesis should be tested by further simulations.
-
(iv)
Most studies of the RBM and other hopping models focused on site and/or barrier energies varying randomly without spatial correlation (a notable exception is the counterion modelkno96 ; pen98 ). If there are significant spatial correlations – thus introducing a further length scale into the problem – this may well lead to a breakdown of TTS.
VI What causes the nearly constant loss?
At high frequencies and/or low temperatures conductivity spectra approach a regime with nearly linear frequency dependence when plotted in the usual double-log plot: (). The proportionality constant is only weakly temperature dependent. This is referred to as the “nearly constant loss” (NCL) regime since it corresponds to an almost frequency-independent dielectric loss (Fig. 3). This behavior is ubiquitously observed in a wide variety of solids including glassy, crystalline, and molten ion conductors, independent of specific chemical and physical structures – for an overview on experimental results, see e.g. Refs. bur89, ; nga99, .
There are different possible origins of the NCL. One possibility is that NCL reflects the still not fully understood low-energy excitations present in all disordered materials. In the quantum-mechanical tunnelling model these excitations account for the anomalous low-temperature features of heat capacity and sound-wave absorption.phi87 At higher temperatures the low-energy excitations give rise to relaxations of the system over an energy barrier separating two different energy minima, described by the asymmetric double-well potential (ADWP) model.bal88 On a microscopic level this could correspond to cooperative “jellyfish-type” movements of groups of atomic species in the material.sid96 ; now94 ; lu94 If correct, this type of dynamic process should be a feature of all disordered materials, including materials without ions.
A more recent interpretation suggests that localized hopping movements of ions within fairly small clusters of sites contribute to the NCL in disordered ion conductors.rol01b ; sid02 In this interpretation the NCL is merely the extension to higher frequencies of the dispersive conductivity. In fact, any hopping model with sufficient disorder gives rise to such a regime, since on short time scales hopping models always correspond to ADWP-type models. In the RBM, for instance, ion jumps over limited ranges lead to an NCL regime at high frequency, a region that extends to lower frequencies as temperature is lowered. There are two experimental observations favoring the second interpretation: (i) The magnitude of the NCL increases with increasing ion concentrationsid02 (this also applies in the ADWP model if the defect centers are somehow associated with the mobile ions); (ii) at large ion concentration and temperatures above 100 K, the scaling properties of the NCL contribution to the conductivity spectra are identical to the scaling properties found at lower frequencies where the dispersive conductivity passes over to the dc conductivity.rol01b ; sid05 On the other hand, experiments carried out by one of the present authors suggest that the low-temperature ( 80 K) NCL in glasses with few ions is due to ADWP-type relaxation of the glass network.sid02 This indicates that both hopping movements of the ions and ADWP-type relaxations in the material contribute to the NCL.hsi96 Which of these dynamic processes dominates depends on composition and temperature.
Again, one may wonder whether it is permissible to neglect interactions, which can be modelled by dipolar forces as regards the short-time dynamics with only local movements of the mobile ions close to some counterions. Monte Carlo studies and analytical calculations have shown that the energetic disorder associated with the local electric field distributions of spatially randomly distributed dipoles gives rise to an NCL contribution at very low temperatures within an effective one-particle description, whereas at higher temperatures such behavior can occur due to many-particle effects.kno96 ; pen98 ; jai99 ; hoh02 ; sch04 ; maa06b ; die08
Finally, it has been suggested that the NCL is caused by vibrational movements of the mobile ions in strongly anharmonic potentials or from ion hopping in a slowly varying cage potential defined by neighboring mobile ions.leo01 ; nga02 ; riv02 These views focus on the very high-frequency NCL. Indeed, at frequencies in the THz range the ac conductivity joins into the vibrational absorption seen in far infrared spectroscopy associated with the quasi-vibrational motion of the mobile ionbur89 Unfortunately, the connection between the NCL and the vibrational modes is poorly investigated: A data gap from the GHz to the THz regions exists because measurements of the dielectric loss are here particularly challenging. More focused studies in this frequency window are needed to elucidate the connection between vibrational and librational (anharmonic) motion, as well as to better characterize the precise frequency dependence of the NCL conductivity, i.e., is it exactly linear (), slightly sub-linear () or slightly super-linear ()?fun96 ; rit07 ; tiw07 ; lin08
VII What is the ion transport mechanism?
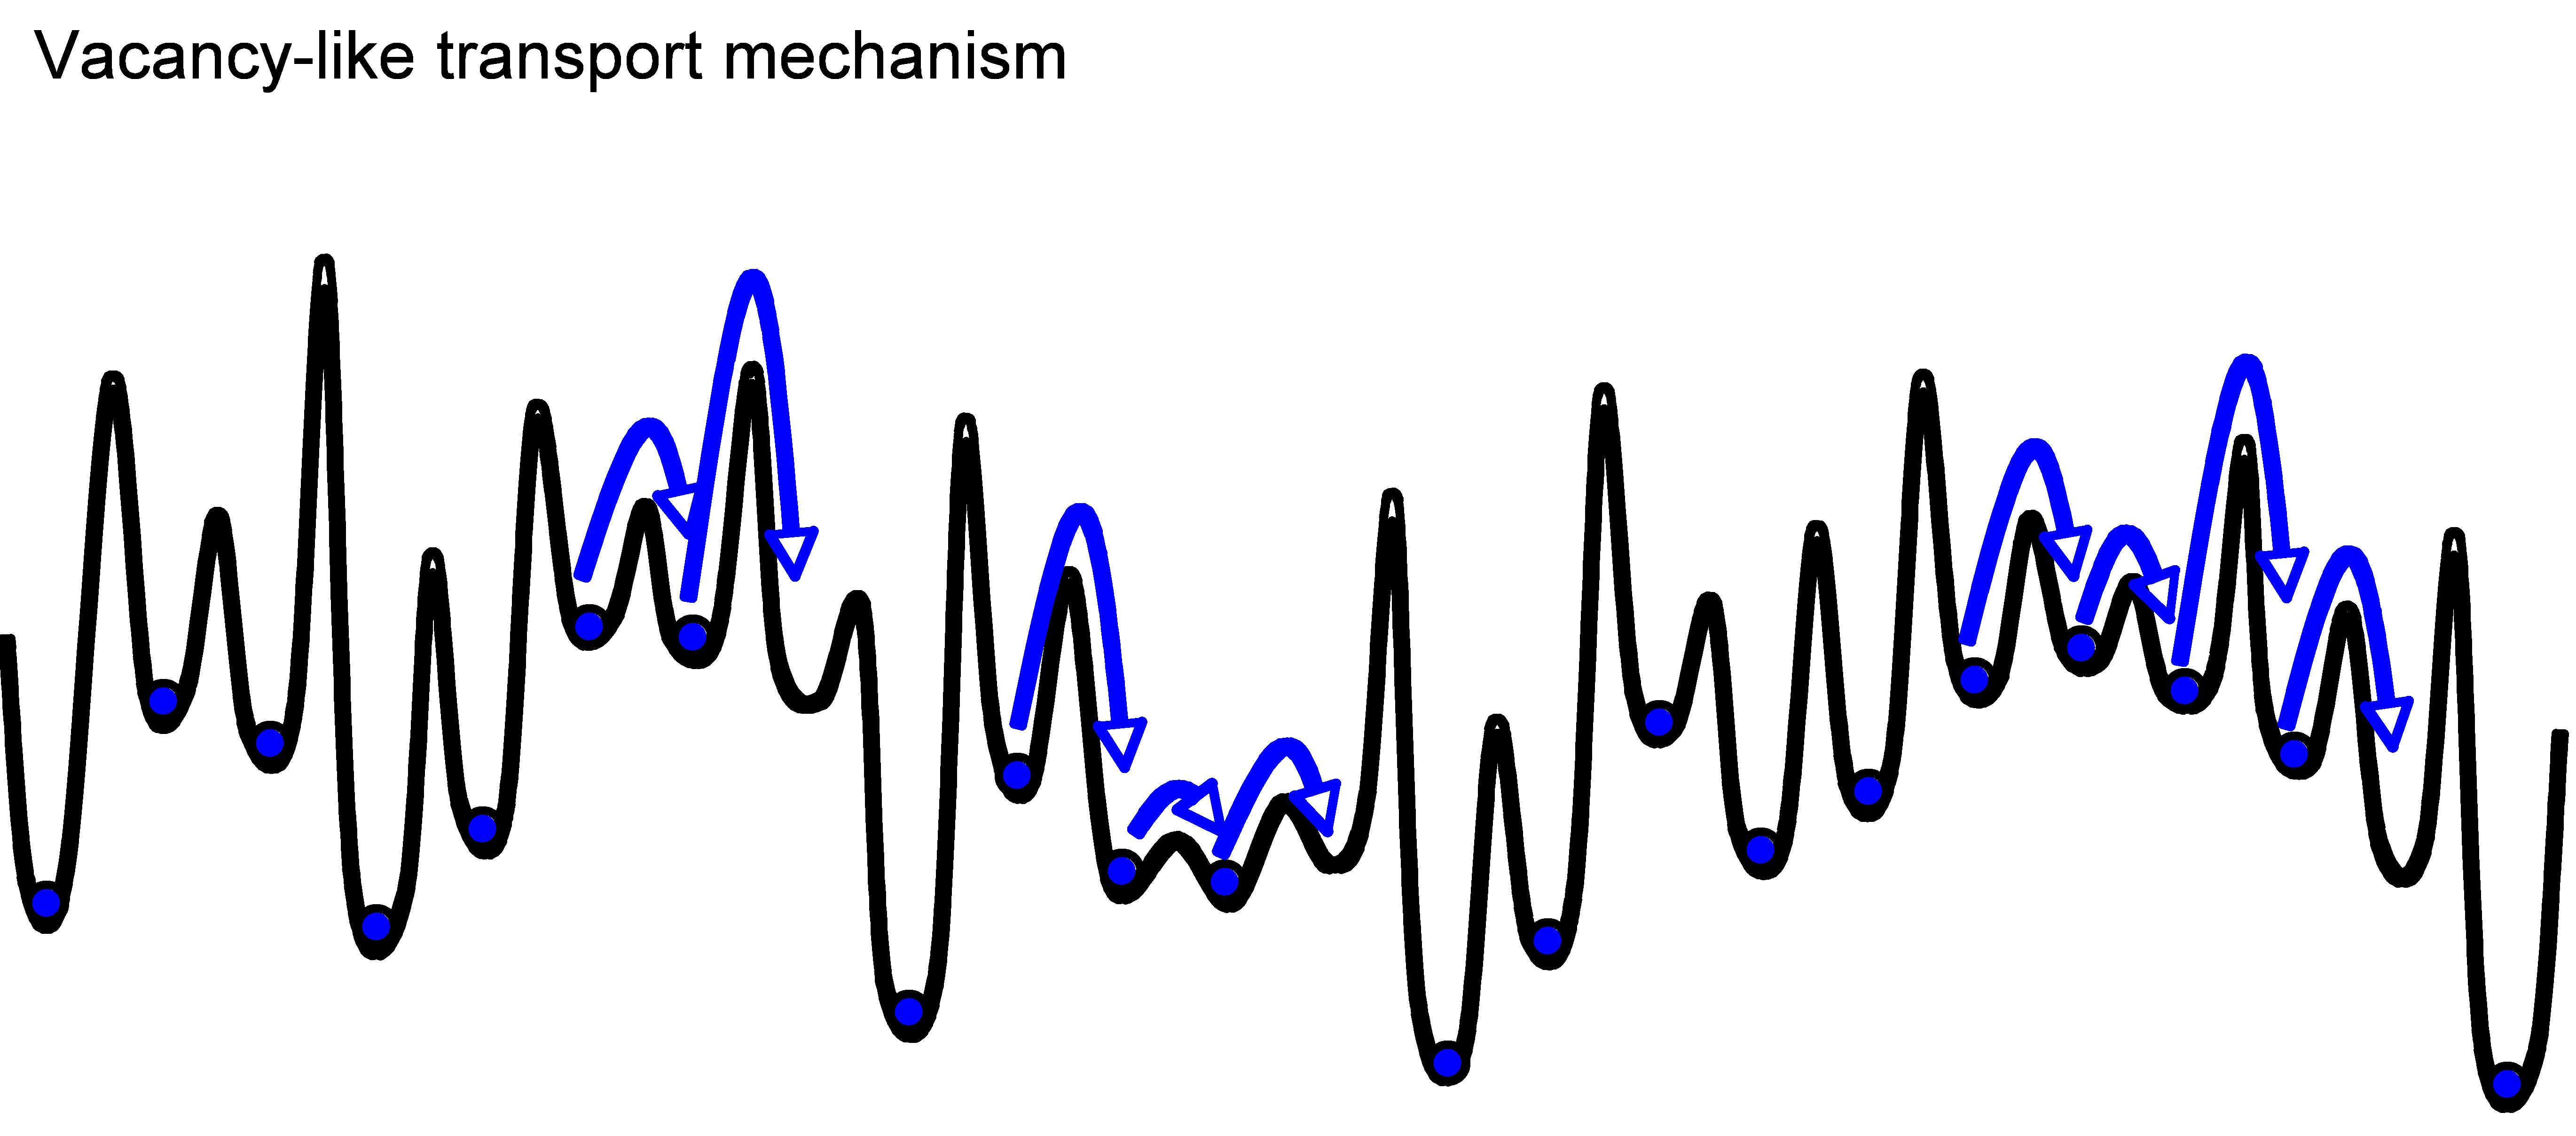
We now turn briefly to the most fundamental question relating to ion conduction in disordered solids: What is the transport mechanism?owe63 ; tom77 ; ing87 ; ang90 ; ang92 ; nga96 ; mey99 ; kna00 ; fel02 ; kee02 ; ali06 ; dut07 ; hab07a ; fun08a As mentioned already, there is evidence that in many cases only few of the sites available for ions are actually vacant. Figure 7 illustrates the vacancy mechanism. Ion conduction in disordered solids does not proceed via the well-understood vacancy mechanism of ionic crystals with few vacancies.boh96 In crystals the vacancy concentration is strongly temperature dependent due to thermally activated defect formation; in glasses the concentration of empty sites is determined by the history of glass formation via the cooling rate, and the number of vacancies is frozen in at the glass transition dyr03 . Moreover, the vacancy concentration in glasses is believed to be significantly larger than in crystals. This makes the conduction mechanism in glasses much more complex, also because vacancy-vacancy interactions generally cannot be ignored. If such interactions are nevertheless not important, one may regard a vacancy as a charge carrier, e.g., in the RBM. In this case, the results of the RBM pertaining to the scaling features of conductivity spectra apply unaltered.
Evidence for the significance of many-particle effects also comes from molecular dynamics simulations and from measurements of the Haven ratio. Simulationshab04 ; hab05 ; hab06 ; kun05 suggest that hopping occurs in a cooperative way, where one ion jump triggers jumps of other ions or hopping events occur collectively by involving several ions. A directional correlation of jumps of different ions is indicated by the measured Haven ratios that are generally smaller than unity,ter75 corresponding to positive cross-correlations in the current autocorrelation function. If heterogeneities in the host network confine the ion motion to channel-like structures, such correlations can be expected to be even more pronounced.mey04 ; bin05 Haven ratios smaller than unity have also been found in Monte Carlo simulations of models with Coulomb interactions.maa95
There is a need for more systematic investigations of the role of many-particle effects. To uncover the ion transport mechanism(s) model predictions should be compared to other experimental observables than conductivity, such as NMR, spin-lattice relaxation, mechanical relaxation, tracer diffusion, quasi-elastic neutron scattering and multiple spin-echo experiments sva93 ; swe96 ; san08 . These methods probe different correlation functions, so checking model predictions against them obviously provides more severe tests than just, e.g., comparing predicted ac conductivity spectra to experiment. Such lines of inquiry, however, have so far only been undertaken in few instances; for example spin-lattice relaxation spectra were investigated in Refs. mey93, ; boh07, ; maa95, , and multiple spin-echo experiments in Ref. vog06, . – The ion conduction mechanism clearly deserves a review on its own summarizing the latest developments. We have here mainly announced the problem and left out detailed considerations of, e.g., the role played by dynamic heterogeneities and possible dynamic channels for conduction pathways kun05 ; jun01 . Hopefully answering the other questions of the present review will provide valuable input into revealing the ion conduction mechanism.
VIII What is the role of dimensionality?
The subdiffusive ion dynamics on transient time scales found ubiquitously in disordered materials is sometimes attributed to a fractal geometry of the conduction paths. A classic example of subdiffusion is particle dynamics occurring on a percolation cluster gef83 ; bun96 . In this case the cluster is fractal on length scales below a correlation length , which diverges when approaching the percolation threshold. At criticality, dangling ends and loops occur on all lengths scales causing the mean-square displacement to increase as a power law with an exponent smaller than one. Close to the percolation threshold, is finite and subdiffusive behavior is observed only in an intermediate time regime, where the mean-square displacement is larger than microscopic length scales and smaller than . For times where the mean-square displacement exceeds , the diffusion eventually becomes normal. This examples suggests that the effective dimensionality of the conduction pathways may play an important role for the subdiffusive behavior, although for conduction pathways containing loops the fractal dimension of the pathway structure and the embedding Euclidian dimension of the material are generally not sufficient to determine the power law exponent in the subdiffusive time regime (see the discussion in chapter 3 of ref. bun96, ). Hence the question arises to what extent, if any, does the dimensionality of the conduction space influence the subdiffusive motion?
A possible scenario for qualitatively understanding the origin of the dimensionality dependence is the following. With decreasing dimensionality, the average distance between the highest barriers (percolation barriers) on the conduction pathways becomes larger. Between these percolation barriers, the ions perform back-and-forth motion. An increasing spatial extent of this back-and-forth motion leads to a larger dielectric relaxation strength, implying a more gradual transition from dc conductivity to dispersive conductivity in the conductivity spectrum.
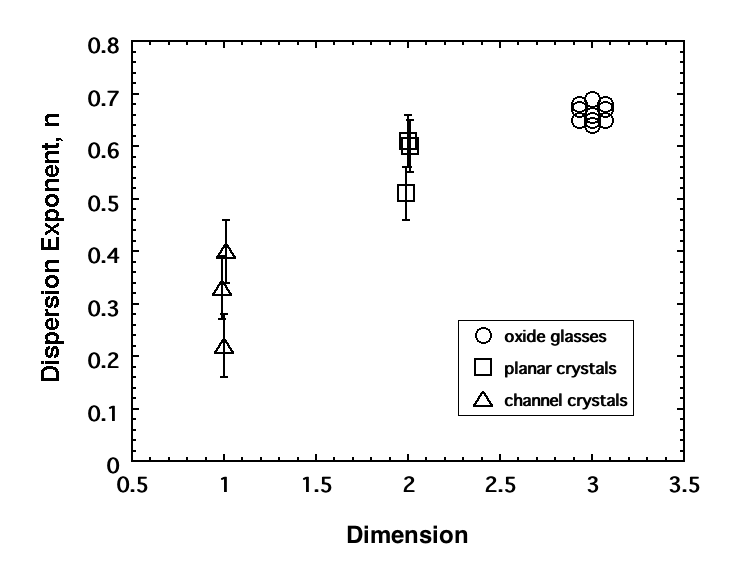
Few studies of this question exist, but there is some evidence that dimensionality does influence the shape of the ac conductivity master curves (the scaling functions of Eq. (12)). This can be seen in 2D crystals, like sodium , and in 1D crystals, like hollandite: The transition from dc conductivity to dispersive conductivity becomes more gradual with decreasing dimension.sid99b This variation in the shape, as characterized by an effective exponent of Eq. (14), is shown in Fig. 8. This sensitivity to dimensionality is also evident in the RBM for which the shape of the conductivity spectra are similarly altered by changing the dimensionality, i.e., in two dimensions the conductivity increases somewhat less steeply with frequency than in three dimensions.dyr96 ; note
The conducting pathways of the two above-mentioned crystals (sodium and hollandite) have a well-defined dimensionality. Is there any other evidence for modifications of the correlated motion which might be connected to the dimensionality (localized) of the conduction space in an amorphous solid? While most disordered materials as mentioned show very similar shapes of the ac conductivity curves, some researcherssid00 ; rol00 ; ing03 have observed systematic changes that appear to arise from changes in the local environment of the ions. In studies of alkali-germanate glasses and alkali-borate glasses of varying ion content, for instance, subtle changes in the shape of the conductivity spectra were seen to correlate to known anomalies in the glass-transition temperature.rol01 ; mur04 The glass-transition temperature passes through a maximum as a result of how added modifier ions initially polymerize, but later depolymerize, the oxide network. Consequently, the average oxygen coordination of the ion’s charge-compensating sites changes with ion concentration, resulting in modifications of the local ion environment which could mimic changes to the dimensionality of the conduction space.ani08 In a similar way, the mixing of two ion species (say Li and Na) modifies the local environment of the ion,ing03 and studies of ac conductivity of mixed-alkali glassesrol00 show a distinct change compared to that found in either single alkali end-member composition alone (compare Fig. 6(b)). Finally, in studies of metaphosphate glasses (whose oxide structure is highly polymeric) systematic changes in the correlated motion occurred in conjunction with variations in the cation size relative to the free volume sid03 . There it was posited that an effective local dimension of conduction space might rule the correlated motion. – More studies along these lines are clearly warranted, but it appears that the effective dimensionality is an important parameter.
IX Concluding remarks
Science progresses by asking questions. It is our hope that this paper will stimulate to works focusing on basic understanding, eventually leading to a physical picture and quantitative model(s) of ion conduction in disordered solids that are as good as those of ionic and electronic conduction in crystals. It is a reasonable working hypothesis that ion conduction in disordered solids can be described in terms of a fairly simple generally applicable model, but only the future can tell whether this hope is realized.
Acknowledgements
This paper was inspired by Round Table Discussions in 2007 at the International Workshop on Ion Dynamics and Relaxation in Ion Conducting Disordered Solids in Le Mans, France. The authors wish to thank Odile Bohnke, the organizer of this productive meeting. Jeppe Dyre gratefully thanks “Glass and Time,” the Danish National Research Foundation’s Centre for Viscous Liquid Dynamics, for support. Philipp Maass and Bernhard Roling gratefully acknowledge financial support by the HI-CONDELEC EU STREP project (NMP3-CT-2005-516975). Bernhard Roling would like to thank the German Science Foundation (DFG) and the Alexander-von-Humboldt foundation for financial support of research projects. David Sidebottom would like to thank the U.S. Department of Energy, Division of Basic Energy Science (DE-FG03-98ER45696) for financial support.
Appendix A Relation between the long-time mean-square displacement and the low-frequency behavior of the ac conductivity
The Kubo formula in dimension (where is the “Laplace frequency” and is eventually taken to zero) reads
| (15) |
Here is the sample volume and the total current is defined by summing over all ions:
| (16) |
Introducing the collective displacement over a time interval of length ,
| (17) |
we have
Accordingly, after a partial integration where the boundary term disappears because for (reflecting the short-time socalled ballistic motion), Eq. (15) takes the form
| (18) |
where and .
We now make the ansatz
| (19) |
with real and . This is the well-known Jonscher ansatz jon77 ; jon83 analytically continued to complex frequencies, because for the real part of the frequency-dependent conductivity Eq. (19) implies with
| (20) |
The analyticity requirement implies that at very low frequencies one must eventually have , but as an effective description of the regime of onset of ac conduction this ansatz may still be used. It follows that
| (21) |
Thus via a Tauberian theorem one concludes that
| (22) |
Since asymptotic expansions can be integrated term by term and , we obtain
| (23) |
or, if is a collective diffusion coefficient,
| (24) |
If we introduce the time scale corresponding to the above-defined crossover frequency where , and if we assume that the Jonscher ansatz is a good description near the crossover so that the asymptotic expression applies, Eq. (24) implies
| (25) |
with
| (26) |
The factor is roughly two for , but diverges for . If we further replace the collective mean-square displacement by the single-particle mean-square displacement , using the definition of the time-dependent Haven ratio
| (27) |
that can be approximated by the Haven ratio in the dc-limit that is accessible via radioactive tracer experiments,hav65 ; ter75 ; isa99 i.e., , we arrive at Eq. (5) of the main text (where ):
| (28) |
Appendix B Accurate representation of the random barrier model universal ac conductivity
The expression Eq. (14) gives a good overall fit to the universal ac conductivity of the random barrier model (RBM) arising in the extreme disorder limit, but in the range of frequencies where the conductivity approaches the dc level () there are significant deviations for both the real and imaginary parts of the conductivity. Thus for the imaginary part Eq. (14) predicts that for . This contradicts experiment, analyticity as well as RBM computer simulationssch08 that all imply for . An accurate analytical representation of the RBM universal ac conductivity with the correct low-frequency behavior is given sch08 by the equation
| (29) |
In this expression frequency is scaled such that for , i.e., the frequency scaling is different from that of Eq. (14). This equation is easily solved numerically for both real and imaginary parts as functions of frequency. Alternatively, numerical solutions to it – as well as to Eq. (14) – are available as ASCII files (see reference 22 of Ref. sch08, ).
References
- (1) Knauth P 2000 J. Electroceram. 5 111
- (2) Dubbe A 2003 Sensors and Actuators B - Chemical 88 138
- (3) Kharton V V, Marques F M B and Atkinson A 2004 Solid State Ionics 174 135
- (4) Knauth P and Tuller H L 2004 J. Am. Ceram. Soc. 85 1654
- (5) Vinatier P and Hamon Y 2006 in Charge Transport in Disordered Solids, edited by S. Baranovski (Wiley, Chichester) p. 403
- (6) Hui SQ, Roller J, Yick S, Zhang X, Deces-Petit C, Xie Y S, Maric R and Ghosh D 2007 J. Power Sources 172 493
- (7) Niklasson G A and Granqvist C G 2007 J. Mater. Chem. 17 127
- (8) Grozema F C and Siebbeles L D A 2008 Int. Rev. Phys. Chem. 27 87
- (9) Funahashi M, Shimura H, Yoshio M and Kato T 2008 Liquid crystalline functional assemblies and their supramolecular structures Book Series: Structure and bonding 128 151
- (10) Bunde A, Funke K and Ingram MD 1998 Solid State Ionics 105 1
- (11) Owen A E 1963, in Progress in Ceramic Science, Vol. 3, edited by J. E. Burke (Macmillan, New York), p. 77
- (12) Tomozawa M 1977 in Treatise on Materials Science, Vol. 12, edited by M. Tomozawa (Academic, New York), p. 283
- (13) Tuller H L, Button D P and Uhlmann D R 1980 J. Non-Cryst. Solids 40 93
- (14) Ingram M D 1987 Phys. Chem. Glasses 28 215
- (15) Vincent C A 1987 Prog. Solid State Chem. 17 145
- (16) Kremer F, Dominguez L, Meyer W H and Wegner G 1989 Polymer 30 2023
- (17) Angell C A 1990 Chem. Rev. 90 523
- (18) Martin S W 1991 J. Am. Ceramic Soc. 74 1767
- (19) Angell C A 1992 Ann. Rev. Phys. Chem. 43 693
- (20) Heitjans P and Indris S 2003 J. Phys.: Condens. Matter 15 R1257
- (21) Maier J 1995, Prog. Solid State Chem. 23 171
- (22) Almond D P and West AR 1983 Solid State lonics 11 57
- (23) Dyre J C 1991 J. Non-Cryst. Solids 135 219
- (24) Elliott S R 1994 J. Non-Cryst. Solids 170 97
- (25) Moynihan C T 1994 J. Non-Cryst. Solids 172 1395
- (26) Ngai K L and Rendell R W 2000 Phys. Rev. B 61 9393
- (27) Sidebottom D L, Roling B and Funke K 2001 Phys. Rev. B 63 024301
- (28) Hodge I M, Ngai K L and Moynihan C T 2005 J. Non-Cryst. Solids 351 104
- (29) Almond D P, Duncan G K and West A R 1983 Solid State Ionics 8 159
- (30) Almond D P and West A R 1983 Solid State Ionics 9/10 277
- (31) Hairetdinov E F, Uvarov N F, Patel H K and Martin S W 1994 Phys. Rev. B 50 13259
- (32) Dyre J C 1988 J. Appl. Phys. 64 2456
- (33) Maass P, Petersen J, Bunde A, Dieterich W and Roman H E 1991 Phys. Rev. Lett. 66 52
- (34) Funke K 1993 Prog. Solid St. Chem. 22 111
- (35) Maass P, Meyer M and Bunde A 1995 Phys. Rev. B 51 8164
- (36) Dyre J C and Schrøder T B 2000 Rev. Mod. Phys. 72 873
- (37) Roling B, Martiny C and Bruckner S 2001 Phys. Rev. B 63 214203
- (38) Murugavel S and Roling B 2004 J. Phys. Chem. B 108 2564
- (39) Haven Y and Verkerk B 1965 Phys. Chem. Glasses 6 38
- (40) Terai R and Hayami R 1975 J. Non-Cryst. Solids 18 217
- (41) Isard J O 1999 J. Non-Cryst. Solids 246 16
- (42) Schütt H J 1994 Solid State Ionics 70/71 505
- (43) Tomozawa M and Shin D-W 1998 J. Non-Cryst. Solids 241 140
- (44) Klein R J, Zhang S H, Dou S, Jones B H, Colby R H and Runt J 2006 J. Chem. Phys. 124 144903
- (45) Martin S W personal communication.
- (46) Rivera A and Sanz J 2004 Phys. Rev. B 70 094301
- (47) Berndt S, Jeffrey K R, Küchler R and Böhmer R 2005 Solid State NMR 27 122
- (48) Mustarelli P, Tomasi C, Garcia M D P and Magistris A 2006 Phys. Chem. Glasses – Eur. J. Glass Sci. Technol. B 47 484
- (49) Bohnke O, Badot J C and Emery J 2003 J. Phys.: Condens. Matter 15 7571
- (50) Böhmer R, Jeffrey K R and Vogel M 2007 Prog. Nucl. Magn. Res. Spect. 50 87
- (51) Ingram M D, Moynihan C T and Lesikar A V 1980 J. Non-Cryst. Solids 38-39 371
- (52) Ravaine D and Souquet J L 1977 Phys. Chem. Glasses 18 27
- (53) Isard J O 1976 Phys. Chem. Glasses 17 1
- (54) Heyne L 1977 in Solid Electrolytes, edited by Geller S (Springer, Berlin) p.169
- (55) Riess I 1991 Solid State Ionics 44 199
- (56) Riess I 1997 in CRC Handbook of Solid State Electrochemistry, edited by Gellings P J and Bouwmeester H J M (CRC Press, New York), p. 223
- (57) Macdonald J R 1953 Phys. Rev. 92 4
- (58) Friauf R J 1954 J. Chem. Phys. 22 1329
- (59) Ilschner B 1958 J. Chem. Phys. 28 1109
- (60) Beaumont J H and Jacobs P W M 1967 J. Phys. Chem. Solids 28 657
- (61) Bazant MZ, Thornton K and Ajdari A 2004 Phys. Rev. E 70 021506
- (62) Schütt H J and Gerdes E 1992 J. Non-Cryst. Solids 144 14
- (63) Pitarch A, Bisquert J and Garcia-Belmonte G 2003 J. Non-Cryst. Solids 324 196
- (64) Hughes K and Isard J O 1968 Phys. Chem. Glasses 9 37
- (65) Isard J O 1968 J. Non-Cryst. Solids 1 235
- (66) Day D E 1976 J. Non-Cryst. Solids 21 343
- (67) Ingram M D 1994 Glastech. Ber. Glass Sci. Technol. 67 151
- (68) Voss S, Imre A W and Mehrer H 2004 Phys Chem Chem Phys. 6 3669
- (69) Voss S, Berkemeier F, Imre A W and Mehrer H 2004 Z. Phys. Chem. 218 1353
- (70) Maass P, Bunde A and Ingram M D 1992 Phys. Rev. Lett. 68 3064
- (71) Bunde A, Ingram M D and Maass P 1994 J. Non-Cryst. Solids 172-174 1222
- (72) Hunt A 1994 J. Non-Cryst. Solids 175 129
- (73) Greaves G N and Ngai K L 1995 Phys. Rev. B 52 6358
- (74) Habasaki J, Okada I and Hiwatari Y 1995 J. Non-Cryst. Solids 183 12
- (75) Hunt A 1995 J. Non-Cryst. Solids 255 47
- (76) Habasaki J, Okada I and Hiwatari Y 1996 J. Non-Cryst. Solids 208 181
- (77) Swenson J, Matic A, Brodin A, Borjesson L and Howells W S 1998 Phys. Rev. B 58 11331
- (78) Tomozawa M 1998 Solid State Ionics 105 249
- (79) Baranovski S D and Cordes H 1999 J. Chem. Phys. 111 7546
- (80) Maass P 1999 J. Non-Cryst. Solids 255 35
- (81) Schulz B M, Dubiel M and Schulz M 1999 J. Non-Cryst. Solids 241 149
- (82) Kirchheim R 2000 J. Non-Cryst. Solids 272 85
- (83) Swenson J, Matic A, Karlsson C, Börjesson L, Meneghini C and Howells W S 2001 Phys. Rev. B 63 132202
- (84) Swenson J and Adams S 2003 Phys. Rev. Lett. 90 155507
- (85) Bunde A, Ingram M D and Russ S 2004 Phys. Chem. Chem. Phys. 6 3663
- (86) Habasaki J, Ngai K L and Hiwatari Y 2004 J. Chem. Phys. 121 925
- (87) Imre A W, Divinski S V, Berkemeier F, and Mehrer H 2006 J. Non-Cryst. Solids 352 783
- (88) Habasaki J and Ngai K L 2007 Phys. Chem. Chem. Phys. 9 4673
- (89) Zielniok D, Eckert H and Cramer C 2008 Phys. Rev. Lett. 100 035901
- (90) Greaves G N, Gurman S J, Catlow C R A, Chadwick A V, Houde-Walter S, Henderson C M B and Dobson B R 1991 Phil. Mag. A 64 1059
- (91) Houde-Walter S N, Inman J M, Dent A J and Greaves G N 1993 J. Phys. Chem. 97 9330
- (92) Gee B, Janssen M and Eckert H 1997 J. Non-Cryst. Solids 215 41
- (93) Kamitsos E I, Patsis A P and Chryssikos G D 1993 J. Non-Cryst. Solids 152 246
- (94) Kamitsos E I, Yiannopolous Y D, Jain H and Huang W C 1996 Phys. Rev. B 54 9777
- (95) Kamitsos E I and Chryssikos G D 1998 Solid State Ionics 105 75
- (96) Uchino T, Sakka T, Ogata Y and Iwasaki M 1992 J. Non-Cryst. Solids 146 26
- (97) Uchino T and Yoko T 1999 J. Phys. Chem. B 102 8372
- (98) Balasubramanian S and Rao K J 1993 J. Phys. Chem. 97 8835
- (99) Lammert H, Kunow M and Heuer A 2003 Phys. Rev. Lett. 90 215901
- (100) Lammert H and Heuer A 2005 Phys. Rev. B 72 214202
- (101) Peibst R, Schott S and Maass P 2005 Phys. Rev. Lett. 95 115901
- (102) Maass P and Peibst R 2006 J. Non-Cryst.Solids 352 5178
- (103) Zdaniewski W A, Rindone G E and Day D E 1979 J. Mater. Sci. 14 763
- (104) Dyre J C 2003 J. Non-Cryst. Solids 324 192
- (105) Habasaki J and Hiwatari Y 2004 Phys. Rev. B 69 144207
- (106) Vogel M 2004 Phys. Rev. B 70 094302
- (107) Chandrashekhar G V and Foster L M 1978 Solid State Commun. 27 269
- (108) Foster L M, Anderson M P, Chandrashekhar G V, Burns G and Bradford R B 1981 J. Chem. Phys. 75 2412
- (109) Bruce J A and Ingram M D 1983 Solid State Ionics 9-10 717
- (110) Meyer M, Jaenisch V, Maass P and Bunde A 1996 Phys. Rev. Lett. 76 2338
- (111) Meyer M, Maass P and Bunde A 1998 J. Chem. Phys. 109 2316
- (112) Jonscher A K 1977 Nature 267 673
- (113) Jonscher A K 1996 Universal Relaxation Law (Chelsea Dielectrics Press, London)
- (114) Funke K, Singh P and Banhatti R D 2007 Phys. Chem. Chem. Phys. 9 5582
- (115) Bowen C R and Almond D P 2006 Mater. Sci. and Technol. 22 719
- (116) Murugaraj R 2007 J. Mater. Sci. 42 10065
- (117) Papathanassiou A N, Sakellis I and Grammatikakis J 2007 Appl. Phys. Lett. 91 122911
- (118) Barton J L 1966 Verres Refr. 20 328
- (119) Nakajima T 1972 in Annual Report, Conference on Electric Insulation and Dielectric Phenomena (National Academy of Sciences, Washington DC) p. 168
- (120) Namikawa H 1975 J. Non-Cryst. Solids 18 173
- (121) Dyre J C 1986 J. Non-Cryst. Solids 88 271
- (122) Schrøder T B and Dyre J C 2000 Phys. Rev. Lett. 84 310
- (123) Dieterich W and Maass P 2002 Chem. Phys. 28 439
- (124) Bettman M and Peters C R 1969 J. Phys. Chem. 73 1774
- (125) Funke K and Schneider H J 1984 Solid State Ionics 13 335
- (126) Funke K, Banhatti R D, Wilmer D, Dinnebier R, Fitch A and Jansen M 2006 J. Phys. Chem. A 110 3010
- (127) Svare I 1999 Solid State Ionics 125 47
- (128) Vogel M, Brinkmann C, Eckert H and Heuer A 2004 Phys. Rev. B 69 094302
- (129) Roling B, Happe A, Funke K and Ingram M D 1997 Phys. Rev. Lett. 78 2160 (in this work the BNN relation was not used to scale the spectra, but the authors used that corresponds to the BNN crossover frequency if follows a Curie law, ).
- (130) Sidebottom D L 1999 Phys. Rev. Lett. 82 3653
- (131) Funke K, Wilmer D, Lauxtermann T, Holzgreve R and Bennington S M 1996 Solid State Ionics 86-88 141
- (132) Cramer C, Bruckner S, Gao Y and Funke K 2002 Phys. Chem. Chem. Phys. 4 3214
- (133) Pimenov A, Lunkenheimer P, Rall H, Kohlhaas R, Loidl A and Böhmer R 1995 Phys. Rev. E 54 676
- (134) Singh P, Banhatti R D and Funke K 2005 Phys. Chem. Glasses 46 241
- (135) Sidebottom D L, Green P F and Brow R K 1996 J. Non-Cryst. Solids 203 300
- (136) Bunde A and Havlin S 1996 Fractals and Disordered Systems (Springer, Berlin)
- (137) Schrøder T B and Dyre J C 2002 Phys. Chem. Chem. Phys. 4 3173
- (138) Schrøder T B and Dyre J C 2008 Phys. Rev. Lett. 101, 025901
- (139) Roling B 2001 Phys. Chem. Chem. Phys. 3 5093
- (140) Hunt A 1993 J. Non-Cryst. Solids 160 183
- (141) Ishii T 2007 J. Phys. Soc. Japan 76 064603
- (142) Dyre J C 1993 Phys. Rev. B 48 12511
- (143) Almond D P and Bowen C R 2004 Phys Rev. Lett. 92 157601
- (144) Porto M, Maass P, Meyer M , Bunde A and Dieterich W 2000 Phys. Rev. B 61 6057
- (145) Pasveer W F, Bobbert P A and Michels M A J 2006 Phys. Rev. B 74 165209
- (146) Schrøder T B 2008 Europhys. Lett. 81 30002
- (147) Müller C, Zienicke E, Adams S, Habasaki J and Maass P 2007 Phys. Rev. B 75 014203
- (148) Meyer A, Horbach J, Kob W, Kargl F and Schober H 2004 Phys. Rev. Lett. 93 027801
- (149) Knödler D, Pendzig P and Dieterich W 1996 Solid State Ionics 86-88 29
- (150) Pendzig P and Dieterich W 1998 Solid State Ionics 105 209
- (151) Burns A, Chryssikos G D, Tombari E, Cole R H and Risen W M 1989 Phys. Chem. Glasses 30 264
- (152) Ngai K L 1999 J.Chem. Phys. 110 10576
- (153) Phillips W A 1987 Rep. Progr. Phys. 50 1657
- (154) Balzer-Jöllenbeck G, Kanert O, Steinert J and Jain H 1988 Solid State Comm. 65 303
- (155) Nowick A S, Lim B S and Vaysleyb A V 1994 J. Non-Cryst. Solids 172 1243
- (156) Lu X and Jain H 1994 J. Phys. Chem. Solids 55 1433
- (157) Roling B, Martiny C and Murugavel S 2001 Phys. Rev. Lett. 87 085901
- (158) Sidebottom D L and Marray-Krezan C M 2002 Phys. Rev. Lett. 89 195901
- (159) Sidebottom D L 2005 Phys. Rev. B 71 134206
- (160) Hsieh C H and Jain H 1996 J. Non-Cryst. Solids 203 293
- (161) Jain H 1999 Met. Mater. Processes 11 317
- (162) Höhr T, Pendzig P, Dieterich W and Maass P 2002 Phys. Chem. Chem. Phys. 4 3168
- (163) Schulz M, Dieterich W and Maass P 2004 Z. Phys. Chem. 218 1375
- (164) Maass P, Dieterich W and Scheffler F 2006, in Flow Dynamics: The Second International Conference on Flow Dynamics, AIP Conference Proceedings, edited by M. Tokuyama and S. Maruyama (Melville, New York) 832 492.
- (165) Dieterich W, Maass P and Schulz M 2008 Eur. Phys. J.: Special Topics 161 79
- (166) Leon C, Rivera A, Varez A, Sanz J, Santamaria J and Ngai KL 2001 Phys. Rev. Lett. 86 1279
- (167) Ngai K L and Leon C 2002 Phys. Rev. B 66 064308
- (168) Rivera A, Leon C, Varsamis C P E, Chryssikos G D, Ngai K L, Roland C M and Buckley L J 2002 Phys. Rev. Lett. 88 125902
- (169) Funke K, Cramer C, Roling B, Saatkamp T, Wilmer D and Ingram M D 1996 Solid State Ionics 85 293
- (170) Ritus A I 2007 J. Phys.: Condens. Matter 19 086222
- (171) Tiwari J P and Shahi K 2007 Phil. Mag. 87 4475
- (172) Linares A, Canovas M J and Ezquerra T A 2008 J. Chem. Phys. 128 244908
- (173) Ngai K L 1996 J. Non-Cryst. Solids 203 232
- (174) Meyer W H 1999 Adv. Materials 10 439
- (175) Feldman Y, Puzenko A and Ryabov Y 2002 Chem. Phys. 284 139
- (176) Keen D A 2002 J. Phys.: Condens. Matter 14 R819
- (177) Alig I, Dudkin S A, Jenninger W and Marzantowicz M 2006 Polymer 47 1722
- (178) Dutta A and Ghosh A 2007 J. Chem. Phys. 127 144504
- (179) Habasaki J 2007 J. Non-Cryst. Solids 353 3956
- (180) Funke K and Banhatti R D 2008 Solid State Sciences 10 790
- (181) Bohnke O, Bohnke C and Fourquet J L 1996 Solid State Ionics 91 21
- (182) Habasaki J, Ngai K L and Hiwatari Y 2005 J. Chem. Phys. 122 054507
- (183) Habasaki J and Ngai K L 2006 J. Non-Cryst. Solids 352 5170
- (184) Kunow M and Heuer A 2005 Phys. Chem. Chem. Phys. 7 2131
- (185) Binder K, Horbach J, Winkler A and Kob W 2005 Ceram. Int. 31 713
- (186) Svare I, Borsa F, Torgeson D R and Martin S W 1993 Phys. Rev. B 48 9336
- (187) J Swenson and Borjesson L 1996 Phys. Rev. Lett. 77 3569
- (188) Sangoro J R, Serghei A, Naumov S, Galvosas P, Karger J, Wespe C, Bordusa F, and Kremer F 2008 Phys. Rev. E 77 051202
- (189) Meyer M, Maass P and Bunde A 1993 Phys. Rev. Lett. 71 573
- (190) Vogel M, Brinkmann C, Eckert H and Heuer A 2006 J. Non-Cryst. Solids 352 5156
- (191) Jund P, Kob W and Jullien R 2001 Phys. Rev. B 64 134303
- (192) Gefen Y, Aharony A and Alexander S 1983 Phys. Rev. Lett. 50 77
- (193) Sidebottom D L 1999 Phys. Rev. Lett. 83 983
- (194) Dyre J C and Schrøder T B 1996 Phys. Rev. B 54 14884
- (195) In Ref. dyr96, ac conduction in one dimension was also simulated. This was done by introducing an artificial activation energy cut-off, which is needed to get sensible results (in two and three dimensions the cut-off is provided automatically by the percolation phenomenon). In this artificial model the ac conductivity is more like it is in three dimensions, than like two dimensions. One dimension is often strange and unphysical, however, so we do not believe that this observation invalidate the general argument presented.
- (196) Roling B and Martiny C 2000 Phys. Rev. Lett. 85 1274
- (197) Ingram M D and Roling B 2003 J. Phys.: Condens. Matter 15 S1595
- (198) Sidebottom D L 2000 Phys. Rev. B 61 14507
- (199) Aniya M 2008 J. Non-Cryst. Solids 354 365
- (200) Sidebottom D L 2003 J. Phys.: Condens. Matter 15 S1585