High energy properties of PKS 1830-211
Abstract
We report on an analysis of X- and -ray observations of PKS , based on the long-term campaigns carried out by INTEGRAL and COMPTEL. The INTEGRAL data currently available present a significance detection in the keV band, while the COMPTEL -years data provide a significance detection in the MeV energy band. At hard X-rays, INTEGRAL and supplementary SWIFT observations show flux variability on timescales of months. At -rays, the source shows persistent emission over years. The hard X-ray spectrum is well represented by a power-law model, with in the keV band. This photon index is well consistent with the previous report of obtained at keV from the best fit of XMM-Newton data with a broken power law model. The joint XMM-Newton/INTEGRAL spectrum presented here is then fit with a broken power-law model and the parameters are refined compared to the previous. The results show the photon index changes from to at a break energy keV. At MeV energies, the spectrum softens to . These results, together with the EGRET measurement at MeV, constitute a broad-band spectrum containing the peak of the power output at MeV energies, similar to most high-luminosity -ray blazars. The measured spectral characterstics are then discussed in the framework of the gravitational lens effects.
1 Introduction
Since the first gravitational lens candidate was detected in 1979 (Walsh et al. 1979), the total number of such system has grown since (e.g. Schneider et al. 1992). Among them is the high redshift blazar PKS (), gravitationally lensed by an intervening galaxy at . The discovery of such gravitational system traces back to radio observations (Pramesh Rao & Subrahmanyan 1988). The radio map was composed of two compact components separated by , supposed to be the split images from the central region of the source and an extended structure which is most probably from the jet and regarded as an unusually strong Einstein ring (see Jauncey et al. 1991; Sunita Nair et al. 1993). Steppe et al. (1993) have shown that PKS is radio variable on timescales of months.
X-ray observations (Chandra and INTEGRAL) revealed a quite hard spectrum, modeled with a power-law with a photon index over the energy band keV (De Rosa et al. 2005). The spectral flattening at low energies has been often modeled with absorption in excess to the Galactic column ( cm-2, Kalberla et al. 2005). The column density has been measured at soft X-rays by ROSAT (Mathur & Nair 1997) and ASCA (Oshima et al. 2001) as well as by Chandra (De Rosa et al. 2005), which suggests a column density of either cm-2 at the lensing galaxy () or cm-2 intrinsic to the source. XMM-Newton observations gave similar results, but the best fit is obtained with a broken power-law model, with the photon index changing from to at energies around keV (Foschini et al. 2006).
PKS was included in the first INTEGRAL catalogue by Beckmann et al. (2006), with a photon index in the keV energy band and in the INTEGRAL extragalactic survey by Bassani et al. (2006), with a keV flux mCrab level averaged over the first years of the INTEGRAL observations.
At MeV energies PKS was firstly reported by Collmar (2006). The COMPTEL first 4-year observations (1991-1995) revealed a detection of in the MeV band. Contemporaneously, PKS was detected by EGRET at MeV with significance and a photon index (Hartman et al. 1999).
Since the amount of INTEGRAL public data has been significantly increased after the last report, we decided to carry out a detailed analysis of PKS with all available INTEGRAL data. We also reanalyzed the XMM-Newton data with a newer software version, which allow us to extend the analysis down to keV. The data from COMPTEL and EGRET are also reanalyzed and added in order to obtain the best broad-band high-energy spectrum available to date.
Long-term observations by SWIFT at hard X-rays and by COMPTEL at MeV energies are dug for investigating the spectral and flux variability. The results are finally discussed in the context of a gravitational lensing system, as is appropriate to PKS .
In the following we assume km s-1 Mpc-1 and , measured from the latest WMAP data (Spergel et al. 2007).
2 Observations and data analysis
2.1 INTEGRAL
INTEGRAL is an ESA scientific mission dedicated to high-resolution spectroscopy (; SPI see Vedrenne et al. 2003) and imaging (angular resolution: FWHM, point source location accuracy: ; IBIS, see Ubertini et al. 2003) of celestial -ray sources in the energy range keV to MeV, with simultaneous monitoring at X-rays ( keV, angular resolution: ; JEM-X, see see Lund et al. 2003) and optical wavelength (Johnson V-filter, nm; OMC, see see Mas-Hesse et al. 2003). All the instruments onboard INTEGRAL, except OMC, work with coded masks. The observational data from the detector IBIS/ISGRI ( keV, Lebrun et al. 2003) have been considered in our analysis of PKS , because of highest quality.
The available INTEGRAL observations when PKS fell into the Fully-Coded Field of View (FCFoV) of ISGRI (up to April 29, 2006; see Table 1) comprise about science windows (scw), for a total exposure of ks, i.e., about ks of new data analyzed here for the first time. Most of these observations were carried out in a dithering mode. The analysis were performed by using the INTEGRAL Offline Scientific Analysis (OSA) version 7.0, whose algorithms for IBIS are described in Goldwurm et al. (2003). All the sources within the FOV which are brighter or comparable to PKS were taken into account in extracting the source spectrum and light curve. An additional % systematic error was added to the spectra because of calibration uncertainties. The spectra were fitted with XSPEC v 12.3.1 and the model parameters were estimated at % confidence level.
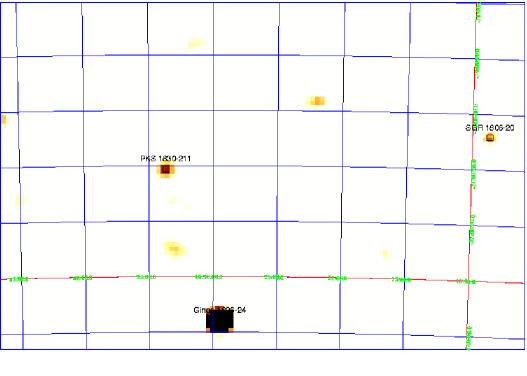
The sum of all observations provide a detection with IBIS/ISGRI at level in the keV energy band (Fig.1). The average keV flux is counts/s, corresponding to mCrab, consistent with the results obtained by Bassani et al. (2006) over the first 2.5-year data.
The spectrum of the entire ISGRI data is well fit ( with degrees of freedom) by a power-law model with in the keV energy band. We would like to note that the contribution from 150-250 keV is rather small and therefore does not affect the overall spectral fitting.
2.2 XMM-Newton
The XMM-Newton data available for PKS are three observations with the ObsID , and , carried out in March , , and April , 2004, respectively (Table 2). Data of EPIC-PN (Strüder et al. 2001) and EPIC-MOS (Turner et al. 2001) have been processed, screened and analyzed by using the same procedures described in Foschini et al. (2006), but with SAS v 7.1.0 with the latest calibration files as of July , . This software version allows us to probe the lowest energy part of the spectrum (down to keV).
The results of the fits on the individual and averaged ObsID are summarized in Table 3. The three observations show no significant flux and spectral variability; therefore, we integrated, with the FTOOL addspec, all the MOS1, MOS2 and PN data, respectively, to obtain an average spectrum for the joint fit with ISGRI data. Although, the broken power-law and the log-parabola models can be fit with similar results in the test, the broken power-law is slightly better and we consider this model as the best fit. The use of a ionized absorber intrinsic to the source, to model the low-energy photon deficit, gave worst results ( for dof in the average spectrum). A change in is about 130 with respect to the cold absorption shown in Table 6.
2.3 SWIFT
SWIFT is a -ray burst explorer and was launched on November 20, 2004. It carries three co-aligned detectors (Gehrels et al. 2004), namely the Burst Alert Telescope (BAT, Barthelmy et al. 2005), the X-Ray Telescope (XRT, Burrows, et al. 2005) and the Ultraviolet/Optical Telescope (UVOT, Roming et al. 2005).
BAT has rather large field of view of sr in partially-coded mode and works in the keV energy band. This makes it possible for a source to be daily monitored at the hard X-rays. The data products are therefore the source lightcurves and are publicly available111See the SWIFT/BAT transient monitor results provided by the SWIFT Team at http://swift.gsfc.nasa.gov/docs/swift/results/transients/. The BAT lightcurve traces PKS back to February 12, 2005, in the keV energy band (see Fig.2). This lightcurve has a weighted-average flux value of counts cm-2 s-1, corresponding to mCrab at over a time period of roughly years.
2.4 COMPTEL
The imaging Compton Telescope COMPTEL (1991-2000) onboard the Compton Gamma-Ray Observatory (CGRO) was sensitive to -rays in the MeV energy range with an energy resolution of %. It had a large field of view and was able to detect -ray sources with an accuracy of the order of (e.g., see Schönfelder et al. 1993).
The standard imaging method of maximum likelihood was applied for COMPTEL data analysis. The detection significance can be estimated from the quantity , where is the ratio of the likelihood for the background and the source plus background. For a known source, has the distribution with free parameter in addition to the null hypothesis (, de Boer et al. 1992). The point spread function of the instrument is applied by assuming an E-2 power law shape for the input spectrum. The background is derived, with the first order of approximation, by a filter technique in data space (Bloemen et al. 1994).
PKS was marginally detected in the MeV band at level, using the first 4-years data (Collmar 2006). Here we take the complete 6-years COMPTEL data (see Table 4), until the second reboost of the satellite in 1997, after which the background changed a lot making it difficult for further research, to investigate again the MeV emission. These data are subdivided into the so-called CGRO phases, with each period covering typically one year of observations. The source is again detected mainly in MeV band, but the detection significance is improved to () by using two-year more data. Fig. 3 shows the sky map in MeV band. The source fluxes are given in Table 5, in energy bands (, , and MeV, respectively).
3 Time variability
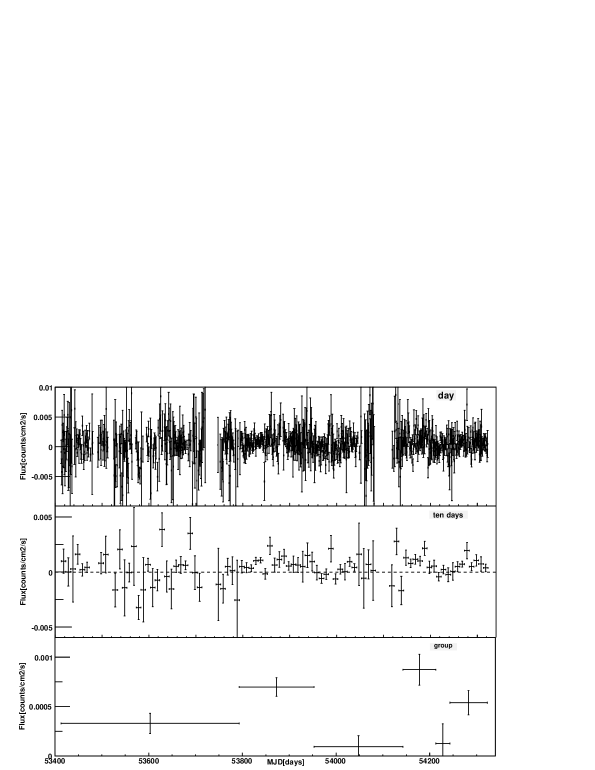
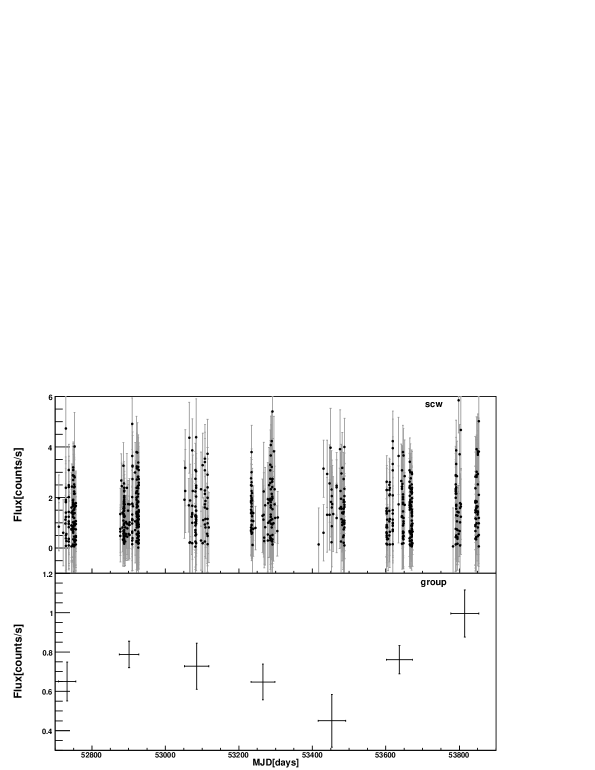
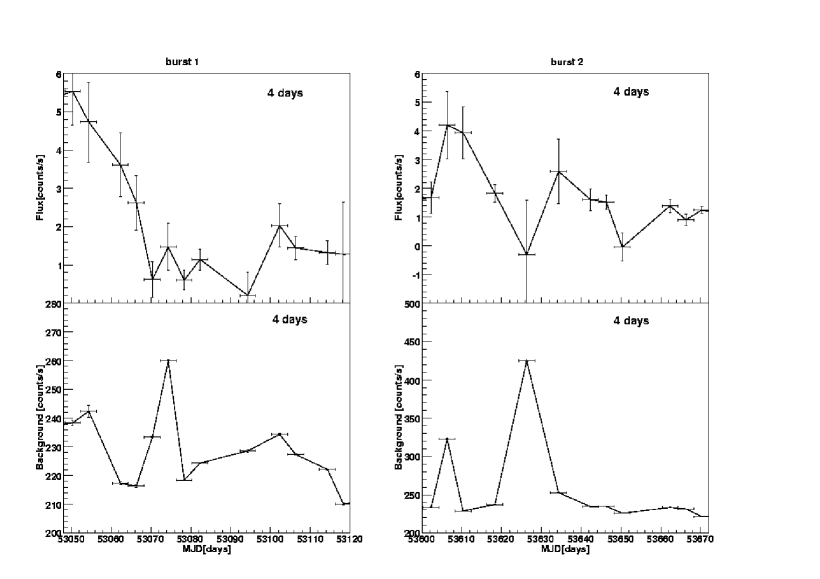
The ISGRI light curve on a scw basis shows no clear flux variability (see Fig. 4). A fit to this lightcurve with a constant results in a . To improve the statistics, data from each observational group (totally there are 7 groups, separated by long observational gaps) are combined to produce alternative lightcurves, as also shown in Fig. 4. The flux tends to drop smoothly during the first years since 2003 and then to raise in the following years. A search for the flux variability on shorter time scales (4 days bins) resulted in two interesting episodes (see Fig. 5). In the first episode, the flux drops by a factor of about 6 on a time scale of about 20 days, while in the second episode (this one has low significance), the flux changed by a factor 2 on time scale of 8 days. Such excess in flux, although weak, is indicated as well in the energy bands of 20-40 keV and 40-100 keV. However, these episode events might be regarded only as hints for flux variability and the statistics is not sufficient to investigate in details these episodes.
SWIFT/BAT provides a daily lightcurve in the keV energy band since February 2005. However, large error bars, mainly due to systematics, prevent us from inferring trends in flux evolution. Therefore, the data are combined in -days bins and the resulted lightcurve shows three time zones with persistent flux excess (see Fig. 2). Accordingly, the observations are divided again into 6 parts, over which the weighted average in flux are shown in Fig.2. This lightcurve suggests that PKS is rather variable at the hard X-rays on the time scale of months.
The lightcurves from COMPTEL ( MeV, time period ) and EGRET ( MeV, time period ) are shown in Fig. 6, with each bin presenting the average of one CGRO satellite observing phase. These lightcurves indicate that PKS is likely to have persistent emission over years at rays.
4 Broad-band energy spectrum
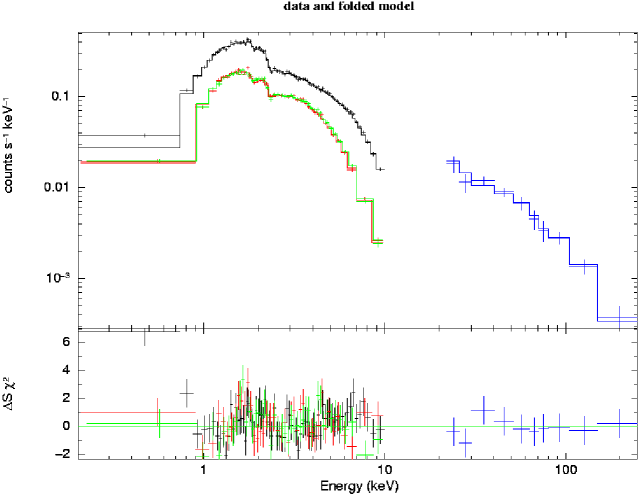
We performed a joint fit of the XMM-Newton/INTEGRAL data. The results are shown in Table 6 and Fig. 7. The source luminosity in the keV energy band is calculated as erg s-1. We note that the fit by a simple power-law model () results in a reduced under dofs. Therefore, the broken power-law model results to be again the best fit model, with an improvement with respect to the single power-law model % as calculated with the F-test.
At MeV energies the spectrum can be well represented ( for dof) by a single power-law model with measured from COMPTEL data combined from CGRO phases 1-4. This spectrum is then used in the followings to compare with the simultaneous EGRET one in the MeV energy band (Hartman et al. 1999).
Fig. 8 shows the high-energy broad-band spectrum for the results derived in this paper, including the data from XMM-Newton and INTEGRAL to cover the soft/hard X-rays ( keV) energy band; from COMPTEL for the -rays ( MeV); and from EGRET for the rays in the MeV energy band (Hartman et al. 1999). We considered the EGRET and COMPTEL spectra obtained simultaneously in phases , because they were co-aligned in pointing onboard CGRO.
In such a broad-band view, the power output of PKS shows a bump located at MeV energies, as expected in the common view of a high-luminosity blazar, where the high-energy part of the spectral energy distribution (SED) is due to inverse-Compton emission from the relativistic electrons in a jet scattering of seed photons coming from a source external to the jet (broad-line region, accretion disk,…; see Fossati et al. 1998, Ghisellini et al. 1998, Maraschi et al. 2008).
5 Discussion and summary
The most interesting feature in the broad-band high-energy spectrum of PKS is the spectral flattening below keV. Such a flattening has been observed also by De Rosa et al. (2005) in the combined Chandra/INTEGRAL spectrum, but the best fit model proposed is a single power-law with extending over the entire keV band absorbed by cold gas from the intervening galaxy at , with column density cm-2. Instead, in the present work, by analyzing a spectrum covering a wider energy range ( keV), we have shown evidence of a photon deficit at low energies in addition to the absorption from the intervening galaxy, confirming and extending the results obtained with XMM-Newton only ( keV) reported by Foschini et al. (2006). This low-energy photon deficit can be best fit with a power-law harder () than the one at energies greater than keV ().
This low-energy photon deficit has been often observed in high-redshift flat-spectrum radio quasars (Fiore et al. 1998; Worsley et al. 2004). According to Fiore et al. (1998), the photoelectric absorption intrinsic to the quasar is likely to be the origin of these low-energy roll-off. However, in the case of PKS , the tests performed to fit with a ionized absorber the low-energy data gave worst results (see Sect. 2.2). The broken power-law is statistically required and this suggests that the spectral break is likely to be due to the intrinsic curvature of the spectrum near the low-energy end of the External-Compton (EC) component, while the relative importance of the Synchrotron Self-Compton (SSC) component is likely to decrease due to the increasing importance of the external (broad-line region, accretion disk, other) radiation field (Tavecchio et al. 2007; Ghisellini et al. 2007).
However, in the case of PKS , the gravitational lensing should have an impact on the spectral and variability properties of the source, but it is not clear how to weight it at high-energy. These effects in the -ray band on distant blazars have been discussed by Combi & Romero (1998) and Torres et al. (2002, 2003). The observed hard X-rays and, probably the soft X-rays as well, are the combination of the contributions from SSC and EC, which in turn are generated from different places. Therefore, the lensing can act differently, resulting in changes in spectral shape.
We can also probe further on the possible intrinsic spectrum and the amplification factor corresponding to different part of the energy spectrum of PKS . We assume that, apart from the absorptions in Table 6 due to the Galactic column and the intervening system, the spectral break and roll-off in spectrum at low energies is caused by the difference in amplification factor. Therefore, we take as the intrinsic spectrum of PKS the power law with from to keV. We extend this value to low energies, calculate the flux in the keV energy band and compare to the observed one. The ratio of the amplification factor at energies between below and above keV is estimated by the value around . This value appears to be too low, as it is expected that the amplification factor increases with the energy and, so far, the available modelings of the magnification factor from radio/optical observations is in the range (Nair et al. 1993, Swift et al. 2001, Courbin et al. 2002).
The time variability analysis could offer another way to try estimating the impact of the gravitational lensing. PKS is known to be radio variable on time scales of months (Steppe et al. 1993). Other estimations of time scales are of days (van Ommen et al. 1995) or days (Lovell et al. 1998). In modelling PKS by Subrahmanyan et al. (1990), the time lag between the two main components (NE and SW) is expressed as days, where is the redshift of the lensing galaxy, is the Hubble constant in units of km s-1 Mpc-1. By setting the lensing galaxy at , and km s-1 Mpc-1, we have the time lag of the order of days. Therefore, the time lag between the two core components might be in the range days.
The hard X-ray variability displayed in the lightcurves of INTEGRAL/ISGRI in the keV band and of SWIFT/BAT in the keV band is quite beyond this range. The source flux can vary by a factor of on time scales of months to year and the relatively poor statistics prevent us from establishing convincing evidences of the flux variability on shorter time scales. The observed variability might be the result of the evolutions either of the relativistic jet plasma or the inverse-Compton-scattered soft target photons. It might be that, by given a steady jet plasma, the soft target photons have the density evolving over months to year, which cause the long term variability showing up at hard X-rays. De Rosa et al. (2005) reproduced the SED of PKS 1830-211 with a SSC+EC model, where the EC component was dominated by photon field from the torus. This scenario could fit with the observed hard-X ray variability on a year time scale, when this variability is attributed to the evolution of the soft photons target density. However, we point out that the SED built by De Rosa et al. (2005) has been corrected at high-energy by the amplification factor due to the gravitational lensing, which in turn is affected by large uncertainties, as we have already underlined. One of the main result of the amplification is to change the luminosity of the seed photon source and, therefore, the conclusions by De Rosa et al. (2005) could be severely biased by the not fully justified assumption of the amplification factor correction. A possible measurement of a time lag at hard X-rays in the future may help to resolve the contribution, if any, of the core region to the jet dominated emission.
An indication might be that, as already pointed out in De Rosa et al. (2005), PKS is actually another blazar to have persistent MeV emissions, which are always detectable by COMPTEL. The other two COMPTEL blazars which own MeV emission be visible over years are 3C (Collmar et al. 2000) and 3C (Zhang et al. 2005). Such a long-term steady MeV emission has been discussed in Zhang et al. (2005) for 3C , in the framework of leptonic multicomponent models where the MeV emission might be dominated by EC of seed photons coming directly from the accretion disk. The bulk Lorentz factor is argued to keep at a relatively high level to maintain the MeV emission visible over the time scale of years. In the case of PKS , such a bulk Lorentz factor has been estimated to be about by Foschini et al. (2006), where – given the uncertainties of the lensing at high-energies – the modelling of the SED was performed on the observed data, without any correction.
In summary, we presented here the most updated broad-band high-energy spectrum of PKS . The source presents a low-energy roll-off that can be explained efficiently in term of natural interplay between SSC and EC, as shown in other high-z FSRQ. However, it is not clear what is the weight of the amplification factor due to the gravitational lensing. Future observations at X-rays with higher spatial resolution should allow us to measure this factor.
References
- Barthelmy et al. (2005) Barthelmy, S.D., Barbier, L.M., Cummings, J.R., et al. 2005, Space Sci. Rev., 120, 143
- Bassani et al. (2006) Bassani, L., Molina, M., Malizia, A., , et al. 2006, ApJ, 636, L65
- Beckmann et al. (2006) Beckmann, V., Gehrels, N., Shrader, C., R., et al. 2006, ApJ, 638,642
- Bloemen et al. (1994) Bloemen, H., Hermsen, W. & Swanenburg, B. N., 1994, ApJS, 92, 419
- Burrows et al. (2005) Burrows, D.N., David, N., Hill, J.E., et al. 2005, Space Sci. Rev., 120, 165
- Collmar, W. (2006) Collmar, W. 2006, ASPC, 350, 120
- Collmar et al. (2000) Collmar, W., Reimer, O., Bennett, K., et al. 2000, A&A, 354, 513
- Combi & Romero (2000) Combi J.A. & Romero G. E. 1998, A&AS 128, 423
- Courbin et al. (2002) Courbin, F., Meylan, G., Kneib, J.P., & Lidman, C. 2002, ApJ, 575, 95
- de Boer et al. (1992) de Boer, H., Bennett, K., den Herder, H., et al. 1992, in Data Analysis in Astronomy IV, ed. V. Di Gesù, L. Scarsi, R. Buccheri, et al. (New York: Plenum Press), 241
- de Rosa et al. (2005) De Rosa, A., Piro, L., Tramacere, A., et al. 2005, A&A, 438, 121
- Fiore et al. (1998) Fiore, F., Elvis, M., Giommi, P. & Padovani, P., 1998, ApJ, 492, 79
- Foschini et al. (2006) Foschini, L., Ghisellini, G., Raiteri, C.M., et al. 2006, A&A, 453, 829
- Fossati et al. (1998) Fossati, G., Maraschi, L., Celotti, A., Comastri, A. & Ghisellini, G., 1998, MNRAS, 299, 433
- Gehrels et al. (2004) Gehrels, H., Chincarini, G., Giommi, P., et al. 2004, ApJ, 611, 1005
- Ghisellini et al. (1998) Ghisellini, G., Celotti, A., Fossati, G., Maraschi, L. & Comastri, A., 1998, MNRAS, 301, 451
- Ghisellini et al. (2007) Ghisellini, G., Foschini, L., Tavecchio, F. & Pian, E. 2007, MNRAS, 382, L82
- Goldwurm et al. (2003) Goldwurm, A., David, P., Foschini, L., et al., 2003, A&A, 411, L223
- Hartman et al. (1999) Hartman, R. C., Bertsch, D. L., Bloom, S. D., et al., 1999, ApJS, 123, 79
- Kalberla et al. (2005) Kalberla, P. M. W., et al., 2005, A&A, 440, 775
- Jauncey et al. (1991) Jauncey, D. L., Reynolds, J. E., Tzioumis, A. K., et al. 1991, Nature, 352, 132
- Lebrun et al. (2003) Lebrun, F., Leray, J.P., Lavocat, P., et al. 2003, A&A, 411, L141
- Lovell et al. (1998) Lovell, J. E. J., Jauncey, D. L., et al. 1998, ApJ, 508, 51
- Lund et al. (2003) Lund, N., Budtz-Jørgensen, C., Westergaard, N.J., et al. 2003, A&A, 411, L231
- Maraschi et al. (2008) Maraschi, L., Ghisellini, G., Tavecchio, F., Foschini, L. & Sambruna, R. M., 2008, Proceedings of the Conference “High-Energy Processes in Relativistic Outflows”, Dublin, September 2007 (arXiv.org:0802.1789)
- Mas-Hesse et al. (2003) Mas-Hesse, J.M., Giménez, A., Culhane, J.L., et al. 2003, A&A, 411, L261
- Mathur et al. (1997) Mathur, S., & Nair, S., 1997, ApJ, 484, 140
- Nair et al. (1993) Nair, S., Narasimha, D., & Rao, A. P., 1993, ApJ, 407, 46
- Oshima et al. (2001) Oshima, T., Mitsuda, K., & Ota, N., et al. 2001, ApJ, 551, 929
- Pramesh Rao & Subrahmanyan (1988) Pramesh Rao A. & Subrahmanyan R., 1988, MNRAS 231, 229
- Roming et al. (2005) Roming, P.W.A., Kennedy, T.E., Mason, K.O., et al. 2005, Space Sci. Rev., 120, 95
- Schneider et al. (1992) Schneider, P., Ehlers, J. & Falco, E.E., 1992, Gravitational lenses, Springer: New York
- Schönfelder et al. (1993) Schönfelder, V., Bennett, K., Bloemen, H., et al. 1993, ApJS, 86, 657
- Spergel et al. (2007) Spergel, D.N., Bean, R., et al. 2007, ApJS, 170, 377
- Steppe et al. (1993) Steppe, H., Paubert, G., & Sievers, A., 1993, A&AS, 102, 611
- Struder et al. (2001) Strüder, L., Briel, U., Dennerl, K., et al., 2001, A&A, 365, L18s
- Subrahmanyan et al. (1990) Subrahmanyan, R., Narasimha, D., Rao, A., & Swarup, G., 1990, MNRAS, 246, 263
- Swift et al. (2001) Swift, J.J., Welch, W.J. & Frye, B.L., 2001, ApJ, 549, L29
- Tavecchio et al. (2007) Tavecchio, F., Maraschi, L., Ghisellini, G., et al. 2007, ApJ, 665,980
- Torres et al. (2002) Torres, D. F., Romero, G. E. & Eiroa, E., 2002, ApJ, 569, 600
- Torres et al. (2003) Torres, D. F., Romero, G. E., Eiroa, E. F., Wambsganss, J., & Pessah, M. E., 2003, MNRAS, 339, 335
- Turner et al. (2001) Turner, M.J., Abbey, A., Arnaud, M., et al., 2001, A&A, 365, L27
- Ubertini et al. (2003) Ubertini, P., Lebrun, F., Di Cocco, G., et al., 2003, A&A, 411, L131
- van Ommen et al. (1995) van Ommen, T. D., & Jones, D. L., 1995, ApJ, 444, 561
- Vedrenne et al. (2003) Vedrenne, G., Roques, J.-P., Schönfelder, V., et al., 2003, A&A, 411, L63
- Walsh et al. (1979) Walsh, D., Carswell, R. F., & Weymann, R. J., 1979, Nature, 279, 381
- Worsley et al. (2004) Worsley, M.A., Fabian, A.C., Turner, A.K., Celotti, A., Iwasawa, K., 2004, MNRAS, 350, 207
- Zhang et al. (2005) Zhang, S., Collmar, W., Schönfelder, V., 2005, A&A, 444, 767
| Revolution ID | MJD | Number of SCW | Exposure (ks) |
|---|---|---|---|
| 050-065 | 52710-52767 | 138 | 250.9 |
| 105-122 | 52875-52927 | 247 | 585.1 |
| 164-186 | 53052-53119 | 108 | 205.9 |
| 225-249 | 53234-53305 | 161 | 388.3 |
| 286-310 | 53417-53488 | 97 | 192.1 |
| 348-371 | 53602-53672 | 209 | 609.1 |
| 407-432 | 53777-53854 | 135 | 266.1 |
| ID | Date | MJD | Object | Offset angle | Exposure∗ |
|---|---|---|---|---|---|
| (dd/mm/yy) | arcsecond | ks | |||
| 0204580201 | 10/03/2004 | 53074 | PKS 1830-211 | 1.1 | 3,7,7 |
| 0204580301 | 24/03/2004 | 53088 | PKS 1830-211 | 1.1 | 27,31,31 |
| 0204580401 | 05/04/2004 | 53100 | PKS 1830-211 | 1.1 | 13,19,19 |
-
∗
Effective exposure on PN, MOS1, and MOS2, respectively, after having removed periods with high background.
| Redshifted Power-Law | |||||||
|---|---|---|---|---|---|---|---|
| ObsID | /dof | ||||||
| Broken Power-Law | |||||||
| ObsID | /dof | ||||||
| Broken Power-Law (average)∗ | |||||||
| Log-parabola | |||||||
| ObsID | /dof | ||||||
-
∗
The average spectrum has been rebinned in order to have at least counts per bin. The PN has been considered as reference detector and the intercalibration constants are: MOS1/PN and MOS2/PN.
| VP | Date | MJD | Object | Offset angle | CGRO Phase |
| (dd/mm/yy) | |||||
| 5.0 | 12/07/91-26/07/91 | 48449-48463 | Gal. Center | 12∘ | Phase I |
| 7.5 | 15/08/91-22/08/91 | 48483-48490 | Gal 025-14 | 15∘ | |
| 13.0 | 31/10/91-07/11/91 | 48560-48567 | GAL 025-14 | 15∘ | |
| 16.0 | 12/12/91-27/12/91 | 48602-48617 | SCO X-1 | 29∘ | |
| 20.0 | 06/02/92-20/02/92 | 48658-48672 | SS 433 | 28∘ | |
| 27.0 | 28/04/92-07/05/92 | 48740-48749 | 4U 1543-47 | 41∘ | |
| 35.0 | 06/08/92-11/08/92 | 48840-48845 | ESO 141-55 | 41∘ | |
| 38.0 | 27/08/92-01/09/92 | 48861-48866 | ESO 141-55 | 41∘ | |
| 42.0 | 15/10/92-29/10/92 | 48910-48924 | PKS 2155-304 | 40∘ | |
| 43.0 | 29/10/92-03/11/92 | 48924-48929 | MRK 509 | 29∘ | |
| 209.0 | 09/02/93-22/02/93 | 49027-49040 | 2CG010-31 | 30∘ | Phase II |
| 210.0 | 22/02/93-25/02/93 | 49040-49043 | Gal. Center | 20∘ | |
| 214.0 | 29/03/93-01/04/93 | 49075-49078 | Gal. Center | 20∘ | |
| 219.4 | 05/05/93-06/05/93 | 49112-49113 | Gal. Center | 31∘ | |
| 223.0 | 31/05/93-03/06/93 | 49138-49141 | Gal. Center | 14∘ | |
| 226.0 | 19/06/93-29/06/93 | 49157-49167 | Gal. 355+5 | 20∘ | |
| 231.0 | 03/08/93-10/08/93 | 49202-49209 | NGC 6814 | 12∘ | |
| 229.0 | 10/08/93-11/08/93 | 49209-49210 | Gal. 5+05 | 13∘ | |
| 229.5 | 12/08/93-17/08/93 | 49211-49216 | Gal. 5+05 | 13∘ | |
| 232.0 | 24/08/93-26/08/93 | 49223-49225 | Gal. 348-00 | 25∘ | |
| 232.5 | 26/08/93-07/09/93 | 49225-49237 | Gal. 348-00 | 25∘ | |
| 302.3 | 09/09/93-21/09/93 | 49239-49251 | GX 1+4 | 18∘ | Phase III |
| 323.0 | 22/03/94-05/04/94 | 49433-49447 | Gal. 357-112 | 16∘ | |
| 324.0 | 19/04/94-26/04/94 | 49461-49468 | Gal. 016+05 | 12∘ | |
| 330.0 | 10/06/94-26/04/94 | 49513-49517 | Gal. 018+00 | 8∘ | |
| 332.0 | 18/06/94-05/07/94 | 49521-49538 | Gal. 018+00 | 8∘ | |
| 334.0 | 18/07/94-25/07/94 | 49551-49558 | Gal. 009-08 | 4∘ | |
| 336.5 | 04/08/94-09/08/94 | 49568-49573 | GRO J1655-40 | 33∘ | |
| 338.0 | 29/08/94-31/08/94 | 49593-49595 | GRO J1655-40 | 28∘ | |
| 339.0 | 20/09/94-04/10/94 | 49615-49629 | 3C 317 | 47∘ | |
| 414.3 | 29/03/95-04/04/95 | 49805-49811 | GRO J1655-40 | 26∘ | Phase IV |
| 421.0 | 06/06/95-13/06/95 | 49874-49881 | Gal. Center | 18∘ | |
| 422.0 | 13/06/95-20/06/95 | 49881-49888 | Gal. Center | 18∘ | |
| 423.0 | 20/06/95-30/06/95 | 49888-49898 | Gal. Center | 11∘ | |
| 423.5 | 30/06/95-10/07/95 | 49898-49908 | PKS 1622-297 | 32∘ | |
| 429.0 | 20/09/95-27/09/95 | 49980-49987 | GAL 018+04 | 11∘ | |
| 501.0 | 03/10/95-17/10/95 | 49993-50007 | GAL 28+4 | 18∘ | Phase V |
| 508.0 | 14/12/95-20/12/95 | 50065-50071 | GAL 5+0 | 9∘ | |
| 509.0 | 20/12/95-02/01/96 | 50071-50084 | GAL 21+14 | 21∘ | |
| 513.0 | 06/02/96-13/02/96 | 50119-50126 | PKS 2155-304 | 47∘ | |
| 516.1 | 18/03/96-21/03/96 | 50160-50163 | GRO J1655-40 | 33∘ | |
| 520.4 | 21/05/96-28/05/96 | 50224-50231 | PKS 2155-304 | 47∘ | |
| 524.0 | 09/07/96-23/07/96 | 50273-50287 | GX 339-4 | 29∘ | |
| 529.5 | 27/08/96-06/09/96 | 50322-50332 | GRO J1655-40 | 28∘ | |
| 624.1 | 04/02/97-11/02/97 | 50483-50490 | Gal 16+00 | 10∘ | Phase VI |
| 619.2 | 14/05/97-20/05/97 | 50582-50588 | GRS 1915+105 | 35∘ | |
| 620.0 | 10/06/97-17/06/97 | 50609-50616 | Gal 16+04 | 10∘ | |
| 625.0 | 05/08/97-19/08/97 | 50665-50679 | GRS 1758-258 | 13∘ | |
| 615.1 | 19/08/97-26/08/97 | 50679-50686 | PKS 1622-297 | 30∘ |
| Period | MJD | Flux (10-5 ph cm-2 s-1) | |||
| 0.75-1 MeV | 1-3 MeV | 3-10 MeV | 10-30 MeV | ||
| Phase 1-6 | 48392-50539 | 4.91.4 | 7.61.4 | 1.50.6 | 0.40.3 |
| wabs | zwabs | bknpow | |||||
|---|---|---|---|---|---|---|---|
| /dof | |||||||
| (fix) | (fix) | ||||||