Taxonomy of GRB optical light-curves: identification of a salient class of early afterglows
Abstract
The temporal behaviour of the early optical emission from Gamma-Ray Burst afterglows can be divided in four classes: fast-rising with an early peak, slow-rising with a late peak, flat plateaus, and rapid decays since first measurement. The fast-rising optical afterglows display correlations among peak flux, peak epoch, and post-peak power-law decay index that can be explained with a structured outflow seen off-axis, but the shock origin (reverse or forward) of the optical emission cannot be determined. The afterglows with plateaus and slow-rises may be accommodated by the same model, if observer location offsets are larger than for the fast-rising afterglows, or could be due to a long-lived injection of energy and/or ejecta in the blast-wave. If better calibrated with more afterglows, the peak flux – peak epoch relation exhibited by the fast and slow-rising optical light-curves could provide a way to use this type of afterglows as standard candles.
keywords:
radiation mechanisms: non-thermal - shock waves - gamma-rays: bursts1 Introduction
The ability of the Swift satellite to localize precisely Gamma-Ray Bursts (GRBs) in real-time has allowed multi-wavelength monitoring of bursts starting at tens of seconds after trigger, even before the end of the prompt gamma-ray emission phase. The new observations have shown that the optical emission from GRBs can be divided into two components: a counterpart emission that tracks the prompt gamma-rays and an afterglow emission that starts during the prompt phase or shortly after it and which dims progressively for hours or days. The former component was observed for the first time in GRB 041219A (Vestrand et al 2005), the latter was displayed by GRB afterglow 990123 during the burst (Akerlof et al 1999) and by GRB afterglow 030418 after the burst (Rykoff et al 2004). Both components are seen simultaneously in the prompt optical emission of GRB 050820A (Vestrand et al 2006).
As of the end of 2007, there are about 30 GRBs with known redshift and whose optical afterglow emission was monitored starting within a few minutes after the trigger. This set of well-sampled optical light-curves is large enough for a collective study of their properties, as was done by Akerlof & Swan (2007) and Kann et al (2007) for the early (0.1–1 ks) afterglow emission and by Liang & Zhang (2006), Nardini et al (2006), and Zeh, Klose & Kann (2006) at 1 d.
In this work, we examine the temporal properties of the early optical afterglow emission, identify a peculiar class of afterglows with initially rising optical light-curves, whose properties render them standard candles, and attempt to explain those properties in the standard theoretical framework of a relativistic blast-wave interacting with the circumburst medium (e.g. Paczyński & Rhoads 1993, Mészáros & Rees 1997).
| GRB | z | Refs | |||
| (mJy) | (s) | ||||
| (1) | (2) | (3) | (4) | (5) | |
| fast-risers | |||||
| 990123 | 1.60 | 1240(R) | 50 | 1.80 | A99,G99 |
| 050730 | 3.97 | 1.6(R) | 550 | 0.63 | P06,P07 |
| 050820A | 2.61 | 4.6(R) | 420 | 0.91 | C06,V06 |
| 060418 | 1.49 | 52(H) | 120 | 1.13 | Mo07 |
| 060607A | 3.08 | 17(H) | 160 | 1.20 | Mo07 |
| 061007 | 1.26 | 500(R) | 57 | 1.70 | Mu07,Y07b |
| slow-risers | |||||
| 060614 | 0.12 | 0.096(R) | 21000 | 1.54 | DV06,Ma07 |
| 060904B | 0.70 | 0.92(R) | 520 | 0.88 | K08 |
| 070110 | 2.35 | 0.065(V) | 5000 | 0.65 | T07 |
| 070411 | 2.95 | 0.18(R) | 0.94 | 6269-88-95 | |
| 071025 | 1.4(R) | 570 | 2.0 | 7008-11-18 | |
| fast or slow-riser (uncertain) | |||||
| 050904 | 6.29 | 4–10(J) | 1.15 | T05,Bo06,H06 | |
| decays | |||||
| 021211 | 1.01 | 3.9(R) | 110 | 1.58 | F03a,L03 |
| 050319 | 3.24 | 1.3(R) | 170 | 0.88 | W05,Q06 |
| 050401 | 2.90 | 0.69(R) | 35 | 0.80 | R05,dP06,W06 |
| 050416A | 0.65 | 0.078(R) | 115 | 0.54 | H07,S07 |
| 050525 | 0.61 | 23(R) | 66 | 1.09 | K05,Bl06 |
| 050908 | 3.34 | 0.082(R) | 380 | 0.83 | 3944-45-47-50 |
| 050922C | 2.20 | 6.3(R) | 160 | 0.70 | 4040-41-95 |
| 051109A | 2.35 | 3.4(R) | 40 | 0.67 | 4239,Y07a |
| 051111 | 1.55 | 24(R) | 32 | 0.80 | Bu06,Gu07,Y07a |
| 060927 | 5.47 | 4.2(I) | 20 | 1.01 | RV07 |
| 061121 | 1.31 | 0.97(R) | 46 | 0.61 | 5847,Y07b |
| 061126 | 1.16 | 59(R) | 23 | 1.34 | P08,Y07b |
| plateaus | |||||
| 021004 | 2.30 | 2.8(R) | 350 | 0.28 | F03b,H03 |
| 050801 | 1.56 | 4.1(R) | 25 | 0.13 | 3726-33,dP07 |
| 060124 | 2.30 | 1.0(R) | 180 | R06,Mi07 | |
| 060210 | 3.91 | 0.19(R) | 95 | 0.13 | C07 |
| 060714 | 2.71 | 0.18(R) | 300 | 0.17 | 5434,K07 |
| 060729 | 0.54 | 0.34(W1) | 78 | 0.15 | Gr07,Y07b |
(1): burst redshift, was assumed for GRB 071025, as it was a -band dropout (GCN 7011), which implies a photometric redshift ; (2): peak flux for fast- and slow-rising afterglows or flux at the first measurement for the other types; corrected for Galactic dust extinction and in the optical band indicated in parenthesis; uncertainty of peak flux is usually 5–15 percent; (3): epoch of the optical light-curve peak for fast and slow risers or epoch of first measurement for the rest; uncertainty of peak time is 10–40 percent; (4): index of the optical flux power-law decay during the early afterglow (); for rising afterglows, this is the decay after the peak; uncertainties are around 0.05; (5): References for optical data used in this article – GCN Circulars: 3726 (Rykoff et al), 3733, (Blustin et al), 3944 (Cenko et al), 3945 (Li), 3947 (Kirschbrown et al), 3950 (Durig et al), 4040 (Fynbo et al), 4041 (Hunsberger et al), 4095 (Li et al), 4239 (Woźniak et al), 5434 (Asfandyarov et al), 5847 (Halpern et al), 6269 (Rykoff et al), 6288 (Mikuz et al), 6295 (Kann et al), 7008 (Wren et al), 7011 (Milne & Williams), 7018 (Minezaki et al).
2 Rising optical light-curves
The GRB afterglows with early optical coverage used in this work are listed in Table 1. To facilitate the comparison of the light-curve properties, we have -corrected the observed optical flux of those GRBs to a fiducial redshift of and same observing frequency Hz (corresponding to 2 eV, i.e. the -band)
| (1) |
where is the burst redshift, the luminosity distance, assuming an optical spectrum with , which is typical for the optical emission at day of pre-Swift afterglows. We note that an error of 0.25 in the optical spectral slope yields an error of less than 20 percent in the -corrected optical flux.
Optical fluxes were corrected for Galactic extinction. Evidence for a substantial host extinction exists for GRB afterglows 050401 (Watson et al 2006), 050525 (Blustin et al 2006), 060927 (Ruiz-Velasco et al 2007), 061007 (Mundell et al 2007, Schady et al 2007), and 061121 (Page et al 2007), whose optical spectrum is with , redward of intergalactic Ly absorption. By assuming a simple reddening curve for the dust in the host galaxy, , we have estimated the host extinction in the host-frame -band from the observed spectral slope and the assumed intrinsic slope (0.75): , and have correct the optical fluxes of GRB afterglows 050401, 050525, 060927, 061007, and 061121 for host-extinction of 0.3, 0.6, 0.2, 0.5, 0.3 mag, respectively.
The resulting optical light-curves are shown in Figure 2. Even after
redshift and host extinction corrections, the optical fluxes at any fixed
time span a range of at least 2–3 orders of magnitude, displaying a well-defined
boundary on the bright side which, obviously, is not an observational selection effect.
Based on the optical light-curve behaviour at s after trigger, the afterglows
shown in Figure 2 can be separated in four groups:
(i) 6 fast-rising (), peaking at about 100 s,
(ii) 5 slow-rising (), peaking after 100 s,
(ii) 12 with fast decays () since first measurement
(at about 100 s),
(iv) 6 with plateaus (), lasting for 1–2 decades in time.
Evidently, the last two types of afterglow had a fast or slow rise to their peaks, which occurred before the first observation. The afterglows with plateaus represent a separate class based on their slow post-peak decay, however the afterglows with decays have post-peak power-law decays () of exponents comparable with those of the slow and fast-rising afterglows (Table 1), hence their classification stems (so far) only from that their peak epochs were earlier than for the rising afterglows.
The fast-rising afterglows define a family of curves (shown with light-blue lines in Figure 2) that roughly delineate the high-brightness boundary mentioned above. In addition to peaking sufficiently late (around 100 s after trigger), thereby allowing robotic telescopes to catch their rise, the fast-rising afterglows display other peculiar features which suggest that they represent a distinct class. As shown in Figure 2, their luminosity distribution is substantially narrower than for the other types of afterglows.
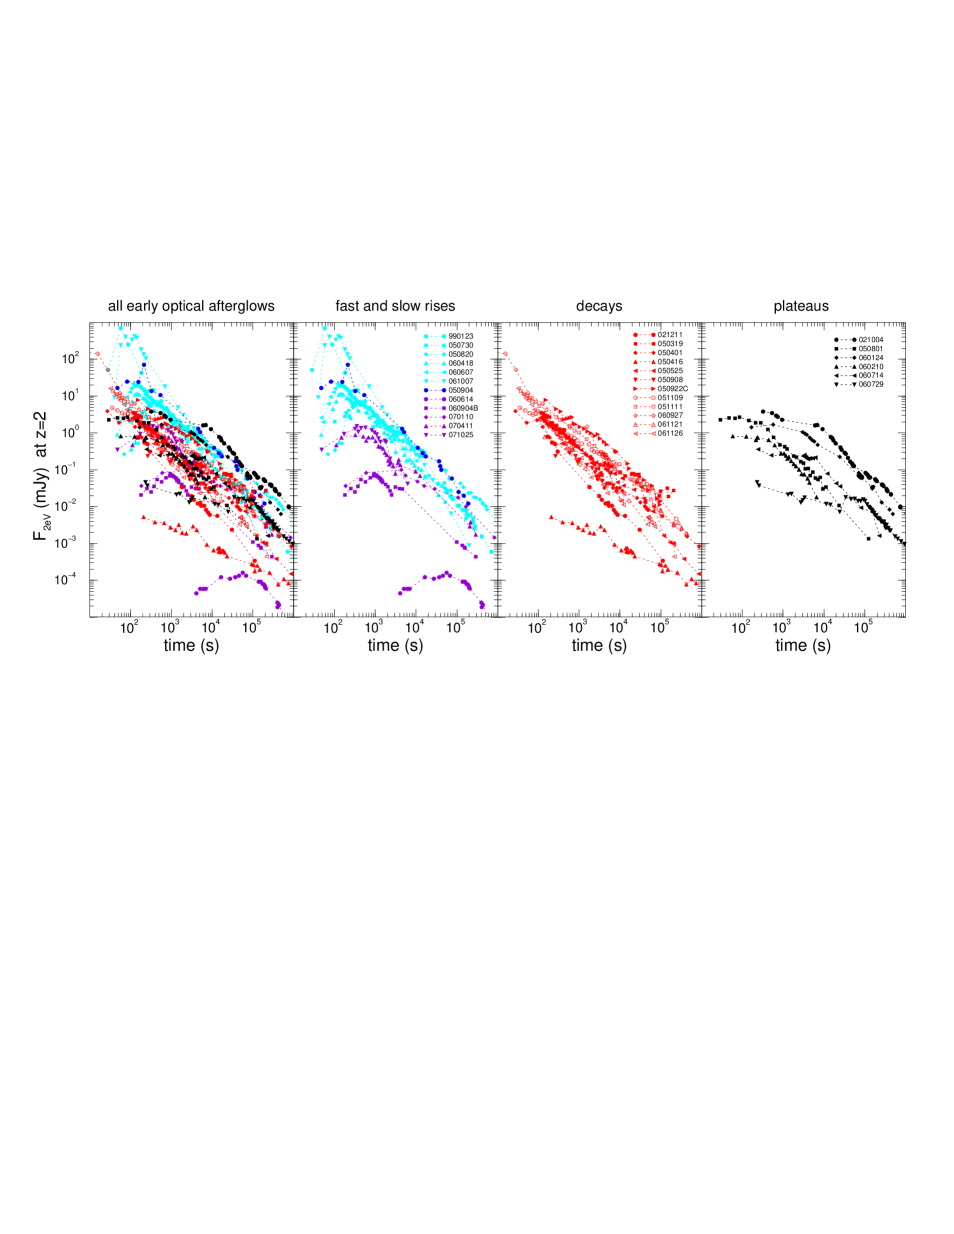
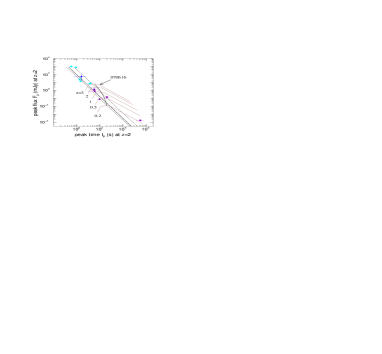
Figure 4 illustrates another intriguing feature of the fast-rising optical afterglows: an anti-correlation of the peak flux () and peak epoch () with a linear correlation coefficient , corresponding to less than 3 percent probability to obtain by chance a correlation stronger than that. The 5 afterglows with slow-rises are consistent with that correlation; if added, we obtain for 11 afterglows with rising (slow or fast) optical light-curves that (probability of a stronger chance correlation is less than )∗*∗*Without GRB 060614, whose latest and dimmest peak lies farther from the other 10 afterglows (see Figure 4), and the chance correlation probability is less than and a best fit
| (2) |
where the uncertainties of the two coefficients were calculated for the joint variation of them.
If confirmed and better calibrated with a larger set of rising optical afterglows, this correlation may allow the estimation of afterglow redshifts based on properties of the optical light-curve. As shown in Figure 4, the current uncertainty of the peak flux – peak time relation (dotted lines) is a bit too large to set a strong constraint on the burst redshift: the peak of the optical light-curve of GRB afterglow 070616 falls within the uncertainty of the relation for .
Another feature of the fast-rising afterglows which may prove to be a ”standard candle” is their luminosity at 0.5–5 ks. At , the -band optical flux of 5 of the 6 afterglows with such rises is mJy, which corresponds to a source-frame -band luminosity
| (3) |
Given the large spread in peak flux for the fast-rising afterglows, the relatively narrow distribution of their optical luminosity at 1 ks arises from the post-peak power-law decay index being correlated with the peak flux: (less than 0.5 percent chance correlation).
It remains to be tested with a larger sample of afterglows if the rising afterglows
represent a standard candle through either their anticorrelation or the
optical luminosity at ks of the afterglows peaking before 1 ks.
For the remainder of this article, we attempt to provide an explanation for the above
properties of the rising optical light-curves. To that end, we search for a model that
accommodates the following features:
(i) a fast optical rise,
(ii) a peak flux of 1–1000 mJy at peak time 0.1–1 ks,
(iii) a later peak epoch for a smaller peak flux,
(iv) a faster post-peak decay for a brighter peak.
3 Afterglow blast-wave models
The power-law decay displayed by GRB afterglow light-curves suggests that they originate from a relativistic blast-wave decelerated by its interaction with the ambient medium. The continuous transfer of energy to the swept-up medium decreases the blast-wave’s Lorentz factor as a power-law with radius which, together with the power-law energy spectrum of particles accelerated at shocks (either the reverse-shock propagating in the incoming ejecta or the forward-shock energizing the ambient medium), yield power-law decaying light-curves () without any additional assumptions for the forward-shock emission, but requiring an extra feature (a power-law ejecta mass distribution with Lorentz factor) for the reverse-shock emission.
We identify features of the forward- and reverse-shock models that may account
for the properties of the fast-rising afterglows and the diversity of early
optical light-curves by calculating numerically the afterglow emission.
The numerical model has the following components:
calculation of the dynamics of the two shocks, with allowance for the angular
distribution of the ejecta kinetic energy & initial Lorentz factor and for
energy injection. After deceleration, the dynamics of the forward-shock is the
Blandford-McKee solution. The Lorentz factor of the reverse-shock, as measured
in the frame of the incoming ejecta, is determined from the Lorentz factor of
those ejecta and that of the shocked gas,
setting the electron power-law distribution with energy, taking into account
radiative losses, which yield a cooling break frequency. The total electron energy
is quantified by the fraction of the post-shock energy imparted
to them. Similarly, the magnetic field energy is quantified by the fractional
energy stored in it,
calculation of the peak synchrotron flux from the number of radiating electrons
behind each shock and the magnetic field strength, and of the spectral breaks:
self-absorption frequency, characteristic synchrotron frequency
for typical electron energy, cooling frequency (including also
inverse-Compton cooling of electrons),
integration of the synchrotron emission over the evolution of each shock,
taking into account geometrical-curvature and relativistic effects.
The theoretical formalism describing the above calculations can be found in e.g.
Mészáros & Rees (1997), Sari, Piran, & Narayan (1998), Wijers & Galama (1999),
Panaitescu & Kumar (2000, 2001).
3.1 Forward-shock emission
3.1.1 Isotropic outflow – pre-deceleration phase
An isotropic outflow or a jet seen face-on can yield rising (synchrotron emission) light-curves after the forward-shock deceleration starts, however a fast rise () is obtained only at observing frequencies below the synchrotron self-absorption frequency , the next fast rise at being , which is too slow to explain the rising optical afterglows. The simplest test of optical being below is to measure the slope of the spectral energy distribution () of early optical afterglows. This test requires multiband follow-up of the optical afterglow during the light-curve rise, i.e. during the first few minutes after trigger. Few such observations are available: for GRB afterglow 060418, we find that before the light-curve peak epoch while for GRB afterglow 060607A at the peak epoch. These spectral slopes are inconsistent with the expected below , hence the fast-rising optical afterglows do not arise from an isotropic, decelerating outflow. Furthermore, the measured early optical spectral slopes indicate that the optical domain is above the peak of the spectrum as early as a few hundred seconds after trigger.
Instead, a fast-rising forward-shock emission light-curve can be obtained before the onset of that shock’s deceleration, defined by the reverse-shock crossing the shell of relativistic ejecta.
For an comoving-frame ejecta density smaller than , where is the ejecta initial Lorentz factor and the ambient medium proton density, the reverse-shock is relativistic and the shell-crossing time is set by the thickness of the ejecta. In this case, if the ejecta are uniform (i.e. their density does not vary with geometrical depths) the forward-shock Lorentz factor decreases slowly before the reverse-shock crosses the ejecta shell, leading to a slowly rising forward-shock light-curve: for a homogeneous medium and for a wind medium.
If the comoving-frame ejecta density is larger than , the reverse-shock is semi-relativistic and, when the reverse-shock crosses the ejecta shell, the forward-shock has swept-up an ambient medium mass equal to a fraction of the ejecta mass, hence the deceleration timescale is set by the ejecta Lorentz factor. If the ejecta are uniform then, prior to deceleration, the forward-shock moves at constant Lorentz factor, owing to the continuous energy input from the incoming yet-unshocked ejecta. For a homogeneous medium, the pre-deceleration forward-shock light-curve rises as or (depending on the location of the cooling frequency), exactly as observed for fast-rising afterglows. For a wind medium, the fastest possible rise at a frequency above the peak of the synchrotron spectrum (as implied by the optical spectral slope of GRB afterglows 060418 and 060607A) is (), which is too slow compared to the fast-rising optical afterglows.
Thus, if the ejecta shell is uniform, a pre-deceleration forward-shock emission with a fast rise requires a homogeneous circumburst medium and a semi-relativistic reverse-shock. These conditions may be relaxed if the ejecta kinetic energy increases with geometrical depth, in which case the energy of the shocked gas may increase faster than linearly with time, the forward-shock may be accelerated and the pre-deceleration forward-shock emission may exhibit a sharp rise even for a wind-like medium or a relativistic reverse-shock.
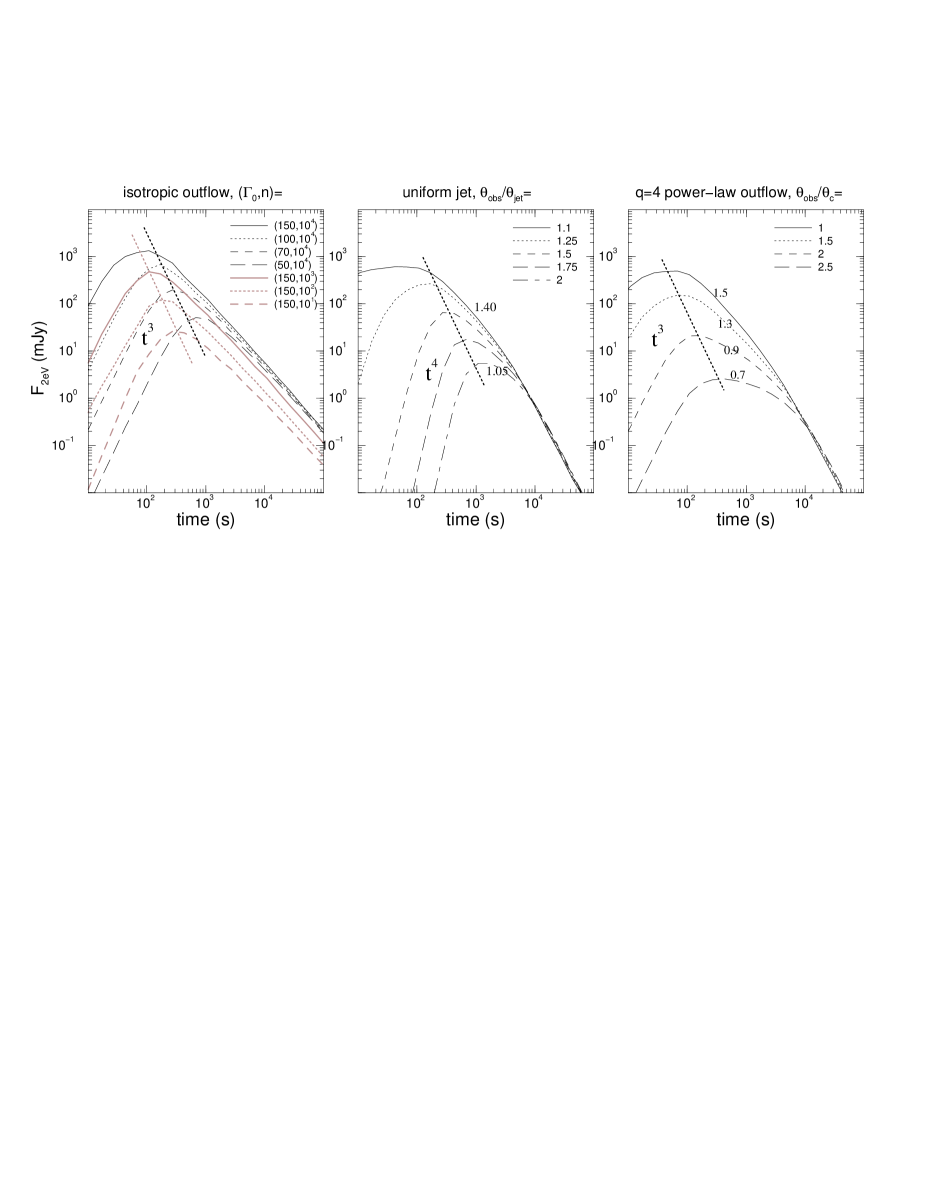
The pre-deceleration forward-shock light-curves obtained for a homogeneous medium and semi-relativistic reverse-shock are shown in the left panel of Figure 6. They exhibit the expected fast rise () until the deceleration time when the peak flux is , where is the ejecta kinetic energy per solid angle and the ambient medium proton density. These dependencies show that variations of the shock energy among afterglows induce a correlation of peak flux and epoch (), while variations of the ejecta initial Lorentz factor and ambient density yield anticorrelations: and , respectively. These relations become consistent with that observed for fast-rising afterglows (equation 2) for and , respectively. However, this model cannot explain naturally the peak flux correlation with the light-curve post-peak decay index, which would require an ad-hoc correlation of the optical spectrum slope with the ejecta Lorentz factor or with the ambient density.
3.1.2 Structured outflows – off-axis observer location
A fast-rising afterglow light-curve can also be obtained from the forward-shock emission if its energy is concentrated in a core seen by the observer from a location outside the core’s opening (e.g. Panaitescu, Mészáros & Rees 1998, Granot et al 2002). In this model, the light-curve rise is caused by that, as the forward-shock is decelerated, its emission is less beamed relativistically and the cone of that emission widens.


In the extreme case of a collimated outflow with a sharp angular boundary (a jet), the light-curve rise is for a homogeneous medium (middle panel of 6) and for a wind medium (Figure 8). The latter is too slow compared to observations. A deficiency of this model is that, for observer locations that accommodate the observed range of peak times () and peak fluxes (), the resulting range of post-peak decay indices is too small.
A wider range of post-peak decays is obtained if the outflow kinetic energy has a smoother angular distribution then a top-hat. If the ejecta outside the core carry a sufficiently large kinetic energy, then their pre-deceleration emission may overshine that from the core, leading to an afterglow rise for a homogeneous external medium an a too slow for a wind. By keeping the outflow parameters unchanged and varying the observer’s location (, we obtain numerically that, for an outflow with a power-law angular distribution of kinetic energy per solid angle (, ), the range of post-peak decay indices increases with the structural parameter . For and , the resulting ranges of , and are compatible with the observations of fast-rising optical afterglows (right panel of Figure 6). In the same model, a wider range of observer offsets, , or a range of structural indices, , can account for the diversity of early optical light-curve behaviours: fast early rises, plateaus, late slow-rises. The dependence of the afterglow light-curve shape on the index is illustrated in Figure 10).
3.2 Reverse-shock emission
The reverse-shock can produce a fast-rising optical light-curve in the same ways as the forward-shock: either through the increasing number of radiating electrons, before the shock crosses the ejecta shell, or through the emergence of the relativistically beamed emission from a structured outflow seen off-axis. For brevity, we consider only the former model: the pre-deceleration emission from an isotropic outflow.
Figure 12 shows the fast-rising optical light-curves obtained for a uniform ejecta (i.e. zero radial gradient of its mass and Lorentz factor) and a semi-relativistic reverse-shock. As for the forward-shock pre-deceleration emission, the peak flux – peak time relation observed for the fast-rising optical light-curves is better accommodated if the circumburst medium density is not universal.
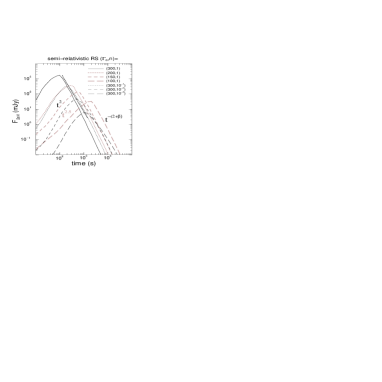
The temporal behaviour of the pre-deceleration reverse-shock light-curve depends on the radial distribution of ejecta mass and Lorentz factor. The former sets the number of electrons accelerated by the reverse-shock and, together with the Lorentz factor of the incoming ejecta, determines the comoving frame density of the incoming ejecta and the Lorentz factor the reverse-shock. Figure 14 shows that, for same microphysical parameters as for Figure 12, reverse-shock light-curves with plateaus and slow-rises can be obtained for non-uniform ejecta, where that non-uniformity is quantified by the energy which they dissipate in the shocked gas.
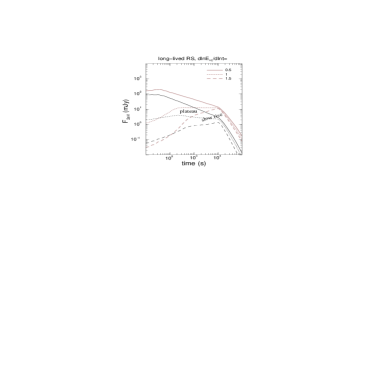
Owing to that the reverse-shock is, most likely, much less relativistic than the forward-shock during the early after phase, near equipartition magnetic fields are required for the reverse-shock optical flux to be as high as 1 Jy. Consequently, the cooling frequency of the reverse-shock emission spectrum is quite likely below optical. In this case, if the injection of ejecta were to cease at some time and the reverse shock to disappear, then the rapid electron radiative cooling would quickly bring their synchrotron characteristic frequency below the optical and would switch-off fast the optical emission after that time. For an isotropic outflow (or a sufficiently wide jet), the optical emission received after the reverse-shock disappears will be ”large-angle emission” released by the reverse-shock regions moving at angles , which arrives at observer later than the emission and is less enhanced by relativistic beaming.
The large-angle emission decay is thus, if the peak of the fast-rising optical light-curves were identified with the cessation of ejecta injection in the reverse-shock, then an optical spectrum or harder would be required to accommodate the post-peak decay of the fast-rising optical afterglows. Such spectra are much harder than the early optical spectrum of GRB afterglows 060418 and 060607A. Therefore, if the reverse-shock of an isotropic outflow is the origin of the early optical afterglow emission, then that shock should exist and accelerate fresh electrons even after the light-curve peak epoch and the peak should be identified with a change in the radial distribution of ejecta mass and/or Lorentz at a geometrical depth of order . In this model, the peak flux correlation with the post-peak decay index found for the fast-rising optical afterglows requires a correlation between and the radial distribution of ejecta mass or Lorentz factor at depths larger than . The alternative to this ad-hoc assumption is that the fast-rising optical afterglows are not the reverse-shock pre-deceleration emission but arise from a structured outflow seen off-axis.
4 Conclusions
The early afterglow optical light-curves exhibit diverse behaviours: a third of them display a fast or slow rise to a peak at about 100 s, a fifth have a plateau (or very slow decay) until about 10 ks, the rest exhibiting a fast decay since first measurement. The optical luminosity of the last two types of afterglows has a width of 2–3 dex, while that of the fast-rising afterglows is only 0.3 dex at 0.5–5 ks after trigger, marking the upper limit of afterglow optical luminosity (Figure 2).
Additionally, the afterglows with fast rises display a good anticorrelation of the optical light-curve peak flux with peak epoch. This correlation extends to the afterglows with slow rises, suggesting that rising afterglows represent a single class. If the dispersion in this correlation can be significantly reduced with a larger sample of rising afterglows, the peak flux - peak time correlation manifested by this class of afterglows could make it a useful standard candle.
With the aid of numerical calculations, we have attempted to identify models that account for the peculiar properties of the fast-rising afterglows: power-law index of the rise, anticorrelation, –decay index correlation.
The rise observed for those afterglows can be accommodated by either the pre-deceleration synchrotron emission from a relativistic blast-wave or by the emergence of the relativistically beamed emission from a tightly collimated outflow seen from an off-aperture location.
Before deceleration, a fast brightening of the blast-wave synchrotron emission results from the continuous increase of the number of radiating electrons – either the ambient medium electrons energized by the forward-shock or the ejecta electrons accelerated by the reverse-shock. For either shock, the anticorrelation observed for the fast-rising optical afterglows (Figure 4, equation 2) is more likely to arise from variations in the circumburst medium density among afterglows (left panel of Figure 6 and Figure 12). However, the pre-deceleration model for the optical rise does not offer a natural explanation for the correlation, as the parameters which determine the peak flux (primarily the ambient medium density) should not be correlated with those which set the light-curve decay index depends (the distribution with energy of the forward-shock electrons on the radial distribution of ejecta mass and/or Lorentz factor)
Instead, a relation compatible with observations is obtained for the synchrotron emission from a collimated blast-wave and for observer locations just outside the jet aperture (middle panel of Figure 6 and Figure 8). In this model, the rise of the afterglow light-curve is due to the cone of relativistically beamed jet emission becoming ever wider, as the jet decelerates progressively. We find that the range of post-peak light-curve decay indices measured for the fast-rising afterglows (Table 1) is better accommodated by a structured outflow endowed with a bright core and a power-law distribution of the kinetic energy per solid angle in the envelope (right panel of Figure 6).
The optical light-curves with a decay since the first measurement may also originate from structured outflows and would correspond to an observer location within the aperture of the brighter outflow core and a short deceleration timescale. In the same model, the afterglows with slow-rises and plateaus can be attributed to larger observer offsets relative to the outflow’s symmetry or to the energy per solid angle decreasing away from that axis faster than for the fast-rising light-curves (Figure 10).
Therefore, the angular structure of the relativistic outflow and variations in the observer location may account for the diversity manifested by the early optical afterglow light-curves and the correlations displayed by the fast-rising afterglows.
Acknowledgments
The authors acknowledge the great help provided by the GRB data repository site maintained by Jochen Greiner (MPE): www.mpe.mpg.de/jcg/grbgen.html
References
- 1 Akerlof C. et al, 1999, Nature, 398, 400 (A99)
- 2 Akerlof C., Swan H., 2007, ApJ, 671, 1868
- 3 Blustin A. et al, 2006, ApJ, 637, 901 (Bl06)
- 4 Boër M. et al, 2006, ApJ, 638, L71 (Bo06)
- 5 Butler N. et al, 2006, ApJ, 652, 1390 (Bu06)
- 6 Cenko S. et al, 2006, ApJ, 652, 490 (C06)
- 7 Curran P. et al, 2007, A&A, 467, 1049 (C07)
- 8 Della Valle M. et al, 2006, Nature, 444, 1050 (DV06)
- 9 Fox D. et al, 2003a, ApJ, 586, L5 (F03a)
- 10 Fox D. et al, 2003b, Nature, 422, 284 (F03b)
- 11 Galama T. et al, 1999, Nature, 398, 394 (G99)
- 12 Granot J. et al, 2002, ApJ, 570, L61
- 13 Grupe D. et al, 2007, ApJ, 662, 443 (Gr07)
- 14 Guidorzi C. et al, 2007, A&A, 463, 539 (Gu07)
- 15 Haislip J. et al, 2006, Nature, 440, 181 (H06)
- 16 Holland S. et al, 2003, AJ, 125, 2291 (H03)
- 17 Holland S. et al, 2007, AJ, 133, 122 (H07)
- 18 Kann D. et al, 2007, ApJ, submitted (arXiv:0712.2186)
- 19 Klotz A. et al, 2005, A&A, 439, L35 (K05)
- 20 Klotz A. et al, 2008, A&A, accepted (arXiv:0803.0505) (K08)
- 21 Krimm H. et al, 2007, ApJ, 665, 554 (K07)
- 22 Li W. et al, 2003, ApJ, 589, L9 (L03)
- 23 Liang E., Zhang B., 2006, ApJ, 638, L67
- 24 Mangano V. et al, 2007, A&A, 470, 105 (Ma07)
- 25 Mészáros P., Rees M.J., 1997, ApJ, 476, 232
- 26 Misra K. et al, 2007, A&A, 464, 903 (Mi07)
- 27 Molinari E. et al, 2007, ApJ, 469, L13 (Mo07)
- 28 Mundell C. et al, 2007, ApJ, 660, 489 (Mu07)
- 29 Nardini M. et al, 2006, A&A, 451, 821
- 30 Paczyński B., Rhoads J., 1993, ApJ, 418, L5
- 31 Page K. et al, 2007, ApJ, 663, 1125
- 32 Panaitescu A., Mészáros P., Rees M.J., 1998, ApJ, 503, 314
- 33 Panaitescu A., Kumar P., 2000, ApJ, 543, 66
- 34 Panaitescu A., Kumar P., 2001, ApJ, 554, 667
- 35 Pandey S. et al, 2006, A&A, 460, 415 (P06)
- 36 de Pasquale M. et al, 2006, MNRAS, 365, 1031 (dP06)
- 37 de Pasquale M. et al, 2007, MNRAS, 377, 1638 (dP07)
- 38 Perley D. et al, 2008, ApJ, 672, 449 (P08)
- 39 Perri M. et al, 2007, A&A, 471, 83 (P07)
- 40 Preece R. et al, 2000, ApJS, 126, 19
- 41 Quimby R. et al, 2006, ApJ, 640, 402 (Q06)
- 42 Romano P. et al, 2006, ApJ, 456, 917 (R06)
- 43 Ruiz-Velasco A. et al, 2007, ApJ, 669, 1 (RV07)
- 44 Rykoff E. et al, 2004, ApJ, 601, 1013
- 45 Rykoff E. et al, 2005, ApJ, 631, L121 (R05)
- 46 Sari R., Piran T., Narayan R., 1998, ApJ, 497, L17
- 47 Schady P. et al, 2007, MNRAS, 380, 1041
- 48 Soderberg A. et al, 2007, ApJ, 661, 982 (S07)
- 49 Starling R. et al, 2008, MNRAS, 384, 504
- 50 Tagliaferri G. et al, 2005, A&A, 443, L1 (T05)
- 51 Troja E. et al, 2007, ApJ, 665, 599 (T07)
- 52 Vestrand, W. et al, 2005, Nature, 435, 178
- 53 Vestrand, W. et al, 2006, Nature, 442, 172 (V06)
- 54 Watson D. et al, 2006, ApJ, 652, 1011 (W06)
- 55 Wijers R., Galama T., 1999, ApJ, 523, 177
- 56 Woźniak P. et al, 2005, ApJ, 627, L13 (W05)
- 57 Yost S. et al, 2007, ApJ, 657, 925 (Y07a)
- 58 Yost S. et al, 2007, ApJ, 669, 1107 (Y07b)
- 59 Zeh A., Klose S., Kann A., 2006, ApJ, 637, 889