Spitzer/MIPS Observations of Stars in the Beta Pictoris Moving Group
Abstract
We present Multiband Imaging Photometer for Spitzer (MIPS) observations at 24 and 70 m for 30 stars, and at 160 m for a subset of 12 stars, in the nearby (30 pc), young (12 Myr) Beta Pictoris Moving Group (BPMG). In several cases, the new MIPS measurements resolve source confusion and background contamination issues in the IRAS data for this sample. We find that 7 members have 24 m excesses, implying a debris disk fraction of 23%, and that at least 11 have 70 m excesses (disk fraction of 37%). Five disks are detected at 160 m (out of a biased sample of 12 stars observed), with a range of 160/70 flux ratios. The disk fraction at 24 and 70 m, and the size of the excesses measured at each wavelength, are both consistent with an “inside-out” infrared excess decrease with time, wherein the shorter-wavelength excesses disappear before longer-wavelength excesses, and consistent with the overall decrease of infrared excess frequency with stellar age, as seen in Spitzer studies of other young stellar groups. Assuming that the infrared excesses are entirely due to circumstellar disks, we characterize the disk properties using simple models and fractional infrared luminosities. Optically thick disks, seen in the younger TW Hya and Cha associations, are entirely absent in the BPMG.
Additional flux density measurements at 24 and 70 m are reported for nine Tucanae-Horologium Association member stars. Since this is 20% of the association membership, limited analysis on the complete disk fraction of this association is possible.
1 Introduction
In recent years, several nearby (100 pc) young (200 Myr) stellar associations have been identified. These groupings provide a special opportunity to study “up close” the evolution of circumstellar material at a potentially crucial phase of disk evolution, namely that epoch when planets are thought to be forming. With the advent of the Spitzer Space Telescope (Werner et al. 2004), specifically the Multiband Imaging Photometer for Spitzer (MIPS; Rieke et al. 2004), astronomers now can easily study the properties of the stars in those nearby groupings at much lower disk excess levels than was possible with 2MASS or ISO. In some cases, these stars are close enough, and the disks big enough, that one can spatially resolve the disk structure, providing even more information about the disk properties. While it is thought that all stars start with massive, optically thick, primordial disks, older stars possess much less massive, optically thin, second-generation, debris disks, where the dust to primary star luminosity ratio (see, e.g., Meyer et al. 2007 and references therein). In this phase, it is thought that planetesimal-mass bodies have already formed in the disk; collisions of these bodies can replenish the dust in those systems. The evolution of mid- to far-infrared-emitting dust grains a few microns in size within debris disks has been a subject of much study (see, e.g., Bryden et al. 2006, Su et al. 2006, Chen et al. 2005, Werner et al. 2006 and references therein). The measurement of the overall disk fraction in clusters of known age (and ultimately measurement of the dust distribution in individual systems via direct imaging) is key to understanding disk evolution and planet formation.
The disk around Pictoris has been known since the mid 1980s when it was one of the first debris disks discovered by the Infrared Astonomy Satellite (IRAS) mission (Gillett 1986, Paresce & Burrows 1987). Little was known about Pic when its infrared excess was discovered. It was not located within an obvious star-forming region or cluster, and even its age was poorly constrained. New observations in recent years have placed Pic in better context. A number of other stars have been discovered that share Pic’s space motion and are believed to be coeval with Pic (e.g., Barrado y Navascues et al. 1999; Zuckerman et al. 2001 and references therein). At only 30 pc away with an age of 12 Myr, this so-called Beta Pic Moving Group (BPMG) is the nearest identified young stellar association, and has been studied intensively. Zuckerman & Song (2004) and subsequent authors have identified 30 BPMG member or potential member stellar systems.
This study presents MIPS observations at 24, 70, and 160 m of all of the currently-known BPMG members, as well as several members from the Tucanae-Horologium Association, another nearby (50 pc) young (30 Myr) group (Zuckerman & Song 2004). We first present the observational details (§2), and then discuss identification of stars with infrared excesses (§3). We fit some simple models in §4 to characterize the disk properties for the stars we have found with excesses. Finally, we discuss the sample as a whole in §5, and summarize our conclusions in §6.
| Ass’naaThe abbreviations “BPMG” and “Tuc-Hor” denote the Beta Pic Moving Group and the Tucanae-Horologium associations, respectively. | HIP | HD | HR | GJ | other name | name used here | distance | spectral | ||
|---|---|---|---|---|---|---|---|---|---|---|
| number | number | number | number | (pc) | type | (mag) | (mag) | |||
| BPMG | 560 | 203 | 9 | HR 9 | 39.1 | F2 IV | 6.2 | 5.24 | ||
| BPMG | 10679 | bbSome references list this object as HD 14082B. | HIP 10679 | 34.0 | G2 V | 7.8 | 6.26 | |||
| BPMG | 10680 | 14082 | HD 14082 | 39.4 | F5 V | 7.0 | 5.79 | |||
| BPMG | 11437 | AG Tri A | AG Tri A | 42.3 | K8 | 10.1 | 7.08 | |||
| BPMG | 11437 | AG Tri B | AG Tri B | 42.3 | M0 | … | 7.92 | |||
| BPMG | 12545 | BD 05d378 | HIP 12545 | 40.5 | M0 | 10.4 | 7.07 | |||
| BPMG | 21547 | 29391 | 1474 | 51 Eri | 51 Eri | 29.8 | F0 V | 5.2 | 4.54 | |
| BPMG | 3305 | GJ 3305 | 29.8 | M0.5 | 10.6 | 6.41 | ||||
| BPMG | 23309 | CD-57d1054 | HIP 23309 | 26.3 | K8 | 10.1 | 6.24 | |||
| BPMG | 23418 | 3322 | GJ 3322 A/B | 32.1 | M3 V | 11.7 | 6.37 | |||
| BPMG | 25486 | 35850 | 1817 | HR 1817 | 26.8 | F7/8 V | 6.3 | 4.93 | ||
| BPMG | 27321 | 39060 | Pic | Beta Pic | 19.3 | A5 V | 3.9 | 3.53 | ||
| BPMG | 29964 | 45081 | AO Men | AO Men | 38.5 | K7 | 9.9 | 6.81 | ||
| BPMG | 76629 | 139084 | V343 Nor A | V343 Nor A/B | 39.8 | K0 V | 8.2 | 5.85 | ||
| BPMG | 79881 | 146624 | 6070 | HR 6070 | 43.1 | A0 (V) | 4.8 | 4.74 | ||
| BPMG | 84586 | 155555 | V824 Ara A/B | V824 Ara A/B | 31.4 | K1 VP | 6.9 | 4.70 | ||
| BPMG | 84586 | 155555 | V824 Ara C | V824 Ara C | 31.4 | M4.5 | 12.7 | 7.63 | ||
| BPMG | 88399 | 164249 | HD 164249 | 46.9 | F5 V | 7.0 | 5.91 | |||
| BPMG | 88726A | 165189 | 6749 | HR 6749/HR 6750 | 43.9 | A5 V | 5.0 | 4.39 | ||
| BPMG | 92024 | 172555 | 7012 | HR 7012 | 29.2 | A5 IV/V | 4.8 | 4.30 | ||
| BPMG | CD-64D1208AB | CD-64D1208 A/B | 29.2 | K7 | 10.4 | 6.10 | ||||
| BPMG | 92680 | 174429 | PZ Tel | PZ Tel | 49.7 | K0 VP | 8.4 | 6.37 | ||
| BPMG | 95261 | 181296 | 7329 | Tel | eta Tel A/B | 47.7 | A0 V | 5.1 | 5.01 | |
| BPMG | 95270 | 181327 | HD 181327 | 50.6 | F5/6 V | 7.0 | 5.91 | |||
| BPMG | 102141 | 196982 | 799 | AT Mic | AT Mic A/B | 10.2 | M4.5 | 10.3 | 4.94 | |
| BPMG | 102409 | 197481 | 803 | AU Mic | AU Mic | 9.9 | M1 Ve | 8.8 | 4.53 | |
| BPMG | 103311 | 199143 | HD199143 A/B | 47.7 | F8 V | 7.3 | 5.81 | |||
| BPMG | 358623 | AZ Cap A, BD-17d6128 | AZ Cap A/B | 47.7 | K7/M0 | 10.6 | 7.04 | |||
| BPMG | 112312 | WW PsA A | WW PsA A | 23.6 | M4e | 12.2 | 6.93 | |||
| BPMG | 112312 | WW PsA B | WW PsA B | 23.6 | M4.5e | 13.4 | 7.79 | |||
| Tuc-Hor | 1113 | 987 | HD 987 | 43.7 | G6 V | 8.7 | 6.96 | |||
| Tuc-Hor | 3556 | HIP 3556 | 38.5 | M3 | 12.3 | 7.62 | ||||
| Tuc-Hor | CPD-64d120 | CPD-64d120 | 29.2 | K7 | 9.5 | 8.01 | ||||
| Tuc-Hor | 7805 | 10472 | HD 10472 | 66.6 | F2 IV/V | 7.6 | 6.63 | |||
| Tuc-Hor | 9685 | 12894 | HD 12894 | 47.2 | F2 V | 6.4 | 5.45 | |||
| Tuc-Hor | 10602 | 14228 | 674 | Eri | Phi Eri | 47.5 | B8 V | 3.6 | 4.13 | |
| Tuc-Hor | GSC 8056-0482 | GSC 8056-0482 | 30.9 | M3 Ve | 12.1 | 7.50 | ||||
| Tuc-Hor | 12394 | 16978 | 806 | Hya | Eps Hya | 47.0 | B9 V | 4.1 | 4.25 | |
| Tuc-Hor | 101612 | 195627 | 7848 | HR 7848 | 27.6 | F0 V | 4.8 | 4.04 |
| Spitzer | PI | AORKEY | date of observation | object(s) | 24 m integ. | 70 m integ. | 160 m integ. |
|---|---|---|---|---|---|---|---|
| program id | (Spitzer Archive identifier) | time (s) | time (s) | time (s) | |||
| 102 | Werner | 9018624, 9020928 | 2005-12-01, 2004-06-21 | HR 9 | 48 | 126 | 63 |
| 3600 | Song | 11256064 | 2005-01-29 | HD 14082, HIP 10679 | 48 | 231 | 0 |
| 102 | Werner | 9019392, 9020672 | 2005-08-29, 2006-02-18 | AG Tri A/B | 48 | 231 | 63 |
| 102 | Werner | 9017600, 9020160 | 2005-09-05, 2006-02-17 | HIP 12545 | 48 | 231 | 63 |
| 102 | Werner | 9019904 | 2004-09-16 | 51 Eri, GJ 3305 | 48 | 231 | 0 |
| 102 | Werner | 9024000 | 2004-11-08 | HIP 23309 | 48 | 126 | 0 |
| 102 | Werner | 9023744 | 2004-10-14 | GJ 3322 A/B | 48 | 126 | 0 |
| 148 | FEPS | 5252352, 5446656, 5447424 | 2005-02-27 (all 3) | HR 1817 | 276 | 693 | 84 |
| 80 | Werner | 8970240, 12613632, 4884992 | 2004-03-20, 2005-04-04, 2004-02-21 | Pic | 36 | 252 | 27 |
| 148 | FEPS | 5222656 | 2004-10-13 | AO Men | 92 | 881 | 84 |
| 148 | FEPS | 5223424 | 2004-07-29 | V343 Nor A/B | 92 | 231 | 0 |
| 10 | Jura | 3720704 | 2004-02-25 | HR 6070 | 48 | 126 | 0 |
| 84 | Jura | 4813056 | 2004-09-17 | V824 Ara A/B/C | 48 | 126 | 0 |
| 102 | Werner | 9019136, 9023488 | 2005-08-30, 2004-03-17 | HD 164249 | 48 | 101 | 63 |
| 102 | Werner | 9023232 | 2004-09-23 | HR 6749/HR 6750 | 48 | 231 | 0 |
| 10 | Jura | 3723776 | 2004-04-07 | HR 7012, CD-64D1208A/B | 48 | 126 | 0 |
| 72 | Low | 4554496 | 2004-04-06 | PZ Tel | 180 | 545 | 0 |
| 57 | Rieke | 8934912, 8935168, 8935424 | 2004-04-09, 2004-04-09, 2004-04-07 | Tel | 48 | 100 | 76 |
| 72 | Low | 4556032 | 2004-04-06 | HD 181327 | 92 | 126 | 63 |
| 80 | Werner | 4637184 | 2004-05-11 | AT Mic A/B | 48 | 231 | 0 |
| 3657 | Graham | 11403008 | 2005-05-20 | AU Mic (160 only) | 0 | 0 | 629 |
| 80 | Werner | 4637440 | 2004-05-02 | AU Mic | 48 | 231 | 0 |
| 148 | FEPS | 5254656 | 2004-10-13 | HD 199143 A/B | 92 | 231 | 84 |
| 80 | Werner | 4643840 | 2004-05-11 | AZ Cap A/B | 48 | 545 | 0 |
| 102 | Werner | 9021696 | 2004-05-31 | WW PsA A/B | 48 | 126 | 0 |
| 102 | Werner | 9022976 | 2004-11-05 | HD 987 | 48 | 126 | 0 |
| 102 | Werner | 9022720 | 2004-11-03 | HIP 3556 | 48 | 231 | 0 |
| 102 | Werner | 9022464 | 2004-05-11 | CPD-64d120 | 48 | 0 | 0 |
| 102 | Werner | 4945152 | 2004-11-07 | HD 10472 | 48 | 69 | 0 |
| 102 | Werner | 9022208 | 2004-11-07 | HD 12894 | 48 | 126 | 0 |
| 102 | Werner | 9021952 | 2004-11-08 | Eri | 48 | 231 | 0 |
| 102 | Werner | 9021440 | 2004-11-07 | GSC 8056-482 | 48 | 126 | 0 |
| 102 | Werner | 9021184 | 2005-06-19 | Hya | 48 | 231 | 0 |
| 102 | Werner | 9020416 | 2004-04-13 | HR 7848 | 48 | 69 | 0 |
| object | photospheric | measured | photospheric | measured | photospheric | measured |
|---|---|---|---|---|---|---|
| 24 m (mJy) | 24 m (mJy)aaThe systematic uncertainty on our 24 m flux densities is estimated to be 4% (Engelbracht et al. 2008). | 70 m (mJy) | 70 m (mJy)bbThe systematic uncertainty on our 70 m flux densities is estimated to be 10% (Gordon et al. 2008; see also discussion in text). Upper limits quoted here are 3-. | 160 m (mJy) | 160 m (mJy)ccThe systematic uncertainty on our 160 m flux densities is estimated to be 12% (Stansberry et al. 2008). Upper limits quoted here are 3-. | |
| HR 9 | 60 | 109ddInfrared excess and inferred disk at this wavelength; see text for discussion as to how these disk candidates were selected. | 7.0 | 61ddInfrared excess and inferred disk at this wavelength; see text for discussion as to how these disk candidates were selected. | 1.3 | 27 |
| HIP 10679 | 23 | 39ddInfrared excess and inferred disk at this wavelength; see text for discussion as to how these disk candidates were selected. | 2.7 | 43.0ddInfrared excess and inferred disk at this wavelength; see text for discussion as to how these disk candidates were selected. | 0.5 | … |
| HD 14082 | 36 | 37 | 4.2 | 18 | 0.8 | … |
| AG Tri A | 14 | 17 | 1.7 | 75.1ddInfrared excess and inferred disk at this wavelength; see text for discussion as to how these disk candidates were selected. | 0.3 | 35 |
| AG Tri B | 7.2 | 7.1 | 0.9 | 23 | 0.2 | 35 |
| HIP 12545 | 16 | 12 | 1.9 | 25 | 0.4 | 50 |
| 51 Eri | 114 | 115 | 13.2 | 23 | 2.5 | … |
| GJ 3305 | 29 | 24 | 3.4 | 23 | 0.6 | … |
| HIP 23309 | 34 | 27 | 4.0 | 24 | 0.8 | … |
| GJ 3322 A/B | 30 | 28 | 3.8 | 39 | 0.7 | … |
| HR 1817 | 79 | 79 | 9.2 | 44.7ddInfrared excess and inferred disk at this wavelength; see text for discussion as to how these disk candidates were selected. | 1.7 | 77 |
| PiceeThe 24 and 70 m flux densities are from Su et al. (2006); see text. | 280 | 7276ddInfrared excess and inferred disk at this wavelength; see text for discussion as to how these disk candidates were selected. | 32 | 12990ddInfrared excess and inferred disk at this wavelength; see text for discussion as to how these disk candidates were selected. | 5.9 | 3646ddInfrared excess and inferred disk at this wavelength; see text for discussion as to how these disk candidates were selected. |
| AO Men | 15 | 15 | 1.7 | 8 | 0.3 | 28 |
| V343 Nor A/B | 34 | 34 | 4.0 | 86 | 0.7 | … |
| HR 6070 | 90 | 97 | 10.4 | 77 | 1.9 | … |
| V824 Ara A/B | 100 | 97 | 11.9 | 25 | 2.2 | … |
| V824 Ara C | 9.9 | 11 | 1.3 | 25 | 0.2 | … |
| HD 164249 | 32 | 76ddInfrared excess and inferred disk at this wavelength; see text for discussion as to how these disk candidates were selected. | 3.7 | 624ddInfrared excess and inferred disk at this wavelength; see text for discussion as to how these disk candidates were selected. | 0.7 | 104ddInfrared excess and inferred disk at this wavelength; see text for discussion as to how these disk candidates were selected. |
| HR 6749/HR 6750 | 120 | 113 | 14.4 | 27 | 2.7 | … |
| HR 7012 | 130 | 766ddInfrared excess and inferred disk at this wavelength; see text for discussion as to how these disk candidates were selected. | 15.6 | 197ddInfrared excess and inferred disk at this wavelength; see text for discussion as to how these disk candidates were selected. | 2.9 | … |
| CD-64D1208 A/B | 35 | 30 | 4.2 | 23 | 0.8 | … |
| PZ Tel | 21 | 21 | 2.5 | 17.4ddInfrared excess and inferred disk at this wavelength; see text for discussion as to how these disk candidates were selected. | 0.5 | … |
| Tel A/BeeThe 24 and 70 m flux densities are from Su et al. (2006); see text. | 70 | 382ddInfrared excess and inferred disk at this wavelength; see text for discussion as to how these disk candidates were selected. | 8.1 | 409ddInfrared excess and inferred disk at this wavelength; see text for discussion as to how these disk candidates were selected. | 1.5 | 68ddInfrared excess and inferred disk at this wavelength; see text for discussion as to how these disk candidates were selected. |
| HD 181327 | 32 | 195ddInfrared excess and inferred disk at this wavelength; see text for discussion as to how these disk candidates were selected. | 3.7 | 1468ddInfrared excess and inferred disk at this wavelength; see text for discussion as to how these disk candidates were selected. | 0.7 | 658ddInfrared excess and inferred disk at this wavelength; see text for discussion as to how these disk candidates were selected. |
| AT Mic A/B | 118 | 116 | 14.9 | 18 | 2.9 | … |
| AU Mic | 164 | 143 | 19.4 | 205ddInfrared excess and inferred disk at this wavelength; see text for discussion as to how these disk candidates were selected. | 3.7 | 168ddInfrared excess and inferred disk at this wavelength; see text for discussion as to how these disk candidates were selected. |
| HD 199143 A/B | 35 | 35 | 4.0 | 22 | 0.8 | 31 |
| AZ Cap A/B | 15 | 13 | 1.8 | 12 | 0.3 | … |
| WW PsA A | 19 | 18 | 2.4 | 27 | 0.5 | … |
| WW PsA B | 8.6 | 9.1 | 1.1 | 27 | 0.2 | … |
| HD 987 | 12 | 12 | 1.4 | 21 | 0.3 | … |
| HIP 3556 | 9.5 | 8.4 | 1.2 | 16 | 0.2 | … |
| CPD-64d120 | 6.1 | 4.9 | 0.7 | … | 0.1 | … |
| HD 10472 | 17 | 26ddInfrared excess and inferred disk at this wavelength; see text for discussion as to how these disk candidates were selected. | 1.9 | 127ddInfrared excess and inferred disk at this wavelength; see text for discussion as to how these disk candidates were selected. | 0.4 | … |
| HD 12894 | 49 | 46 | 5.8 | 20 | 1.1 | … |
| Eri | 150 | 170 | 17.3 | 17 | 3.2 | … |
| GSC 8056-0482 | 11 | 9.0 | 1.3 | 24 | 0.3 | … |
| Hya | 140 | 124 | 15.9 | 12.6 | 3.0 | … |
| HR 7848 | 179 | 186 | 20.8 | 609ddInfrared excess and inferred disk at this wavelength; see text for discussion as to how these disk candidates were selected. | 3.9 | … |

2 Observations, Data Reduction, and Ancillary Data
2.1 Target selection and observations
Many individual member stars from nearby young stellar clusters are scattered among several of the programs originating with the Spitzer guaranteed-time observers (GTO). The Spitzer GTO program 102 (P.I.-M. Werner) observed 13 BPMG stars or systems, along with nine stars (or systems) thought to be Tucanae-Horologium association members (where membership for both associations is as reported by Zuckerman & Song 2004). As the observers of record for this program, we felt it important to report the observations for all of the stars from this program. In order to enhance the discussion, we assembled a list of all of the stars or stellar systems thought to be members of the BPMG, based on Zuckerman & Song (2004). We retrieved data for the remaining stars/star systems of the BPMG out of the Spitzer Archive. Nearly all of these observations come from GTO programs and were obtained over the first 3 years of the mission.
The 39 stars or systems discussed in this paper – all the targets from program 102, plus the remaining Beta Pic member stars from the archive – are listed in Table 1, along with cluster membership. Note that binary systems unresolved by MIPS are listed together, e.g, GJ 3322 A/B, and that these unresolved binaries are effectively treated as single stars throughout the rest of this paper. The implications of this decision will be discussed further below. The Tuc-Hor stars are included at the bottom of this table (and the next two tables), separated from the BPMG stars by a line.
All of the Spitzer archive identifications (AORKEYs) and other assorted program information (including program IDs and dates of observation) are listed in Table 2. Since the observations were acquired from a variety of programs, the integration times used for each target are not uniform (see Table 2). All targets were observed at 24 m, all but one at 70 m (CPD-64d120), and a subset of twelve sources, not selected uniformly, were observed at 160 m. All objects are detected at good signal-to-noise (25) at 24 m; there are many upper limits at both 70 and 160 m.
Since we assembled our list of members from Zuckerman & Song (2004), we are obviously missing any undiscovered members. Thus, we cannot assert that our study is complete over all possible BPMG members. As discussed in Song et al. (2008) and Torres et al. (2006), surveys of young stars near Earth form distinctive groupings in age-velocity-position space, and young members earlier than M are easily identified via, e.g., lithium absorption. It is unlikely that there are many undiscovered members earlier than M. However, it is possible that there are undiscovered M star members. These intrinsically fainter M stars often lack parallax measurements, and moreover are often harder to confirm as members, because they, for example, deplete Li faster than higher-mass stars.
Because the BPMG is physically close to us, it subtends a large angle on the sky, and finding additional members often requires searching over a large area. However, co-moving companions may be found in close proximity to known members, as evidenced by the number of known companions in the BPMG. Our observations cover relatively small regions around each member star, so we have a chance of finding these sorts of close companions. Several observations detect additional objects in the field near BPMG members; since these objects are bright enough to be detected in these shallow observations, these objects could also be potential association members, and the argument for BPMG membership might be made if these objects have infrared excesses. We examined our data for any additional stars with excesses serendipitously included within the Spitzer field of view, but none were detected; see the Appendix for discussion of each individual case.
2.2 Data reduction
All of the observations were conducted in MIPS photometry mode. Most of the observations were conducted using the small field photometry astronomical observing template (AOT) and, at 70 m, the default pixel scale. For these targets (including those in the literature), we reprocessed the data in a uniform manner in order to limit systematics introduced by slightly different reduction methods. Two objects, Tel and Pic, were observed using observing strategies designed for extended objects (e.g., customized sub-pixel dithering, and 70 m fine scale). We note for completeness that, while Pic is well-resolved at MIPS wavelengths, Tel is not. Because these data must be handled differently anyway, rather than reprocessing the data, we use the MIPS photometry at 24 and 70 m as reported by Su et al. (2006) for both Tel and Pic.
We started with the Spitzer Science Center (SSC) pipeline-produced basic calibrated data (BCDs), version S14. (For a description of the pipeline, see Gordon et al. 2005.) Since we treated each MIPS channel differently, each is discussed separately below.
Our detections and upper limits are listed in Table 3. Note that, while every target was detected at 24 m, one target was not observed at 70 m (CPD-64d120), and more than half the sample was not observed at 160 m. For most of our sample, this is the first time that MIPS fluxes have appeared in the literature. For the four FEPS stars that are part of the FEPS final delivery catalog (available on the SSC website) and for the three stars reported in Chen et al. (2005), our fluxes are consistent within the reported errors.
2.2.1 24 m
All targets were observed at 24 m. For each observation, we constructed a 24 m mosaic from the pipeline BCDs using the SSC mosaicking and point-source extraction (MOPEX) software (Makovoz & Marleau 2005), with a pixel scale of 2.5 px-1, close to the native pixel scale of . We extracted sources from the 24 m mosaics using the astronomical point-source extraction (APEX) 1-frame portion of MOPEX, with point response function (PRF)-fitting photometry of the image mosaics. All of our targets were detected at good signal to noise (25) at 24 m. The systematic uncertainty in the zero-point of the conversion from instrumental units to calibrated flux units is estimated to be 4% (Engelbracht et al. 2008); the statistical error is much smaller, and so is not tabulated.
2.2.2 70 m
At 70 m, the SSC pipeline produces two sets of BCDs; one is where the processing is done on the basis of individual BCDs, and the other has additional spatial and temporal filters applied that attempt to remove instrumental signatures in an automated fashion. (For a description of the pipeline, see Gordon et al. 2005.) We used the filtered BCDs to construct mosaics for all of the targets at 70 m, resampled to 4 px-1, about half the native pixel scale of .
We extracted sources from the 70 m mosaics again using the APEX 1-frame portion of MOPEX. For the sources that were detected, most of the fluxes we report are from PRF-fitting; some bright source fluxes are better determined using aperture photometry instead. In those cases, an aperture of 32 and an aperture correction (multiplicative factor) of 1.295 was used. If no believable object was seen by eye at the expected location, it was taken to be a non-detection, and this aperture was laid down at the expected location of the target, plus two other nearby locations north and south of the target position. Based on these measurements, an asssessment of the 1- scatter per (native) pixel in nearby background sky brightness was made over the aperture, and that scatter was multiplied by 3 to obtain 3- upper limits. The same aperture correction was used as for the aperture photometry of detected objects.
All but one of the targets was observed at 70 m. CPD-64d120 was not observed at 70 m because its expected photospheric flux was far below the sensitivity that could be obtained within a reasonable amount of integration time. As can be seen in Table 3, 14 objects were detected and 24 were not detected (3- upper limits are in Table 3).
The systematic uncertainty in the conversion of instrumental units to calibrated flux units is estimated to be 5% for default-scale photometry by Gordon et al. (2008). Gordon et al. are working with PSF fitting; we have some PSF fitting and some aperture photometry. In addition, some of our targets are fainter than the ones used in Gordon et al., and some of our targets are observed in fine-scale photometry mode. To be conservative, then, we take the systematic uncertainty to be 10%. Most of our objects are seen at signal-to-noise ratios 10; our statistical error on detections is much smaller than the systematic error of 10% in most cases, so is not reported. In two cases, PZ Tel and Hya, the statistical error (as determined with similar methdology to that for the upper limits above) is comparable to the systematic error. PZ Tel is detected with a signal-to-noise ratio of 10 (uncertainty of 2 mJy on the 17.4 mJy detection in Table 3), and Hya is detected with a signal-to-noise ratio of 3 (uncertainty of 4 mJy on the 12.6 mJy detection in Table 3).
Several of our targets have serendipitously imaged detections in the 52.5 field of view (see Appendix A). The density of extragalactic background objects with brightness 15 mJy (the faintest 70 m detection of a BPMG object achieved in this study) is 0.02 arcmin-2 (Dole et al. 2004). This leads to an expectation of 10 unrelated background objects appearing in our data. However, these are easily distinguished from our target objects by their offset positions; the probability is that a background object would be coincident with any of our targets (see, e.g., Smith et al. 2006).
2.2.3 160 m
Twelve targets were observed at 160 m. This subset of 12 targets was not selected uniformly for observation at 160 m. For the targets that were observed as part of program 102, those objects expected to be brightest and seen at 70 m were selected for observation at 160 m. For the objects taken from other programs, we have no way of reconstructing why these targets were selected for observation.
The MIPS data analysis tool (DAT) software (version 3.06; Gordon et al. 2005) was used to calibrate the raw data ramp slopes, apply a flat field correction, and mosaic the images in detector coordinates at an image scale of 8 pixel-1 (half the native plate scale of ). The data were flux-calibrated using the standard conversion factor of 1050 mJy arcsec-2 (flux unit)-1, with about 12% systematic uncertainty (Stansberry et al. 2008). For our oversampled image mosaics, this is equivalent to 269 mJy DN-1 in a pixel.
The MIPS 160 micron array suffers from a spectral leak that allows near-IR radiation to produce a ghost image adjacent to the true 160 micron source image for stellar (roughly Rayleigh-Jeans) sources. The leak is only bright enough to appear above the confusion noise for sources with 5.5 (MIPS Data Handbook V3.2). Among our stars observed at 160 m, three sources are brighter than this limit: Pic, Tel, and AU Mic. In the first source, the circumstellar 160 m emission is considerably brighter than the leak, so no effort was made to subtract off the leak. In the latter two sources, the leak was subtracted using observations of a photospheric standard, Achernar, from the Spitzer Archive (AORKEY 15572992) as a reference source. The subtraction procedure is to empirically determine the maximum normalization factor for the leak reference source, such that its subtraction from the science target does not produce noticable residuals below the background level.
To estimate upper limits to the 160 micron source flux densities, we measured the rms background variation among four 77 pixel apertures offset 64 arcsec along the detector rows/columns from the expected source position. For this aperture size, the 1- equivalent noise was calculated as 1/7th of the individual pixel rms, assuming that the errors combine in quadrature. This value was then converted to a limiting flux density and corrected for the finite aperture size using a multiplicative factor of 1.64 (measured from an STiny Tim model PSF; Krist 2005). Background cirrus emission can cause variation in the achieved sensitivity, with the 3- upper limits ranging over 27-77 mJy for our targets.
The five detections (and seven 3- upper limits) are listed in Table 3. Most of our objects are seen at signal-to-noise ratios 8; our statistical error on detections is much smaller in most cases than the systematic error of 12%, so is not reported. For Tel, the detection has a signal-to-noise ratio of 4 (error of 16 mJy on the 68 mJy reported in Table 3).
2.3 Ancillary Data
We consulted the literature for ancillary data on these objects including spectral types, and ground-based MIR magnitudes, distances, , membership, etc. References consulted for literature values were the 2 Micron All-Sky Survey (2MASS; Skrutskie et al. 2006), NASA Star and Exoplanet Database (NStED; Ali et al. 2005), the IRAS faint source catalog (FSC; Moshir et al. 1992) and bright source catalog (BSC; Beichman et al. 1988), as well as Zuckerman & Song (2004), Song et al. (2003), Feigelson et al. (2006), Chen et al. (2005b), Su et al. (2006), Kaisler et al. (2004), Zuckerman et al. (2001), Mamajek et al. (2004), Zuckerman et al. (2001), Plavchan et al. (2005), Jayawardhana et al. (2006), and Schneider et al. (2006).
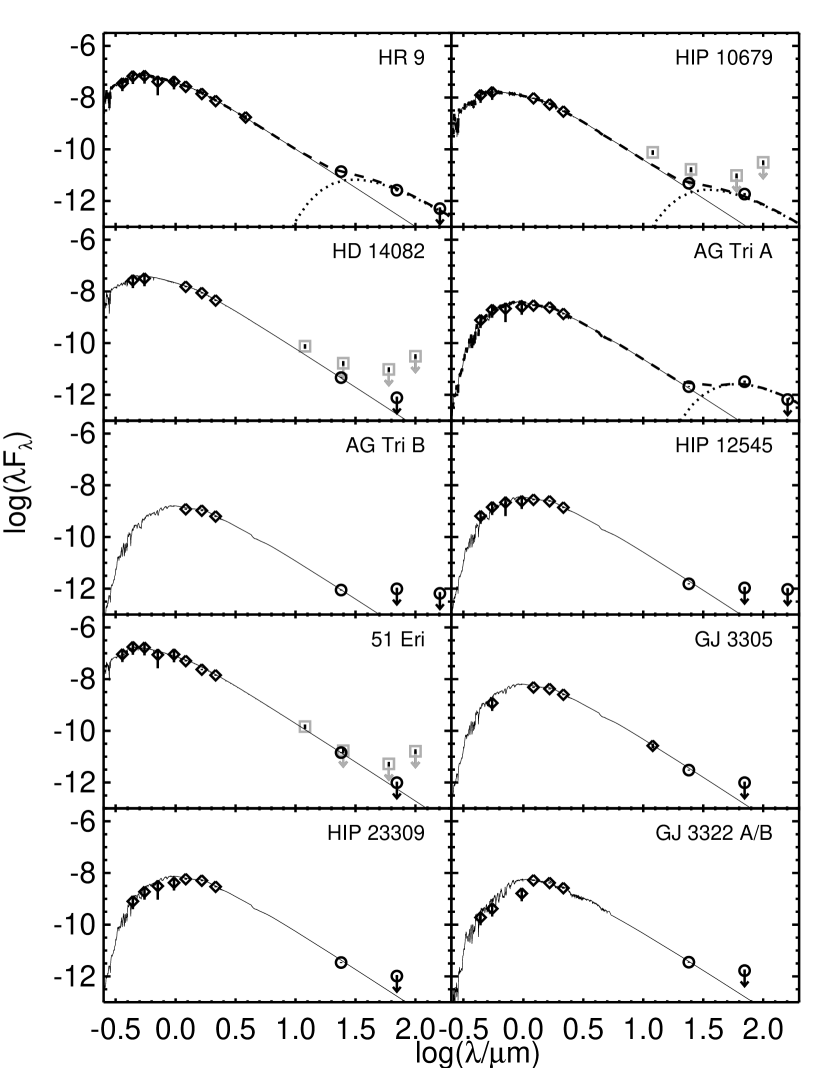
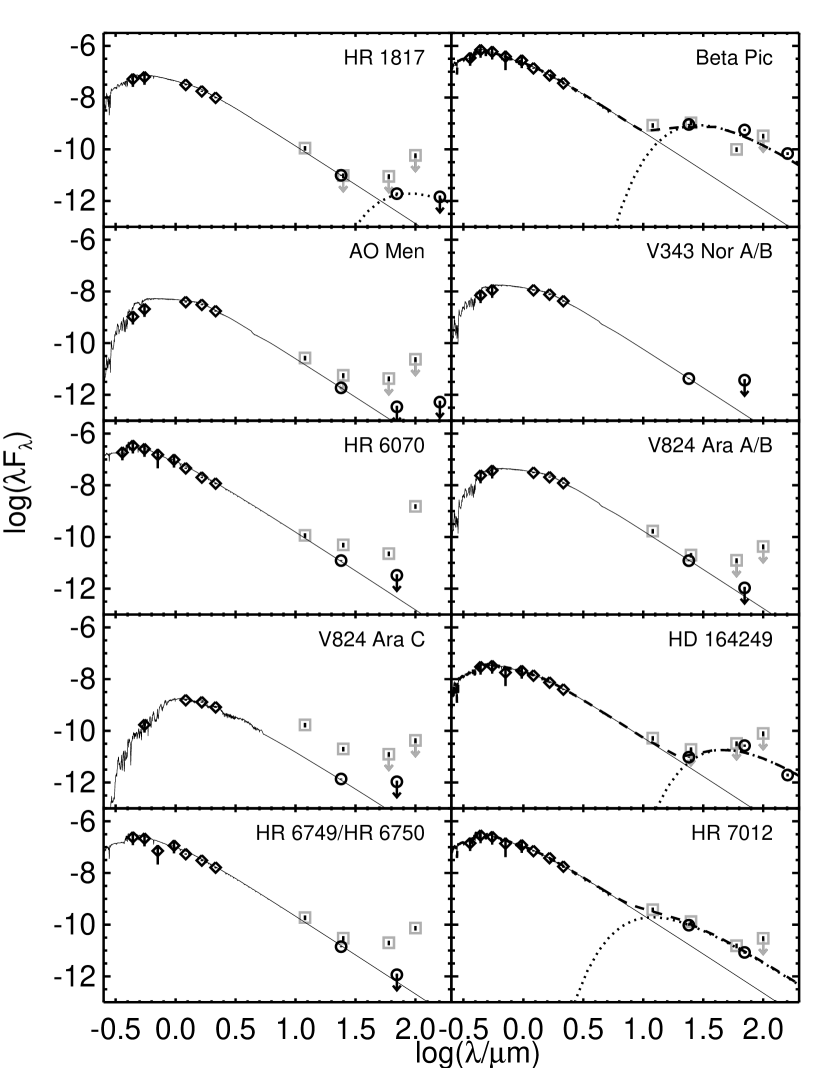
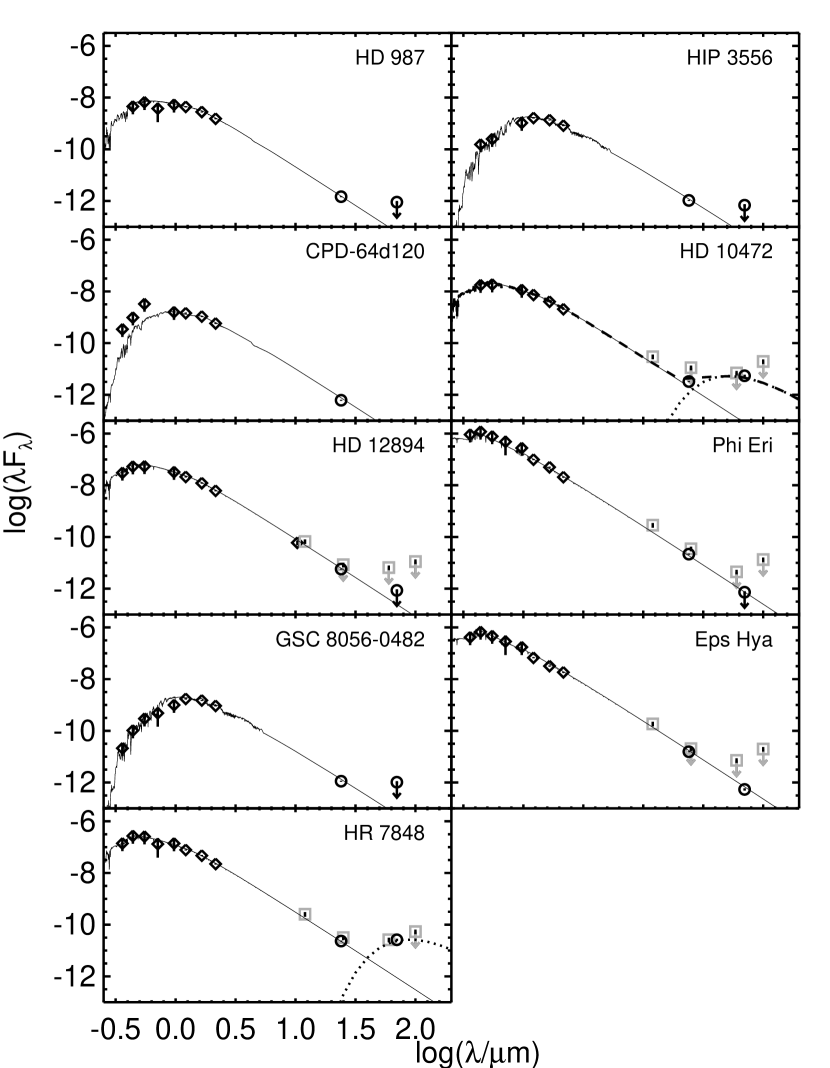
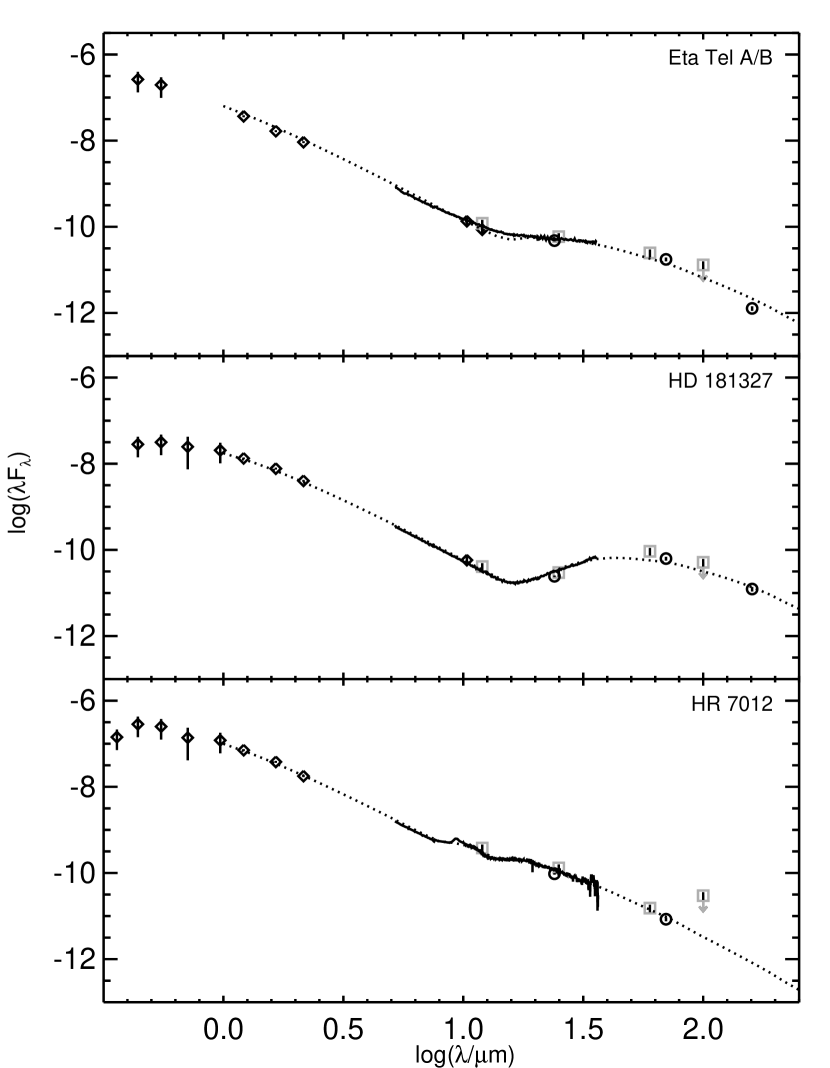
2.4 SEDs and expected values
Spectral energy distributions (SEDs) from band through 160 m, created from the literature data plus our MIPS fluxes, for all of these targets are portrayed in Figures 1-4. BPMG stars are in Figures 1-3, and Tuc-Hor stars are in Figure 4. Note that the error bars are usually smaller than the points; the points are hollow symbols, and the central vertical bar is the corresponding error.
If available, spectral types as determined from spectra (not from photometry) from the literature were used for each star. If no spectrum-based type was available, the type determined from color as reported in Zuckerman & Song (2004) was used; these types appear in Table 1 as types without luminosity classes. Using temperatures and gravities inferred from the spectral type, we selected the closest grid point from the Kurucz-Lejeune model grid (Lejeune et al. 1997, 1998). This stellar model is shown in Figures 1-4 and is used to determine the expected photospheric flux densities for the sample of stars at MIPS wavelengths. The models are normalized to the observed data at . Interpolating models rather than selecting the nearest grid point does not make any significant difference in the expected photospheric flux density. Using a single spectral type for unresolved binaries rather than a hybrid of two spectral types also does not make any significant difference in the expected photospheric flux density (see Trilling et al. 2007).
Because the spectral types are already well-known for most of these stars, we did not wish to allow the spectral type to be a free parameter in our fits. However, we did wish to assess the goodness of the fit. Values of were calculated for the models in Figures 1-4, and, as can be seen by eye in the Figures, all the fits are quite good, even given occasional deviant optical points pulled from the literature. For most of the objects, typical values of are 0.46 (e.g., typically 10% chance that the model is a bad fit). For the remaining objects, typically one optical point is off (e.g., GJ 3322 A/B, see Figure 1), which distorts the ; dropping those points brings the into line with the rest of the objects.
The expected photospheric flux densities were linearly interpolated to the MIPS wavelengths from the Kurucz-Lejeune model. These estimated photospheric flux densities are included in Table 3. If the assumed spectral type is off by a subclass, over the entire range of types considered in this paper, there is typically a 4% change in the calculated photospheric flux, comparable to the systematic uncertainty in the measured 24 m fluxes.
3 Results: Infrared Excesses in the BPMG
3.1 Excesses at 24 m


There are a variety of methods in the literature for finding circumstellar disks based on the 24 m excess. We will consider a few slightly different methods here and establish our final sample of 7 objects (plus 1 more from Tuc-Hor) with excesses at 24 m.
Figure 5 is a color-magnitude diagram of vs. [24]. In this figure, four stars stand out obviously as having [24]1.5: Pic, HR 7012, Tel, and HD 181327. We could declare these four stars as our only stars with excesses. However, more subtle excesses are certainly present in the remaining stars; the points do not scatter evenly around [24]=0. Even omitting the five stars with the largest [24], the mean [24] color is 0.23, although there is a large standard deviation; the 1 dispersion is 0.25.
To identify which of the remaining stars have excesses, we consider the photospheric color. For most spectral types, the photospheric [24] color should be close to 0. Gautier et al. (2007) find for M stars that there is a dependence of [24] color with such that the latest types have a [24] color up to 1.5 for the coolest stars considered there (2000). Figure 6 shows the [24] color as a function of spectral type for our sample here, along with the photospheric line from Gautier et al. (2007). The non-zero color for the latest types is readily apparent, and the tightness of the correlation as a function of spectral type through the Ms clearly follows the photospheres (see Gautier et al. 2007 for more discussion). For types earlier than K0, we have another four stars whose [24] colors are clearly distinct from 0: HD 164249 (F5), HR 9 (F2), HIP 10679 (G2), and HD 10472 (F2). These objects too are therefore likely to possess excesses at 24 m.
We clearly need to take into account expected photospheric flux to assess the significance of the [24] excess, and for that we need to depend on a model estimate of the photospheric flux. Bryden et al. (2006) consider nearby solar-type stars, calculating the ratio of the measured to expected fluxes at 24 m. They determined infrared excess objects to be those with Fmeas/F1.2. Taking Fmeas/F1.2 provides a relatively conservative disk criterion at 24 m, in that it sets a limit that is more than 3 times the systematic error of 4%, also providing ample room for the comparable 4% uncertainty in the calculation of Fpred. In our sample, we can construct a (sparse) histogram of Fmeas/Fpred, and, as expected, the histogram is sharply peaked around 1 with a break at 1.2 and a long tail111To see the distribution of Fmeas/Fpred in one dimension, see Figure 11. extending out to 27. The 1- scatter in the points centered on Fmeas/F1 is 0.09. The similar analysis in Bryden et al. (2006) finds a 1- scatter of 0.06. The number we obtain, 0.09, is an upper limit to the true error because we have fewer stars than Bryden et al. and are using different methodology (normalizing the star to rather than fitting to the entire SED); a few stars in our sample could inflate the error as a result of small excesses or incorrect magnitudes. On this basis, we believe our results to be fundamentally consistent with those from Bryden et al. (2006).
The eight objects identified above have Fmeas/F1.2. Note that Pic itself has a ratio of 27 (the largest of the sample). As shown in Figure 6, HD 10472 has the smallest ratio, 1.6. Assuming our scatter above of 0.09 as the worst-case-scenario, this lowest excess of our entire data set is a 6- excess.
There are two M stars in Figure 6 that could have slight excesses, as their [24] are redder than other objects of similar spectral type; they are AG Tri A and B. AG Tri A has a ratio that is exactly 1.2. AG Tri A will emerge in the next section as having a 70 m excess, so it is quite possible that it has a small 24 m excess. AG Tri B has only a slightly larger [24] than other stars plotted of similar spectral type, and has Fmeas/Fpred at 24 microns of 0.98, well below our adopted excess criterion.
AU Mic is known to have a resolved disk at other wavelengths (e.g., Graham et al. 2007), so we investigated the evidence for an infrared excess more closely. The spectral type of this star is usually taken to be M1 (e.g., Graham et al. 2007, Houk 1982); it has [24]=0.29, which is comparable to the photospheric emission from other stars of that spectral type from Gautier et al. (2007). AU Mic has Fmeas/Fpred at 24 m of 0.9, if anything suggestive of a flux deficit at 24 microns. If the spectral type of AU Mic were incorrect, and its true spectral type was earlier, our analysis method would yield a smaller value of Fpred and hence a larger value of Fmeas/Fpred. In order to yield Fmeas/F 1.2, however, the true spectral type would have to be early K. We have obtained our own high S/N, echelle spectrum of AU Mic in order to constrain better its spectral type (Stauffer et al. in preparation). Based on the strength of the TiO bandheads near 7050 Å, we estimate a spectral type at least as late as M1, and exclude a spectral type earlier than M0. Therefore, we believe our determination that AU Mic does not have an excess at 24 m is robust. In support of this, we note that the IRAS 25 m flux is comparable to our 24 m flux, and that Chen et al. (2005) also conclude that the star has no 24 m excess.
Formally adopting the Bryden et al. (2006) criterion, then, we find that 8 out of the 39 stars or star systems in our entire sample have 24 m excesses. Out of the 30 stars in the BPMG for which we have measurements, 7 have Fmeas/F1.2. Assuming that the excesses are due to circumstellar disks, this implies a disk fraction at 24 m of 23%.
3.2 Excesses at 70 m

Figure 7 shows a plot similar to Figure 5 but for [70] colors. Here, expected photospheric colors are [70]0. Bryden et al. (2006) set a value of Fmeas/F2 (the precise level is dependent on the background level) to divide the disks from the non-disked stars. The overall scatter found for the Bryden et al. Fmeas/Fpred for stars without excesses was 25%, so the limit of Fmeas/F2 corresponds to 4.
In our data, just 14 stars are detected at 70 m (compared with 39 stars detected at 24 m). We have many fewer detections than Bryden et al. (2006), and even upon initial inspection of the SEDs or Figure 7, just one object ( Hya) seems to be a likely photospheric detection. In the 24 m section above, we were able to examine the scatter of our measurements of Fmeas/Fpred for photospheres in our sample; there is no way for us to repeat this analysis here at 70 m as a check on the Fmeas/F2 excess cutoff. However, all of the detections at 70 m are clear excesses, with the exception of Hya. Eps Hya has Fmeas/F0.8, and all the rest of the detections are Fmeas/F4.9, well beyond the Bryden et al. limit (20, assuming the 0.25 scatter), so we believe that the exact value for the criterion to separate stars with excesses from those without is not critical. AG Tri A, which was determined above to have an insignificant 24 m excess, has Fmeas/Fpred=44 at 70 m.
Fourteen of our larger sample of 38 stars or star systems are detected at 70 m. The sensitivity of the 70 m observations in this sample varies considerably because of the range of exposure times used in these observations and the cirrus background. Out of the 30 members of the BPMG, 11 are detected, all of which have considerably more than photospheric emission. This represents a lower limit on the BPMG excess fraction (at 70 m) of 37%.
3.3 Excesses at 160 m
None of the observations at 160 m are sensitive enough to detect the expected photospheric flux densities, so all of the 160 m detections are suggestive of excesses. Of the 12 BPMG stars with 160 m data, 5 are detected ( Pic, HD 164249, Tel, HD 181327, and AU Mic). Because the sample of stars selected for observation at 160 m is biased towards those with disks, we cannot infer a limit on the excess fraction (at 160 m).
All stars detected at 160 m are also detected at 70 and 24 m, and almost all of the stars with 160 m excesses also have excesses at the other two MIPS wavelengths. The sole exception is AU Mic, which has a clear excess at 70 but not at 24 m. Based on the blackbody fits (see below), in no case does the 160 m detection suggest a cold component of dust that is not seen at the shorter MIPS wavelength(s). (For a discussion of how much cold dust could be included within the uncertainty of the 160 m detections that is not already accounted for with the component seen at 24 and 70 m, please see Gautier et al. 2007.)
3.4 Comparison with IRAS
Of our 39 targets observed at 24 m from both the BPMG and Tuc-Hor, 19 appear in the IRAS FSC or BSC with either detections or upper limits (plus 3 more included with a nearby association member by the IRAS beam). Discussion of individual objects is in Appendix A, including those objects where MIPS observations have resolved source confusion (or background contamination) found in the large-beam IRAS measurements.
In summary, the MIPS observations confirm five excesses discovered by IRAS. In five more cases (four of which have excesses at 70 m), MIPS provides a detection near the IRAS limit. For the remaining 9 systems, MIPS establishes a new much more stringent upper limit on any excess that may be present; at least 3 of those previously appeared to have an excess based solely on IRAS results. There are three new excesses without any prior IRAS detections or limits. For individual source assessment, the SEDs for each object (including IRAS detections and limits) appear in Figures 1-4, and discussion of specific cases appears in the Appendix.
4 Disk Properties
We note here for completeness the following items. Simply having does not assure that the disk is really a debris disk, which by definition requires a second generation of dust and gas depletion; however, values of are likely debris disks. Spitzer/MIPS observations constrain the presence of dust in these systems, but say nothing about any gas or grains much larger than the wavelength of observation. From this point forward, we have assumed that any excess infrared emission that we observe above the photosphere is due entirely to a dusty circumstellar disk. Until observations at any wavelength resolve the disk, this remains an assumption.
| simple blackbody models | more complex models | ||||||
|---|---|---|---|---|---|---|---|
| object | BB T | min. | min. | ||||
| (K) | () | (AU) | () | () | (AU) | (AU) | |
| Disks detected at more than one wavelength | |||||||
| HR 9 | 120 | 10 | 10 | 0.0004 | 0.25 | 35 | 200 |
| HIP 10679 | 100 | 80 | 20 | 0.01 | 0.4 | 35 | 200 |
| AG Tri AaaSince the Fmeas/Fpred at 24 m for this star was right at 1.2, we attempted modelling of this star including the observed flux density at 24 m. | 65 | 79 | 10 | 0.003 | …ddfootnotemark: | … | … |
| PicbbA simple disk fit was made for Beta Pic for self-consistency with the rest of the sample; this object is resolved at MIPS wavelengths and the disk is better characterized using other methods. | 130 | 180 | 10 | 0.012 | … | … | … |
| HD 164249 | 78 | 59 | 20 | 0.01 | …ddfootnotemark: | … | … |
| HR 7012 | 310 | 90 | 2 | 0.0002 | 0.05 | 5 | 200 |
| Tel A/B | 140 | 24 | 20 | 0.0027 | 0.8 | 70 | 200 |
| HD 181327 | 75 | 250 | 20 | 0.06 | 10 | 68ccNo fit possible; see text for discussion. | 104ccNo fit possible; see text for discussion. |
| AU Mic | 50 | 23 | 8 | 0.0005 | 1 | 35 | 200 |
| HD 10472 (Tuc-Hor) | 70 | 67 | 30 | 0.02 | 30 | 400 | 700 |
| Disks detected only at 70 m | |||||||
| HR 1817 | (41) | 3.0 | (60) | (0.004) | 0.3 | 100 | 200 |
| PZ Tel | (41) | 7.3 | (50) | (0.006) | 0.3 | 35 | 200 |
| HR 7848 (Tuc-Hor) | (41) | 13 | (100) | (0.07) | 5 | 250 | 400 |
4.1 Blackbody fits
For those 13 objects that we find to have excesses at any MIPS wavelength, Figures 1 through 4 show a fit to the star+disk SED. The excesses are modelled as simple blackbodies, which we use for an initial simple characterization of the disks, akin to an assumption of a single-temperature thin ring of dust.
In three cases (HR 1817, PZ Tel, HR 7848), we have a single data point at 70 m that describes the disk excess. For these objects, we follow the example set by Bryden et al. (2006) and simply set the peak of the blackbody to be at 70 m (41 K for ). In ten cases, we have more data (detections and limits) that describe the disk; for these stars, we have found the best-fit blackbody by minimization analysis, allowing the best-fit blackbody to run through the upper limits where available. The temperatures corresponding to those fits can be found in Table 4. Note that in the case of AG Tri A, the Fmeas/Fpred at 24 m is 1.2, so a small excess at 24 m cannot be ruled out; we modelled this star including this potentially small excess at 24 m, so it is effectively treated as a star with more than one disk detection.
Since a blackbody has two free parameters, disks with two data points describing the disk are fit perfectly by a blackbody, and this can clearly be seen in Figures 1 – 4. We do not expect a simple blackbody to be a good fit to disks with three data points, because in reality there is wavelength-dependent grain emissivity for small grains that is not accounted for in a simple blackbody, and there is likely to be dust with a range of temperatures. Clearly better models than a simple blackbody are needed to characterize the disks (see below). Nonetheless, as can be seen in Figures 1 – 4, the fits are acceptable for even the four objects ( Pic, HD 164249, Tel, and HD 181327) with excesses at all three MIPS bands, although, not surprisingly, many are not within 1 of the data points. The fit for HD 164249 is the most discrepant, running below the 70 m point (333 mJy predicted by the model, compared to 624 mJy observed) but above the 160 m point (170 mJy predicted vs. 104 mJy observed). In this case in particular, the dust distribution may well be impossible to characterize with a single temperature simple blackbody, even with grain emissivity included – for example, there may be a range of particle sizes and a large distribution of orbital radii. Indeed, spectral features have been resolved from disks around Pic, HR 7012, and Tel (Chen et al. 2006, 2007). Nevertheless, for completeness and self-consistency within the sample, we list the numbers obtained via the simple blackbody fit in Table 4.
The hottest dust found in the sample is 300 K for HR 7012. AU Mic’s disk, which is resolved by other instruments (e.g., Kalas et al. 2004, Krist et al. 2005) though not by MIPS (Chen et al. 2005), is fit by the coldest dust of any of these objects (especially among those with 160 m detections) at 50 K, which is consistent with a disk excess at 70 and 160 but not 24 m.
Although we also fit Pic, AU Mic, and HD 181327 with single blackbodies for self-consistency within the sample and for comparison here, we note that these objects are resolved at other wavelengths – Pic is resolved even at MIPS wavelengths (Su et al. 2004) and is known to not be a single-temperature narrow ring – so their disks are better characterized using other methods that take into account that spatial information.
4.2 Fractional IR excess
Since we have a wide range of spectral types represented in this association, we would like to use a measurement of the disk luminosity that attempts to compensate for the central star’s luminosity. We used the fits described above to derive a value for the fractional disk luminosity, ; these values appear in Table 4. To determine for stars which have an excess described by more than one detection, we integrate under the disk model fit, having subtracted off the photospheric contribution. In order to determine the value for stars whose excesses are only observed at 70 m, we follow Bryden et al. (2006; equation 3), determining the minimum by assuming that the blackbody continuum peaks at 70 m.
The values that appear in Table 4 for disks detected in more than one wavelength range from to 2.5, with a median value of .
4.3 Minimum Radius and Minimum Mass
Assuming that the grains composing the disks are in thermal equilibrium, we can follow a similar analysis as found in Low et al. (2005) or Smith et al. (2006) to determine a minimum radius and minimum mass of the disk. We assume blackbody dust grains in thermal equilibrium with the stellar radiation field, and contrain the inner radius of the disk along with a minimum mass of the disk. Following Low et al. (2005), we use the relationship from Chen & Jura (2001). We assume the same values for average grain size (2.8 m) and density (2.5 g cm-3) adopted there (and in Low et al. 2005 and Smith et al. 2006), despite the fact that these parameters, having been derived for Lep (an A3 star), may be more appropriate for much more massive stars than we have here on average (see additional discussion below). Values of minimum radius and minimum mass so calculated appear in Table 4. For disks detected in more than one wavelength, the minimum radius ranges from 2 to 30 AU, and the minimum mass ranges from 0.0002 to 0.06 .
4.4 Literature Models
Spitzer Infrared Spectrograph (IRS; Houck et al. 2004) observations of HD 181327, HR 7012, and Tel were discussed and modelled in Chen et al. (2006). The IRS observations extend to 33 m. The MIPS-24 m flux densities are consistent with the IRS spectra; since the Chen et al. (2006) models were designed to fit IRS spectra between 4 and 33 m, of course the models are also, by construction, consistent with our MIPS-24 m flux densities. In all three cases, these models can be extended past 33 m to predict flux densities at 70 and 160 m, and they are found to be in very good agreement with the observed flux densities.
For HD 181327, the IRS spectrum is featureless and Chen et al. model the excess as a simple blackbody, making it straightforward to compare their model parameters to ours. The blackbody temperature from Chen et al. is 81K; our blackbody temperature is 75K, which we consider to be identical to within the errors. The reported by Chen et al. is 3.1, to be compared with 2.5 derived here. The minimum mass of the disk is 4 grams in this paper and 1 grams in Chen et al.. The Chen et al. model predicts a 70 m flux density of 1.2 Jy (20% different than observations) and a 160 m flux density of 0.62 Jy (3% different than observations).
For the other two stars (HR 7012 and Tel), Chen et al. found features in the IRS spectra and constructed much more detailed, multi-component models (with various mineral species and a range of grain sizes, etc.), making comparison to parameters derived from our single-component blackbody fits relatively unilluminating. However, in order to match the overall structure of the IRS spectra found near 30 m, Chen et al. required a cooler component, up to two blackbodies of different temperatures and total solid angles. The assumptions of the models are sufficiently different from ours as to make simple comparisons difficult. These differences simply illustrate the latitude even relatively detailed models have in fitting the existing data, given the large number of parameters that can be adjusted. The one somewhat meaningful comparison is of the blackbody temperatures to fit the longest wavelength flux densities. For HR 7012, Chen et al. adopted a blackbody temperature of 200 K, versus 310 K for our models; for Tel, Chen et al. adopted two blackbodies, one of 115 K and the other of 370 K (however, the total solid angle of the 115 K component was much larger), versus our 140 K single blackbody. For HR 7012, the predicted flux densities are 0.27 and 0.072 Jy at 70 and 160 m, respectively; at 70 m, the observed flux density is 35% different from the model, and it was not observed at 160 m. For Tel, the Chen et al. predicted flux densities are 0.39 and 0.14 Jy, and our observed values are just 5 and 8% different from the model.
4.5 New Models
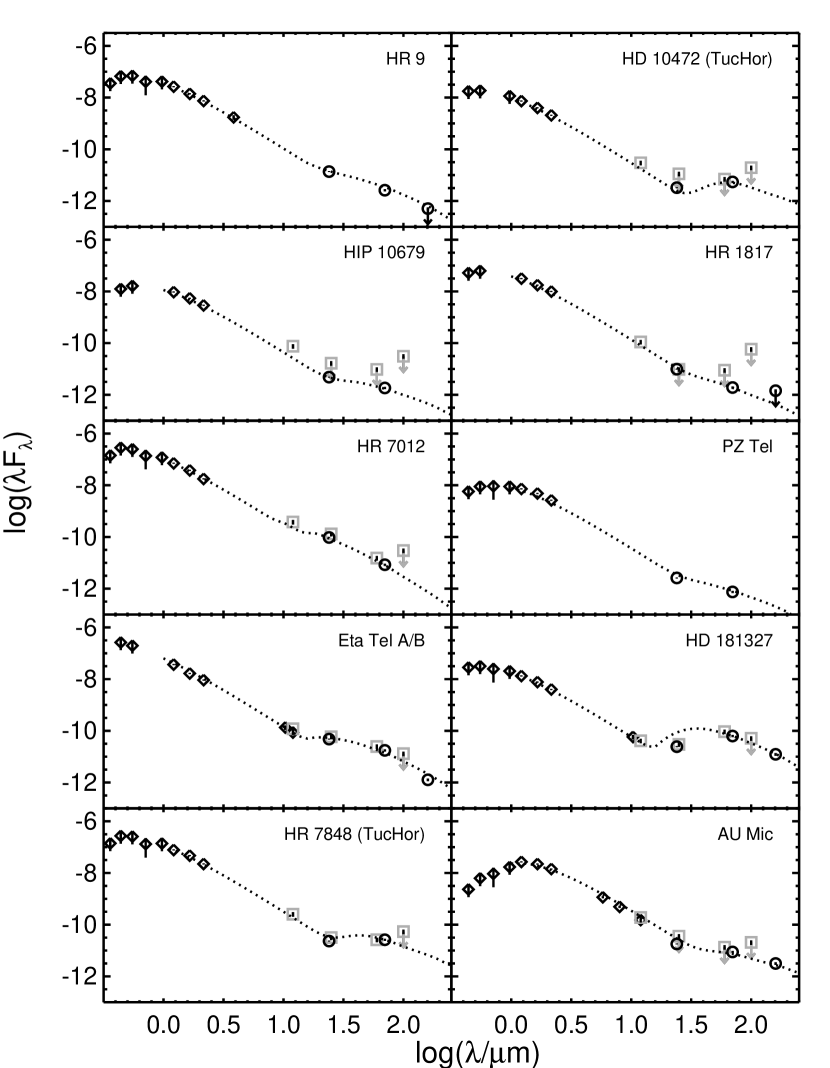
Thirteen of the 40 targets have flux excesses above photospheric levels in at least one of the MIPS bands. Of these, Pic itself, has been studied extensively in the literature (most recently Chen et al. 2007), and we consider it no further here. We have fit the data points as portrayed in Figures 1-4 for the remaining twelve systems using continuum spectra computed in each case for an axisymmetric and optically thin disk of astronomical silicate grains in radiative equilbrium with the stellar field. The models are described further in Mannings et al. (in prep); below, we summarize the characteristics of the models.
4.5.1 Model Description
We assume grain radii distributed as a power law from 0.001 microns to 1 mm. The index of the continuous power law distribution in grain size is here fixed at 2.5, leading directly from the index of 3.5 for the number of grains per unit size interval described in the clasic study of interstellar grains by Mathis, Rumpl & Norsieck (1977). Optical constants are taken from Draine (2007) for the smaller grains. We compute absorption efficiencies for the larger grains by modifying the Mie code developed by Bohren and Huffman (1983). We then distribute the grains across a disk geometry assuming a surface density viewed normal to the disk plane that falls off as a power law from an inner disk radius to an outer radius, . (See Sylvester & Skinner 1996 for similar modelling of debris disks.) The power law index for the radial density distribution is held at the typical value of assumed for circumstellar disks (e.g., Kenyon & Bromley 2002). The disk inclination angle is irrelevant for optically thin emission, as is the (likely) non-zero opening angle of the disk as viewed from the star. The remaining disk parameter is simply the total mass of grains, . To limit the number of free parameters (since in several cases we have but one point defining the disk), we fix all quantities with the exception of , , and . These three parameters dominate in different wavelength regimes, so we are able to hone in on a unique fit despite the sparseness of the data. To first order, the value of establishes, for a fixed range of grain sizes, as in this model, the wavelength at which the disk spectrum exhibits a peak, while determines the luminosity of the disk. The spectrum is relatively insensitive to . Increasing the value of relative to is akin to spreading the grains out to greater distances from the star but, since the radial density falls as a power law, the effect on the total spectrum is marginal. It can be perceived as a gentle softening of the ratio of the total flux emitted by warm grains (inner disk) and cool grains (outer disk). We show our model SEDs in Figure 8.
4.5.2 Model Results and Comparison
The best fit values are listed in Table 4 for , and , as derived using these models and the optical+near IR+MIPS data that appear in Figures 1-4. Disk masses range from about 0.05 to 30 Lunar masses. Disk inner radii take values from 5 to 400 AU, and outer radii range from about 100 to 700 AU. The median fractional difference between the model and the observations at 24 m is 0.12, including the value from HD 181327, which is the most discrepant at 24 m (see Figure 8, and discussion below). The closest fit is HIP 10679, where the model matches the observations to 3%. Given that the systematic uncertainty of our 24 m observations is 4%, the model is then typically off at 24 m. At both 70 and 160 m, the median fractional difference between the model and observations is just 0.04, well within the systematic uncertainty at either band.
The simpler models calculated following Low et al. (2005) in Section 4.3 above (hereafter abbreviated as “Model 1”), not surprisingly, produce much different values of disk masses and radii than those calculated here. The models from Mannings et al. (hereafter abbreviated “Model 2”) are more complex; both Models 1 and 2 are physically valid within the limitations of their own set of assumptions, which we now discuss.
Model 1, in order to calculate the minimum disk mass and inner minimum disk radius, must make simple assumptions about the grain size (2.8 m) and density (2.5 g cm-3), and assume that the grains radiate as blackbodies. These assumptions trace back to Chen & Jura (2001), who studied an A3 star, Lep; they took 2.8 m for grain size because grains smaller than this would be ejected from the system due to radiation pressure. This is not a universally valid assumption for these BPMG stars (or for that matter for the TWA stars from Low et al. 2005), because there are much cooler M stars included in both BPMG and TWA. But, such calculations nonetheless serve to provide a rough comparison between star-disk systems across papers and associations.
Model 2 obtains such different results for disk masses and sizes for a variety of reasons, all traced back to grain size and location assumptions. Model 2 assumes that each disk is a power-law mixture of grain sizes (from ISM size to 1 mm), and that the mixture is spread out across the disk (not in a thin ring). Most of the grains are a factor of 3000 smaller in radius than that assumed in Model 1, and the grain emission is not blackbody. Small non-blackbody grains tend to be hotter than larger (e.g., blackbody) grains at the same distance from a star, so the small grains must be further out to get lower temperatures and, therefore, similar fluxes. That in part accounts for the Model 2 disk inner radii being larger than those of Model 1. (Moreover, the radii from Model 1 are artificially reduced by the assumption that the particles radiate like blackbodies at the temperatures or wavelengths of interest, which is almost certainly not the case as even 3 m particles are small compared to the relevant wavelengths.) Because Model 2 has larger disk radii, a much larger amount of dust area is needed to subtend a given solid angle to absorb the stellar light and match the observations. The Model 2 disk masses are larger than those of Model 1 for two reasons. First, because the best-fit inner disk radii are larger than the Model 1 values, a greater amount of integrated grain surface area is needed in Model 2 to subtend a similar total solid angle, as viewed from the star, to that for Model 1. Second, due to the power-law distribution in grain sizes, a significant amount of disk mass is locked up in the large end of the size range, while the absorption and re-emissison of starlight is dominated by grains at the small end. The small grains contribute negligibly to the disk mass, but they dominate the radiative transfer and, therefore, the output spectrum.
4.5.3 Notes on models of specific sources
For HD 181327, the inner and outer radii were fixed at the values reported by Schneider et al. (2006), despite the fact that those parameters were obtained from wavelengths shorter than 24 m. Only the mass was left as a free parameter in our model fit. This (plus the other constraints imposed) explains why the predicted model flux density at 24 m is so different than the observed flux density (see Figure 8, and below).
Two of the twelve sources with flux excesses cannot be fit with model disk spectra: AG Tri A and HD 164249. The MIPS detections for these latter targets could include background sources that cannot be distinguished from the target stars, but as we argue above, this is relatively unlikely, 1%. It is more likely that some of the fixed parameters need to vary, and that measurements are needed at other wavelengths to constrain the models. Both of these objects are also not particularly well-fit by the simple blackbodies above. HD 164249 was called out as a particularly poor fit above; with the more sophisticated modelling (given the constrained parameters above), the 24 m excess can be fit, but the 70 m model is well below the observed flux. AG Tri A’s simple blackbody fit above runs through the upper limit at 160 m, and if the true flux of the system is really much lower, the simple fit will not work either.
4.5.4 Testing the simple models by including IRS data
Three stars have IRS spectra as noted above and as reported in Chen et al. (2006) – Tel, HD 181327, and HR 7012. (Additional IRS spectra for several more BPMG stars exist in the Spitzer Archive, but analyzing those data is beyond the scope of this paper.) As a simple way of assessing the limitations of the simple models performed above that primarily rely on the MIPS data in the mid- and far-IR, for Tel, HD 181327, and HR 7012, we included the IRS data and then attemped an unconstrained Mannings et al. model fit, e.g., letting all of the parameters vary. Plots of these fits (including the IRS data from Chen et al. 2006) appear in Figure 9.
For Tel, the constrained model fit above slightly underpredicts the 70 m flux density (by 17%) while slightly overpredicting the 160 m flux density (by 10%). In order to fit the IRS data as well, the best model fit now brings the inner radius in from 70 to 30 AU, and the disk mass from 0.8 to 0.3 .
For HD 181327, the constrained model fit above predicts a higher 24 m flux than is observed. In order to allow the model to fit the IRS+MIPS data together, but still leave the inner disk radius constrained to that reported by Schneider et al. (2006), we increased the minimum grain size from 0.001 m to 1 m, so the grains are distributed as a power law from 1 m to 1 mm. The model matches the IRS spectrum very well, eliminating the discrepancy at 24 m, but slightly underpredicting (by 17%) the 70 m flux while slightly overpredicting (by 10%) the 160 m flux. The disk mass increases from the 9 reported above to 11 .
Finally, for HR 7012, the best-fit disk mass is identical to the fit as reported above (0.05 ) and the inner disk radius changes from 5 to 3.5 AU, not a significant change. The model replicates well the emission features observed near 10 and 20 m, so the grains in this disk could be silicate or have a large silicate component, as reported by Chen et al. (2006).
| cluster/ass’n | age | 24 m disk fraction | 70 m disk fraction | reference |
|---|---|---|---|---|
| Upper Sco F&G | 5 Myr | 1/5, 20% (20%) | 0/5, 0% (20%) | Chen et al. (2005a) |
| Cha | 8 Myr | 9/16, 56% (18%) | 5/15, 33% (15%) | Gautier et al. (2008) |
| TW Hya | 8 Myr | 7/23, 30%aaTWA 24 m infrared excess fraction reassessed here; see text for discussion. (11%) | 6/20, 30% (10%) | Low et al. (2005) |
| UCL & LCCbbInner and outer radii are fixed at the values reported by Schneider et al. (2006). F&G | 10 Myr | 12/35, 34% (10%) | 7/35, 20% (7%) | Chen et al. (2005a) |
| BPMG | 12 Myr | 7/30, 23% (9%) | 11/30, 37% (11%) | this work |
| Tuc-Hor | 30 Myr | 1/9, 11% (11%) | 8/31, 26% (10%) | Smith et al. (2006), |
| combined with this work | ||||
| NGC 2547 | 25 Myr | 25% | … | Young et al. (2004) |
| IC 2391 | 50 Myr | 6/26, 23% (9%) | … | Siegler et al. (2006) |
| Pleiades | 100 Myr | 9/54, 17% (5%) | none detected | Gorlova et al. (2006), |
| Stauffer et al. (2005) | ||||
| M47 | 100 Myr | 8/63, 13% (5%) | … | Gorlova et al. (2004) |
| Hyades | 650 Myr | 0/6, 0% (2%) | … | Rieke et al. (2005) |
| field | 4000 Myr | 1/69, 1% (3%) | 7/69, 10% (4%) | Bryden et al. (2006) |
5 Discussion
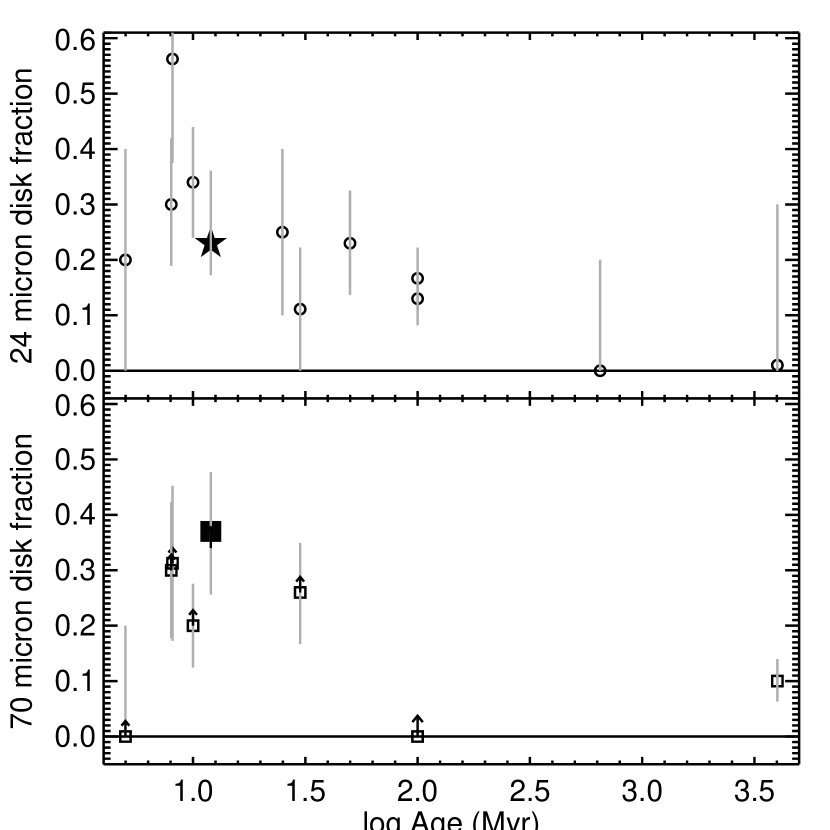
Based on the standard paradigm, the stars in the BPMG are expected to have a lower disk frequency and smaller infrared excesses than found in younger stars, and to possess a higher disk frequency and larger excesses than older stars. Our results follow those expectations at both 24 and 70 m; Figure 10 plots our 24 and 70 m disk (excess) fractions in context with several other determinations from the literature, which can also be found in Table 5. After a brief discussion of some minor issues, we now discuss our study in context with other studies in the literature.
Because these disks are likely to evolve such that the infrared excesses disappear from the “inside-out” (e.g., Su et al. 2006) it is important to consider the wavelength dependence of the disk fraction being considered. Since the sensitivity of the 70 m array does not allow for detections of the stellar photospheres for most stars, it is difficult to obtain an unambiguous definition of the disk fraction at this wavelength. Essentially all studies, therefore, quote a lower limit to the true 70 m disk fraction in clusters or associations. The error bars shown in Figure 10 and listed in Table 5 are derived from Poisson (counting) statistics. Note too that there are relatively large uncertainties on the ages of these clusters and associations. Finally, we note that several of our stars as considered here are unresolved binaries. We have made no attempt to distinguish binaries as a separate population from single stars here, nor to apportion the flux between the companions, but we have listed known binarity in Tables 1-3. Given the distance of the BPMG and the MIPS resolution, unresolved binaries must have a separation of 200 AU. The results of Trilling et al. (2007) suggest that the evolution of such circumbinary disks is roughly comparable to that of single stars, so including unresolved binaries as single stars should not significantly change Figure 10.
There are three associations in Table 5 thought to be younger than the BPMG: Upper Sco ( 5 Myr), the TW Hydra Association (TWA; 8-10 Myr), and the Chamaeleon association (5-9 Myr). All three of these associations have larger 24 m disk fractions in the literature (Chen et al. 2005a, Low et al. 2005, Gautier et al. 2008, respectively) than we find for the BPMG, consistent with expectations. (Admittedly, the Upper Sco sample includes only about 5% of the likely members of this association, so there is a large uncertainty on the disk fraction compared to what future investigators are likely to conclude.) Low et al. (2005) find for TWA that there are very large excesses around four of the TWA stars, with possibly a subtle 24 m excess around one more of the stars. We have re-reduced their MIPS data in exactly the same fashion as here in the BPMG, and find, as did Low et al., that many of the measurements are consistent with photospheres. We were able to measure 24 m fluxes for 23 objects, some of which are components of wide binary systems. We confirm the 4 large excess objects (TWA 1, 3, 4, 11), as well as the small excess found in TWA 7, but also, using the same criteria as for the BPMG, that 8b and 19 are also likely to harbor circumstellar disks. Thus, to aid in direct comparison with our BPMG data, we have taken the TWA disk fraction at 24 m to be 7/23 stars, or 30%. The largest excess objects in TWA have [24]4 (5.8, 5.0, 4.4, and 4.4 for TWA 1, 3, 4, and 11, respectively, with Fmeas/Fpred= 160, 69, 51, and 58). The reddest object we have is Pic itself, with [24] of only 3.5, well below the 4 extreme TWA stars. The three TWA stars with more moderate excesses, TWA 7, 8b and 19, have [24]= 0.70, 0.75 and 0.30, respectively. (The Fmeas/Fpred values we calculate are 1.4, 1.3, and 1.3, respectively.) In terms of the 70 m disk fraction, the numbers obtained for Upper Sco, TWA, Cha, and BPMG are all consistent, within 1- uncertainties, with having a constant disk fraction. The one disk candidate from the Chen et al. (2005a) Upper Sco sample has . The values for for TWA range from 0.27 to (Low et al. 2005), and in Cha, they range from 0.019 to (Gautier et al. 2008); both of these clusters have larger values than those we find here in the BPMG (10-250).
The estimated age of the Upper Centarus-Lupus (UCL) and Lower Centaurus-Crux (LCC) associations has been taken to be 15-20 Myr (e.g., Chen et al. 2005a), but is more recently set at 10 Myr (Song et al. submitted), which we adopt here. The ages of those clusters are roughly comparable to that of the BPMG. Both the 24 and 70 m disk fractions found in F and G stars from UCL & LCC are within 1- of the disk fractions found in the BPMG, despite the fact that our BPMG disk fractions include more stars than just F&G. The values found in UCL & LCC range from , comparable to the range we find in the BPMG.
Tucanae-Horologium (20-40 Myr) and NGC 2547 (25 Myr) are thought to be slightly older than the BPMG. Membership in NGC 2547 (Young et al. 2004) is not as well-established as it is for other objects in Table 5. The 24 m disk fraction is consistent with that for the BPMG, and the 70 m disk fraction is not reported. Working in a sample of nearby solar-type young stars (including several from but not limited to Tuc-Hor), Smith et al. (2006) find that just 19 of their overall 112-star sample (17%) have 70 m detections at all. Of the 22 stars in the Tuc-Hor association included in the Smith et al. sample, 8 are detected, and 6 are determined to be greater than photospheric, or a lower limit on the disk fraction of 27%. We can combine these stars with the 9 Tuc-Hor stars from the present work, obtaining a 24 m disk fraction of 1/9 (11%), and a 70 m disk fraction of at least 8/31 (26%). Within small-number statistics, the Tuc-Hor disk fractions at both 24 and 70 m are indistinguishable from those obtained here in the BPMG.
There are 4 clusters, in addition to field stars, older than the BPMG in Table 5. The 24 m disk fraction reported by Siegler et al. (2006) for IC 2391 (50 Myr) is comparable to that for the BPMG. The disk fractions from the Pleiades and M47 (100 Myr; Gorlova et al. 2006, 2004) are only marginally lower than that inferred for the BPMG. The BPMG disk fraction is significantly higher than that for the Hyades (Rieke et al. 2005) or field stars from the solar neighborhood (Bryden et al. 2006). The Bryden et al. (2006) study found just one 24 m excess out of 69 stars. Detections (of disks or photospheres) are harder at the distances of most of these older clusters; in the Pleiades, no disks are seen at 70 m, although the background is quite high (Stauffer et al. 2005). For the old (4000 Myr) field stars in Bryden et al. (2006), 10% of their 70 star sample has 70 m disks. The values reported by Bryden et al. (2006) range from , lower than what we find in the BPMG (or even could have detected). Our results are consistent with the trend that the disk fraction and brightness falls with time.
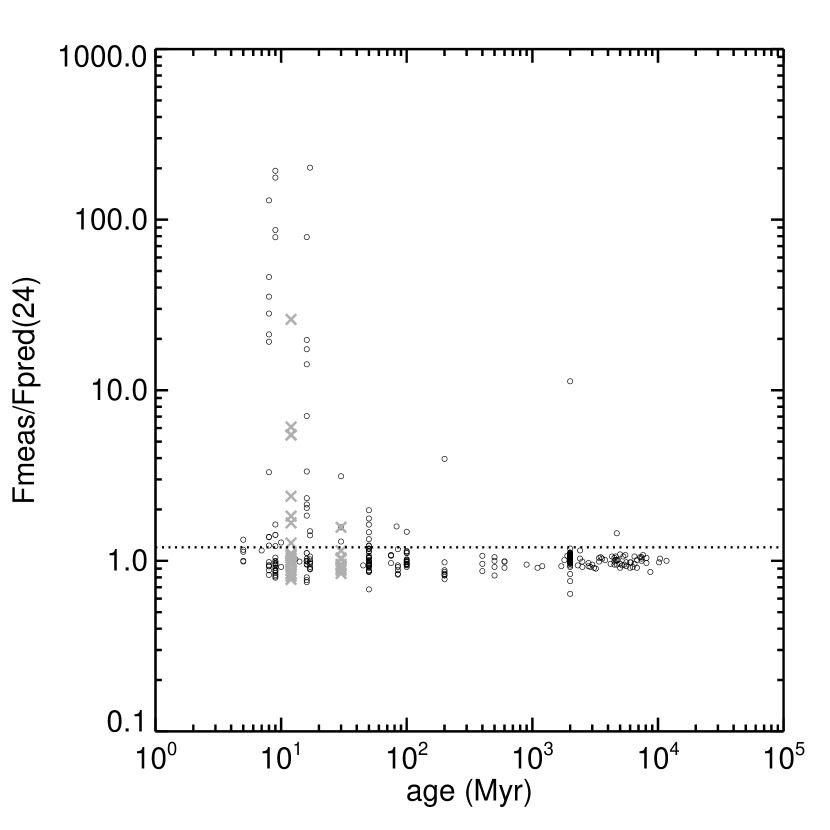
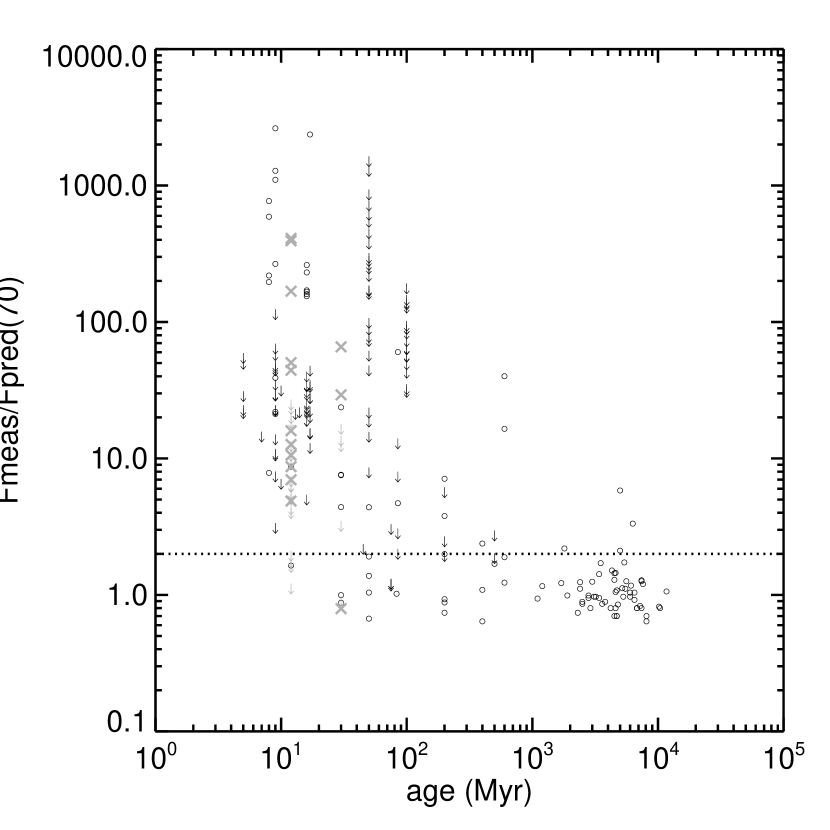
In considering these disk fractions, we have grouped together stars of a range of masses in order to increase the number of stars considered at each age; for example, the BPMG disk fraction includes stars from A to M. However, disk evolution is probably stellar-mass-dependent (e.g., Carpenter et al. 2006), and certainly measured colors are mass-dependent (as discussed above; see Figure 6). Besides , another way that we might attempt to compensate for the range of spectral types is to use the ratio of measured to predicted flux densities. Figure 11 and 12 present the ratios of predicted to measured flux densities for 24 and 70 m for our stars and, where possible, values from the literature for individual stars (Bryden et al. 2006; Chen et al. 2005a,b; Gautier et al. 2008; Kim et al. 2005; Low et al. 2005; Siegler et al. 2007; Smith et al. 2006; Stauffer et al. 2005). Where previous work has not reported a predicted flux density for each star, we have calculated the predicted flux densities by the same methodology as above for each star (finding the nearest grid point in the Kurucz-Lejeune model grid for a given spectral type and interpolating to the MIPS effective wavelengths). The upper envelope found in these figures is similar to the 24 m upper envelope found by Rieke et al. (2005) or Su et al. (2006) for 24 m excesses around A stars, or at 70 m by Su et al. (2006). The range of excess strengths found at any age could be a result of initial conditions, rates of evolution, or recent collisional events; there is no obvious way to determine the origin from these data alone. Currie et al. (2008) report seeing the decline of primordial disks and the rise of debris disks; this reinforces the importance of further study of stars with a range of excesses in the 8-10 Myr age range, specifically the need for high-quality complete disk fractions.

Figure 13 shows [24] vs. [70] for the objects considered here. It is clear not only which stars with excesses in one band also have excesses in the other band, but also very roughly the correlation of the size of the excess (with all the caveats about spectral type dependence discussed above). The MIPS measurements of Hya are consistent with a purely photospheric origin for its IR flux. Of the 8 stars identified above as having any excesses at 24 m, all also have clear excesses at 70 m. All four objects with the largest 24 m excesses also have large 70 m excesses. Five additional stars are detected as having excesses at 70 m, but without significant excesses at 24 m. For the stars with disk excesses at 24 m, the median [24] is 0.99 magnitudes; for those same stars, the median [70] is 4.5 magnitudes, significantly redder.
A disk may be inferred to have an inner hole if it has an infrared excess at long wavelengths but not at short wavelengths, such as these stars with signficant 70 m excess and very small 24 m excess. By this definition, the majority of debris disks around older main sequence FGK stars possess inner holes (29 of 37 disks; Trilling et al. 2008), whereas only 8/44 debris disks around younger A stars do (Su et al. 2006). At ages of a few Myr, the circumstellar disks found in star-forming regions have a very low MIPS inner hole frequency (Rebull et al. 2007; Harvey et al. 2007; Young et al. 2005). MIPS studies of young associations such at the BPMG provide a key bridge between the massive, young disks that generally lack inner holes, and the older, tenuous debris disks that often possess them. At age 8 Myr, the TW Hya and Cha groups show very few disks with MIPS inner holes (1/6 disks from TWA, Low et al. 2005 and reduction above, and 0/5 disks from Cha, Gautier et al. 2008). These young associations also possess a mixed population of disks with fractional infrared luminosities near 0.1 (characteristic of massive primordial disks, such as that of TW Hya) and 0.001 (characteristic of optically thin debris disks, such as that of Pictoris). None of the stars with disks in the larger Sco-Cen association (part of which is age 5 Myr and the rest of which is age 10 Myr) possess MIPS inner holes (Chen et al. 2005a). The 12 Myr old BPMG (this work) contains only optically thin disks, with 4/11 disks possessing MIPS inner holes (note that we are including AG Tri A, since it has a proportionally much larger 70 m excess than any potential small 24 m excess). In the 30 Myr old Tuc-Hor association, 6/8 stars with disks have inner holes (this work, combined with Smith et al. 2006). A smooth increase of inner hole frequency with time is evident, and although small number statistics prevent strong conclusions, it is clear that the BPMG is the youngest stellar group in which the frequency of MIPS inner holes is clearly larger than that seen in the pre-main sequence stellar population. What is seen in the BPMG and these other clusters is consistent with expectations based on other clusters that stars lose their 24 m excesses before their 70 m excesses (“inside-out”; e.g., Su et al. 2006).
| star | (km s-1) |
|---|---|
| HIP 10679 | 7.8 |
| HIP 12545 | 9.3 |
| GJ 3305 | 5.3 |
| HIP 23309 | 5.8 |
| GJ 3322 A/B | 7.7 |
| AO Men | 16 |
| V343 Nor A/B | 11 |
| V824 Ara A/B | 37 (companion 34) |
| CD-64D1208 A/B | 102.7 |
| PZ Tel | 63 |
| AT Mic A/B | 10.6 (companion 17) |
| AU Mic | 8.5 |
| AZ Cap A/B | 14.6 |
| WW PsA A | 14.0 |
| WW PsA B | 24.3 |

The G, K, and M stars in at least some clusters that are much younger than the BPMG, 1-5 Myr old, exhibit a correlation between rotation and infrared excess in that slower rotators are more likely to have infrared excesses, or disks (see, e.g., Rebull et al. 2006 and references therein). This agrees with theoretical expectations in that the young lower-mass GKM stars are thought to have strong magnetic fields that thread the (primordial) circumstellar disk, mediating accretion and locking the rotation of the star to that of the disk. However, by the 12 Myr age of the BPMG, and at the distances from the parent star of these disks emitting at 24 and 70 m, no disk locking is expected to still be operating. In Figure 14, we examine the correlation of disk excess with rotation rates for the G, K, and M BPMG members. (The values used for these stars appear in Table 6.) The faster-rotating lower-mass stars in the BPMG in Figure 14 show a weak tendency to have a smaller disk excess. While certainly not conclusive, these figures are suggestive. Additional and rotation period determinations would be useful to test this correlation, as well as additional Spitzer measurements in other similarly aged clusters. Interestingly, Stauffer et al. (2007) find a similar correlation between 24 m excess and seen in open clusters primarily from the FEPS program (Formation and Evolution of Planetary Systems; Meyer et al. 2006) and the Pleiades. Given that all of our disk candidates in the BPMG now posess at best tenuous debris disks, the disk mass is insufficient (now) to regulate the stellar angular momentum as in the case of massive primordial disks. Perhaps these disks started out as more massive than the other BPMG members. Perhaps the disk dispersion timescale, which determines whether or not a disk still persists at 12 Myr, is set early on in the lifetime of the disk, when the angular momentum and mass flux through the disk is the highest, the central object is large, and the influence of disk locking (or braking) is the strongest. In that case, the weak correlation seen in Figure 14 is the signature of a process operating at earlier times.
Alternatively, strong stellar winds could play an important role in clearing the disk of small particles, as suggested by Plavchan et al. (2005) and Chen et al. (2005a). Rapid rotation, which enhances the stellar dynamo and presumably the strength of the stellar wind, would then be associated with more tenuous disks as suggested by the data in Figure 14. Wind ablation of dust could be an ongoing process.
We see no obvious way to test for whether winds (operating now and/or in the past) or disk locking (operating in the past) are more likely using these data; clearly these initial results will need future observational follow-up, such as the use of periods rather than , and a search for similar effects in other similarly-aged clusters. We emphasize again for clarity that the correlation seen in Figure 14 is only for the GKM stars in the BPMG.
6 Conclusions
We have presented here MIPS 24 and 70 m observations of 30 stars or star systems in the BPMG, as well as nine from Tucanae-Horologium, with 160 m observations for a subset of 12 BPMG stars. In several cases, the new MIPS measurements resolve source confusion and background contamination issues in the previous IRAS data.
We found that 7 BPMG members have signficant 24 m excesses, or a disk fraction of 23%. Eleven BPMG systems have significant 70 m excesses (disk fraction of 37%, as this is a lower limit). Five exhibit 160 m excesses, out of a biased sample of 12 observed, and they have a range of 70:160 micron flux ratios. The disk fraction, and the size of the excesses measured at each wavelength, are both consistent with an “inside-out” infrared excess reduction scenario, wherein the shorter-wavelength excesses disappear before longer-wavelength excesses, and consistent with the overall decrease of disk frequency with stellar age, as seen in Spitzer studies of other young stellar groups.
We characterized the disk properties using simple models and fractional infrared luminosities. Optically thick disks, seen in the 8 Myr age TW Hya and Cha associations, are entirely absent in the BPMG at age 12 Myrs.
Appendix A Comments on individual objects
These comments on individual objects address the issues of (possibly) resolved objects, serendipitous detections, IR cirrus, and multiple systems. In some cases, the proximity of a true companion and/or infrared cirrus results in the low-spatial-resolution IRAS fluxes being anomalously high when compared with the MIPS fluxes. All of those instances are discussed here.
In several cases, objects in close proximity to the target object were detected. Since these objects are bright enough to be detected in these shallow observations, these additional objects are also potential association members, and/or contributors to source confusion in lower spatial resolution observations such as IRAS. Based on the MIPS measurements, we conclude none are association members; see individual discussion below.
A.1 HIP 3556 (Tuc-Hor)
At 24 m, there are several objects easily visible besides the target, with several being of comparable brightness to the target. Two of them are easily visible in the 70 m image whereas HIP 3556 is undetected. Few of them have obvious counterparts in a POSS or 2MASS image. Given their evidently steeply rising SEDs, we suspect that they are background galaxies.
A.2 Eri (Tuc-Hor)
Spitzer observations of Eri clearly detect it in 24 m to be 173 mJy; there is an emission peak at this location at 70 m, but it is comparable in size to the noise fluctuations found in this region, so it is listed as an upper limit in our study. The upper limit falls right on the expected photospheric flux.
There is a nearby source 90 away at 02h16m30.6s, -51d30m44s, measured to be 12.3 mJy (at 24 m) . This object is not detected at 70 m, but it is detected in 2MASS with =4.13 mag. The resultant [24] color suggests that it is far too blue to be a star, but the PSF as seen in POSS plates appears stellar. This source is probably not a new association member.
A.3 HD 14082 and HIP 10679
HIP 10679 and HD 14082 are close enough to each other () to be observed in the same MIPS photometry field of view. Both objects are point sources at 24 m and have comparable fluxes at this bandpass. At this separation, these objects should be distinguishable at 70 m, but only one object is detected. Based on the central position of the object, we have assigned the measured flux to HIP 10679. This is a weak detection, with a signal-to-noise ratio of only 5. The PSF appears to be elliptical, with the major axis roughly a factor of twice the minor axis. It is not extended in the direction of the companion, or in the direction of the scan mirror motion. While it is possible that the object is truly resolved at 70 m, the fact that it is not resolved at 24 m leads us to suspect that the apparently elliptical PSF is instrumental in nature. The object is so faint as to not be easily detectable in subsets of the data, so it is difficult to assess whether or not co-adding the data has caused this effect.
A.4 GSC 8056-482 (Tuc-Hor)
While only one BPMG object is expected to be included in this observation, several fainter objects are clearly detected in the 24 m image. The closest and brightest one to GSC 8056-482 is 23 away, located at 02h36m49.1s, -52d03m12.3s, and is measured to be 2.0 mJy. It is not detected in 2MASS or at 70 m.
A.5 HR 6070
HR 6070 appears in the IRAS PSC (but not the FSC) as a detection at all IRAS bands with coordinates slightly offset to the northwest from the optical position. However, the MIPS observations reveal an isolated point source with lower flux measured at 24 m and an upper limit at 70 m that is comparable to the detection reported by IRAS. The 24 m image reveals clear cirrus on the northwest side of the image, in the same direction as the reported center of the IRAS source, suggesting that the measured IRAS flux is contaminated by infrared cirrus. If all of the flux attributed to the point source in the IRAS catalog were really coming from the point source, we would have detected it, but we did not. The MIPS observations provide a much better understanding of any infrared excess present in this star, suggesting no excess at 24 m and providing a constraint at 70 m.
A.6 V824 Ara A, B, & C
This triple system, located all within an arcminute, was also unresolved by IRAS. MIPS can clearly separate C from A/B at 24 m, but no objects are detected at 70 m. IRAS’s beam size encompasses all three of these components. MIPS resolves the source confusion and does not find an IR excess in A/B or C.
In addition to the components of this system, MIPS sees two additional objects, neither of which are seen at 70 m. Neither of these objects have a [24] color suggestive of an excess.
A.7 HD 164249
In the 24 m image for HD 164249, three objects are present, two of which are also seen at 70 m. (None of the objects are seen in our 160 m data.) The target of the observation is clearly apparent in both 24 and 70 m, and a second object appears 0.76 away with a 24 m flux of 1220 mJy and a 70 m flux of 172 mJy. A third faint object 1.4 away has a 756 Jy flux at 24 m. Both of these objects appear in the 2MASS catalog. The brighter object has a [24] color of 7.4; the fainter object has [24]=0.002. The latter is a photosphere with arguably no excess whatsoever at 24 m. This, combined with its overall faintness, suggests it is probably a background star. The former appears as a very faint smudge on POSS plates and has a clear elliptical shape in 2MASS images. The object appears in the 2MASS extended source catalog as a galaxy with name 2MASXJ18030752-5139225. It likely has influenced the measured flux for HD 164249 in lower spatial resolution measurements.
A.8 HR 6749/HR 6750
This binary system is unresolved by MIPS. IRAS measures a detection at all 4 bands suggesting an infrared excess and therefore circumstellar dust. MIPS is able to resolve apparent source confusion, placing the 24 m point at a photospheric level and putting constraints on the 70 m flux. The 24 m image suggests that there may be infrared cirrus that contributed to the measured IRAS flux; any background flux is not very bright at MIPS-24 (while MIPS has much more sensitive detectors that IRAS, it also samples much smaller angles on the sky, so the surface brightness sensitivity is not substantially different than IRAS). At 70 m, if all of the flux attributed to the point source in the IRAS catalog were really coming from the point source, we would have detected it, but we did not.
A.9 AT Mic
This object is detected at 24 m, but not at 70 m. There is another object at 24 m that is 1.5 away at 20h41m55.4s, 32d24m57s, with a 24 m flux of 2.8 mJy. This object has a [24] color of 0.02, which is not indicative of any excess.
A.10 Resolved objects
We note for completeness that at least three objects in the BPMG, Pic itself (e.g., Golimowski et al. 2006), AU Mic (e.g., Graham et al. 2007), and HD 181327 (e.g., Schneider et al. 2006), are known to be resolved at other wavelengths. AG Tri A may be resolved as well (Ardila et al. 2007 in prep). Of these, Pic itself is the only one known to be resolved at MIPS wavelengths (Su et al. in preparation, see also Chen et al. 2007); the others, if they are resolved at MIPS wavelengths, are only subtly larger than the instrumental PSF. All of these famous objects are extensively discussed elsewhere, so we do not discuss them again here.
References
- (1) Ali, B., et al., 2005, BAAS, 37, 1409 (#150.05)
- (2) Ardila, D., et al., 2007 in prep
- (3) Barrado y Navascues, D., et al., 1999, ApJL, 520, 123
- (4) Beichman, C. A., et al., 1988, IRAS catalog and explanatory supplement
- (5) Beichman, C. A., et al., 2006, ApJ, 639, 1166
- (6) Bohren, C.F. & Huffman, D.R. 1983, Absorption and Scattering of Light by Small Particles, Wiley, New York
- (7) Bryden, G., et al., 2006, ApJ, 636, 1098
- (8) Carpenter, J, et al., 2006, ApJ, 651, 49
- (9) Chen, C., et al., 2005a, ApJ, 623, 493
- (10) Chen, C., et al., 2005b, ApJ, 634, 1372
- chen (6) Chen, C., et al., 2006, ApJS, 166, 351
- chen (7) Chen, C., et al., 2007, ApJ, in press, astro-ph 0705.3023
- (13) Currie, T., et al., 2008, ApJ, in press, astro-ph 0709.2510
- (14) Dole, H., et al., 2004, ApJS, 154, 87
- (15) Draine, B. T. 2007 http://www.astro.princeton.edu/draine
- (16) Engelbracht, C., 2008, PASP, in press
- (17) Fazio, G. et al., 2004, ApJS, 154, 10
- (18) Feigelson, E., et al., 2006, AJ, 131, 1730
- (19) Gautier, N., et al., 2007, ApJ, 667, 527
- gautier (2) Gautier, N., et al., 2008, ApJ, submitted
- (21) Gillett, F., 1986, in Light on Dark Matter, ed., F. P. Israel (Dordrecht: Reidel), 61
- (22) Golimowski, D., et al., 2006, AJ, 131, 3109
- (23) Gordon, K., et al., 2005, PASP, 117, 503
- gordon (2) Gordon, K., et al., 2008, PASP, in press
- gorlova (04) Gorlova, N., et al., 2004, ApJS, 154, 448
- gorlova (06) Gorlova, N., et al., 2006, ApJ, 649, 1028
- (27) Graham, J., et al., 2007, ApJ, 654, 595
- (28) Harvey, P, et al., 2007, ApJ, 663, 1139
- (29) Houck, J., et al., 2005, ApJS, 154, 18
- (30) Houk, J., et al., 1982, Michigan Spectral Survey, volume 3, Ann Arbor, University of Michigan (1982 MSS, C03, 0)
- (31) Jayawardhana, R., et al., 2006, ApJ, 648, 1206
- (32) Kaisler, D., et al., 2004, A&A, 414, 175
- (33) Kalas, P., et al., 2004, Science, 303, 1990
- (34) Kenyon, S.J. & Bromley, B. C. 2002, ApJ 577, L35
- (35) Kim et al., 2005, ApJ, 632, 659
- (36) Krist, J., et al., 2004, AJ, 129, 1008
-
krist (2)
Krist, J., 2005, STinyTim release notes,
http://ssc.spitzer.caltech.edu/archanaly/contributed/stinytim/index.html - (38) Lejeune, T., Cuisinier F., & Buser R. 1997, A&AS, 125, 229
- lejeune (2) Lejeune, T., Cuisinier F., & Buser R. 1998, A&AS, 130, 65
- (40) Low, F., Smith, P.S., Werner, M., Chen, C., Krause, V., Jura, M., & Hines, D., 2005, ApJ, 631, 1170
- (41) Makovoz, D., & Marleau, F. 2005, PASP, 117, 1113
- (42) Mamajek, E., et al., 2004, ApJ, 612, 496
- (43) Mathis, J.S., Rumpl, W. & Nordseick, K. H. 1977, ApJ 217 425
- (44) Meyer, M., et al., 2006, PASP, 118, 1690
- meyer (2) Meyer, M., et al., 2007, in Protostars and Planets V, B. Reipurth, D. Jewitt, and K. Keil (eds.), University of Arizona Press, Tucson, page 573
- (46) Moshir, M., Kopman, G., Conrow, T., IRAS Faint Source Survey and Explanatory Supplement
- (47) Paresce, F., & Burrows, C., 1987, ApJ, 319, 23
- (48) Parsons, S. B., Buta, N. S., Bidelman, W. P., 1996, VisieR On-line Data Catalog: VI/32, 6032
- (49) Plavchan, P., Jura, M., & Lipscy, S.J., 2005, ApJ, 631, 1161
- (50) Rebull, L., et al., 2006, ApJ, 646, 297
- (51) Rebull, L., et al., 2007, ApJS, 171, 447
- (52) Rieke, G., et al., 2004, ApJS, 153, 25
- rieke (2) Rieke, G., et al., 2005, ApJ, 620, 1010
- (54) Schneider, G., et al., 2006, ApJ, 650, 414
- (55) Siciliar-Aguilar, A., et al., 2006, ApJ, 638, 897
- (56) Siegler, N., et al., 2007, ApJ, 654, 580
- (57) Skrutskie, M., et al., 2006, AJ, 131, 1163
- (58) Smith, P.S., Hines, D., Low, F., Gehrz, R., Polomski, E., & Woodward, C., 2006, ApJ, 644, 125
- (59) Song, I., et al., 2003, ApJ, 599, 342
- (60) Song, I., et al., 2008, submitted
- (61) Stansberry, J. et al., 2008, PASP, in press
- (62) Stauffer, J., et al., 2005, AJ, 130, 1834
- stauffer (2) Stauffer, J., et al., 2007, in press, from IAUS 243, “Star-Disk Interaction in Young Stars,” held in Grenoble, France, in May 2007, ed. J. Bouvier.
- Su (2) Su, K., et al., 2004, BAAS from AAS #205, 17.09
- (65) Su, K., et al., 2006, ApJ, 653, 675
- (66) Silverstone, M., et al., 2006, ApJ, 639, 1138
- (67) Sylvester, R. J. & Skinner, C. J. 1996, MNRAS, 283, 457
- (68) torres]Torres, C., et al., 2006, A&A, 460, 695
- (69) Trilling, D., et al., 2007, ApJ, 658, 1289
- trilling (2) Trilling, D., et al., 2008, ApJ, submitted
- (71) Werner, M., et al., 2004, ApJS, 154, 1
- werner (2) Werner, M., et al., 2006, ARAA, 44, 269
- (73) Young, E., et al., 2004, ApJS, 154, 428
- (74) Young, K., et al., 2005, ApJ, 628, 283
- (75) Zuckerman, B., Song, I., & Webb, R., 2001, ApJ, 559, 388
- (76) Zuckerman, B., et al., 2001, ApJ, 562, 87
- (77) Zuckerman, B. & Song, I. 2004, ARA&A, 42, 685