The Stellar Content of the Post-Starburst S0 Galaxy NGC 5102 11affiliation: Based on observations obtained at the Gemini Observatory, which is operated by the Association of Universities for Research in Astronomy, Inc., under a co-operative agreement with the NSF on behalf of the Gemini partnership: the National Science Foundation (United States), the Particle Physics and Astronomy Research Council (United Kingdom), the National Research Council of Canada (Canada), CONICYT (Chile), the Australian Research Council (Australia), CNPq (Brazil), and CONICET (Argentina). 22affiliation: This publication makes use of data products from the Two Micron All Sky Survey, which is a joint project of the University of Massachusetts and the Infrared Processing and Analysis Center/California Institute of Technology, funded by the National Aeronautics and Space Administration and the National Science Foundation.
Abstract
The stellar content of the S0 galaxy NGC 5102 is investigated using deep and images obtained with GMOS-S. A modest population of bright main sequence stars and red supergiants (RSGs) is detected throughout the western portion of the disk. Based on the numbers of main sequence stars, the star formation rate (SFR) in NGC 5102 during the past ten million years is estimated to have been 0.02 M⊙ year-1. The majority of red giant branch (RGB) stars in the disk of NGC 5102 have [M/H] between –0.9 and –0.1, and the metallicity distribution of RGB stars at intermediate galactocentric radii peaks near [M/H] . RGB stars are traced out to galactocentric distances of 10 kpc, which corresponds to disk scale lengths. A large population of bright asymptotic giant branch (AGB) stars are seen throughout the western portion of the disk, and the youngest of these have log(t. It is concluded that (1) stars that formed within the past Gyr comprise of the total stellar disk mass, and (2) the SFR during intermediate epochs in the disk of NGC 5102 was at least 1.4 M⊙ year-1. Thus, large-scale star formation occured throughout the disk of NGC 5102 at approximately the same time that similar elevated levels of star formation occured in the bulge. It is suggested that NGC 5102 was a spiral galaxy that experienced a galaxy-wide episode of star formation that terminated a few hundred Myr in the past, and that much of its interstellar medium was ejected in an outflow.
1 INTRODUCTION
NGC 5102 is a member of the Centaurus Group of galaxies and exhibits the classical morphological characteristics of an S0 galaxy. Still, NGC 5102 has other properties that are not typical of the S0 class. For example, NGC 5102 has bluer colors and the spectrum has deeper Balmer absorption lines (Gallagher, Faber, & Balick 1975) than is typical for this type of object. NGC 5102 is also one of the most HI-rich S0s known. Much of the HI is in an annulus centered at 3.5 arcmin radius, and such an HI distribution is unique among S0s (van Woerden et al. 1993). While the dust temperature of NGC 5102 inferred from IRAS observations is not peculiar for S0s, the overall dust mass is low (van Woerden et al. 1993). Kraft et al. (2005) find a low number of x-ray binaries in NGC 5102 when compared with other early-type galaxies, and further note that the specific frequency of globular clusters is lower than in other S0s.
A number of studies have examined the stellar content in the central regions of NGC 5102. The nucleus of NGC 5102 is redder than its immediate surroundings, and is an x-ray source, suggesting that it may harbour a low-luminosity AGN (Kraft et al. 2005). The central regions (van den Bergh 1976; Pritchet 1979) and bulge (Pritchet 1979) of NGC 5102 have blue colors, and there are spectroscopic signatures of A and B stars (Gallagher et al. 1975; Rocca-Volmerange & Guiderdoni 1987). Deharveng et al. (1997) resolved UV-bright stars near the center of NGC 5102. These probably formed Myr in the past, although Deharveng et al. (1997) note that older post asymptotic giant branch (PAGB) stars also have photometric properties that are similar to those of the observed objects. van den Bergh (1976) discovered a ring of H emission. The ring has a diameter of kpc (McMillan, Ciardullo, & Jacoby (1994) which is similar in size to supershells in other galaxies. The center of the ring is consistent with an origin in the bulge, rather than the nucleus, and the expansion velocity is indicative of an age of only years (McMillan et al. 1994). The central regions of NGC 5102 were also an area of active star formation during intermediate epochs. Bica (1988) concludes from visible wavelength spectra that roughly 54% of the central light in originates from a population with an age Myr, while Kraft et al. (2005) model the UV-to-red spectrum and conclude that at least 55% of the stellar content originates from an intermediate-age population with an age Gyr.
Recent star formation has not been restricted to the spheroid of NGC 5102. van den Bergh (1976) identified groups of young stars associated with HII regions in the south east portion of the NGC 5102 disk, while Danks, Laustsen, & van Woerden (1979) found a number of stars that may be supergiants. McMillan et al. (1994) detected 7 HII regions in the disk, five of which are located to the south east of the galaxy center, while two are located close to the major axis in the south west quadrant.
The deepest photometric investigation of the NGC 5102 disk was conducted by Karachentsev et al. (2002), who used WFPC2 images to construct an CMD of stars in the north east portion of the galaxy. The WFPC2 CMD is dominated by a broad RGB that is indicative of a spread in age and/or metallicity. A spray of AGB stars is also seen. Prominent blue or red supergiant (RSG) sequences are not evident in these data, although the region sampled is far removed from the area that contains HII regions at the present day.
Studies of the spatial distribution of stars that formed during the past Gyr will provide insights into the recent evolution of NGC 5102, and may provide hints as to its evolutionary status in the context of other galaxies in the local Universe. There are basic issues that can be addressed with moderately wide field imaging studies. For example, is there evidence for recent star formation in parts of the disk other than those that currently contain bright HII regions? Moreover, did the extensive star-forming activity that occured during intermediate epochs in the bulge extend into the disk? If evidence for wide-spread elevated star formation rates (SFRs) during intermediate epochs are seen throughout the disk then this argues for a galaxy-wide star formation trigger. In contrast, if elevated SFRs were restricted to the innermost regions of the galaxy during the past few Gyr then this argues for a less dramatic triggering mechanism, such as the buckling of a bar or perhaps the assimilation of a small, gas-rich companion.
In the current paper, deep and images obtained with GMOS-S are used to investigate the stellar content of the western portion of the NGC 5102 disk. The and filters were selected for this program as they are well-suited to the detection of the bright red AGB stars that are conspicuous signatures of star formation during intermediate epochs, as well as the red RGB stars that belong to the moderately metal-rich populations that frequent the disks of spiral galaxies. While observations through the filter may have given more metallicity sensitivity, the integration times needed to detect the reddest AGB and RGB stars in are prohibitive.
The paper is structured as follows. Details of the observations and the procedures used to reduce the data can be found in §2, while the color-magnitude diagrams (CMDs) constructed from the data are presented in §3. The properties of the young, old, and intermediate age components are the subjects of §§4 – 6. A summary and discussion of the results follows in §7.
2 OBSERVATIONS & REDUCTION
NGC 5102 was observed with GMOS (Crampton et al. 2000) on the Gemini South telescope as part of queue program GS-2006A-Q-45. The GMOS detector is a mosaic of three EEV CCDs. The raw sampling on the sky is arcsec pixel-1, and the output was binned pixels2 during read-out. This binning allowed the final spatial sampling to better match the delivered image quality, which was measured from stars in the processed images to be 0.6 () and 0.7 () arcsec FWHM.
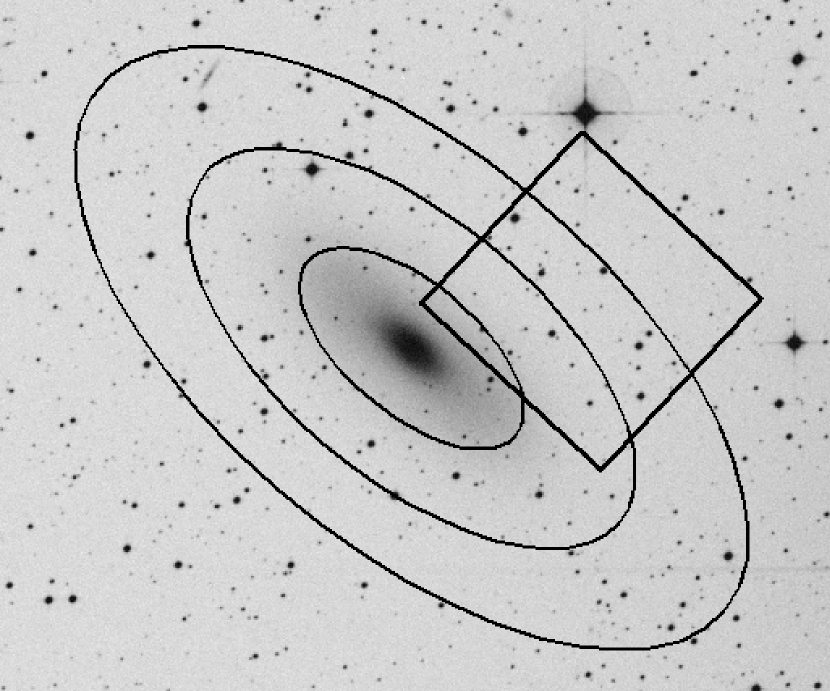
A field that is centered at 13h 10m 40s Right Ascension and –36o 36 51 Declination (E2000), and therefore samples the western half of the NGC 5102 disk, was observed through Sloan Digital Sky Survey (SDSS) and filters (Fukugita et al. 1996). Transmission curves for the filters used in GMOS-S are available at the Gemini website 333http://www.gemini.edu/sciops/instruments/gmos/filters/GMOSS_filters.gif. The area that was observed is marked in Figure 1, which shows a section of the Digitized Sky Survey centered on NGC 5102. Ten 450 sec exposures were recorded filter-1, and so the total exposure time is 4500 sec filter-1.
A standard pipeline for the processing of visible wavelength imaging observations was applied to the data. The output from each CCD was scaled to a common gain, and the results were mosaiced to form a single image for each exposure. These were then bias-subtracted and flat-fielded. Prominent interference fringes are seen in the flat-fielded images, and a fringe frame was constructed by median-combining flat-fielded images of the various Centaurus Group galaxies that were observed as part of this program. The target galaxies were intentionally positioned on different parts of the science detector to facilitate the suppression of galaxy light when the images of all the targets are combined to make the fringe frame. The resulting fringe frame was then subtracted from the flat-fielded NGC 5102 images. The telescope pointing was offset in a five point dither pattern between exposures to facilitate the filling of the gaps between the CCDs in the final processed images. The flat-fielded and fringe subtracted images were spatially registered to correct for the dither offsets, and the median intensity at each aligned pixel location was computed for each filter. The final step was to trim the stacked images to the area on the sky that is common to all exposures.
Landolt (1992) standard stars are observed with GMOS throughout each semester to provide calibration information for queue-scheduled GMOS imaging observations. For the current study, standard star images that were recorded within a few weeks of the NGC 5102 observations were fetched from the Gemini data archive and these were reduced using the procedures described above. While standard stars were not observed for this program on the same nights as the observations, the sky transparency was verified by the observering team at the telescope by checking satellite weather information, the brightness of the guide star, and the exposure-to-exposure photometric stability of stars in the target field. It is also standard practice for the observing team to check visually sky conditions throughout the night.
The standard star magnitudes listed by Landolt (1992) were transformed into the SDSS system using the relations defined by Smith et al. (2002), so that the photometric calibration is in the SDSS system. The instrumental brightnesses of the standard stars were measured from the reduced images in apertures that sampled the stellar PSF past the point where it blended with the sky background. The standard star observations were made near the meridian, and so extinction coefficients could not be calculated. Lacking a fiducial extinction curve for the Gemini South site, it was decided to adopt k and k mag airmass-1, which are the means of the entries in Table 3 of Smith et al. (2002). The extinction values for May 10 - 17 1998 and March 28 - 31 1999, which were periods of abnormally high extinction at the USNO Flagstaff Station site, were not used when computing the mean coefficients. Adopting the standard deviations in the nightly Smith et al. extinction coefficients as the uncertainties in the values used here, then the error in k and k is mag airmass-1. These introduce uncertainties of mag in and brightnesses. A second order extinction term was not employed as the coefficients are small (Smith et al. 2002).
The zeropoints obtained from the standard star measurements have an internal uncertainty of mag filter-1. However, the uncertainty in the absolute calibration of the NGC 5102 observations is larger than this given that the standards were not observed on the same night as NGC 5102. To be conservative, an uncertainty in the absolute calibration of magnitude is adopted, which is the upper limit of that suggested on the GMOS web pages (http://www.gemini.edu/sciops/instruments/gmos/calibration).
3 RESULTS: A FIRST LOOK AT THE CMDs
The brightnesses of objects in the final GMOS images were measured with the point spread function (PSF)-fitting routine ALLSTAR (Stetson & Harris 1988). The star lists, preliminary magnitudes, and PSFs that were used in ALLSTAR were obtained by running routines in DAOPHOT (Stetson 1987). Artificial star experiments were used to assess completeness and estimate the uncertainties in the photometric measurements. The artificial stars were assigned colors and brightnesses that are appropriate for the locus of red stars in NGC 5102. As with the real data, an artificial star was considered to be recovered only if it was detected in both and . The difference between the actual and measured brightness was not applied as a criterion for recovery, so that the effects of blending on stellar brightness could be investigated.
The completeness fraction varies across the field because the stellar density in NGC 5102 increases with decreasing RGC. At projected radii in the disk plane of 3.5 kpc, the 50% completeness limit is for a typical giant, while at 5.5 kpc the 50% completeness limit is almost a magnitude fainter. There is also a systematic radial trend in the difference between the actual and measured brightness of artificial stars, , that is another consequence of crowding. As might be anticipated from the 50% completeness limits, this is not significant near , which is the approximate brightness of the RGB-tip for metal-poor stars in NGC 5102, when R kpc. However, becomes larger at progressively fainter magnitudes. At , which is the approximate brightness of the RGB-tip for the most metal-rich stars in NGC 5102, magnitudes when R kpc, although drops to 0.1 magnitudes for stars with when R kpc. It should be noted that colors tend not to be as affected as single filter brightness measurements, as interloping objects that are bright enough to affect photometry in one bandpass tend to also be significant nuisances at neighboring wavelengths. In summary, the artificial star experiments indicate that caution should be exercised when assessing the properties of metal-rich RGB stars in the inner few kpc of NGC 5102.
The sources detected in the GMOS images were sorted into 1 kpc wide annuli. The placement of objects in these annuli assumes a distance modulus of 27.5 (§5.1) and a disk inclination of 64.4 degrees to the line of sight, based on the ratio of major and minor axes in the 2MASS Large Galaxy Atlas (Jarrett et al. 2003). The CMDs of the various annuli are shown in Figure 2. The areas sampled in these annuli are listed in Table 1.
The faint limit of the CMDs in Figure 2 varies with RGC, as expected due to the increase in stellar density towards smaller RGC. A plume of red stars, which is made up of RGB stars in NGC 5102, can be traced out to R kpc. While stars that belong to NGC 5102 are almost certainly present when R kpc, their number density is such that they do not stand out against the population of foreground stars and background galaxies.
Background galaxies dominate over foreground stars near the brightness of the RGB-tip in NGC 5102. The Robin et al. (2003) model Galaxy predicts that there are foreground stars with between 23 and 24 in the area imaged by GMOS, with stars in the 10 – 11 kpc interval. For comparison, galaxy counts compiled in Figure 2 of Smail et al. (1995) suggest that there are background galaxies with between 23 and 24 in the GMOS field, with galaxies in the 10 – 11 kpc annulus. There are 24 objects with between 23 and 24 in the kpc CMD in Figure 2, and so there is excellent agreement between the predicted and observed number of contaminating objects.
The evolutionary status of stars in NGC 5102 is examined in Figure 3, where the CMDs of objects in three annuli are compared with isochrones. The CMDs for the kpc and kpc intervals demonstrate the typical data quality in the NGC 5102 disk, whereas the majority of sources in the 10 – 11 kpc interval are background galaxies and foreground stars. The errorbars show the random uncertainties predicted from the artificial star experiments for a star with and . The error ellipse shrinks as RGC increases, due to the diminishing impact of crowding on photometric measurements as regions with progressively lower stellar density are sampled.
Girardi et al. (2004) transform a grid of isochrones into the SDSS photometric system, and some of these are compared with the NGC 5102 observations in Figure 3. The isochrones shown in Figure 3 have Z = 0.0001, 0.001, 0.004, and 0.008; those in the top row have an age of 10 Gyr, while those in the lower row have an age of 1 Gyr. A distance modulus (§5.1) and a foreground reddening A (Schlegel, Finkbeiner, & Davis 1998), which corresponds to A and E using the entries in Table 6 of Schlegel et al. (1998), have been assumed.
Stars with distinct ages and evolutionary states can be identified in the CMDs. There is a significant population of sources with in the kpc CMD, whereas this region of the 10 – 11 kpc CMD is almost devoid of objects. The blue objects in the kpc CMD are bright main sequence stars, the properties of which are discussed in §4.
It can be seen in the top panel of Figure 3 that the majority of objects in the NGC 5102 CMDs have colors and brightnesses that are consistent with them evolving on the RGB, and these stars are discussed further in §5. There are also stars above the RGB-tip in Figure 3 that are evolving on the AGB. The AGB stars that are immediately above the RGB-tip have brightnesses and colors that are consistent with them belonging to an old population; however, there are also AGB stars that have brightnesses indicating that they belong to an intermediate age population, and it can be seen from the lower panel of Figure 3 that the peak brightness of the AGB stars is consistent with an age Gyr. The properties of the AGB stars are discussed in §6.
4 MAIN SEQUENCE STARS AND SUPERGIANTS
4.1 Main Sequence Stars and the Star Formation Rate
The HII regions in NGC 5102 mark the sites of the most recent star formation in the galaxy. Although HII regions have yet to be detected in the field observed with GMOS, there are blue objects with in the CMDs of the 2 – 3 and 3 – 4 kpc intervals in Figure 2. These objects are almost certainly young main sequence stars in NGC 5102 rather than foreground stars or background galaxies, as objects with similar colors and brightnesses are absent in the CMDs that sample R 10kpc.
The blue stellar sequence in Figure 2 peaks near , which corresponds to M. This is consistent with the peak brightness of main sequence stars in the Galaxy and the LMC (e.g. Humphreys & McElroy 1984). As stars at the uppermost limits of the main sequence, the blue stars in the western portion of the NGC 5102 disk likely have ages Myr. Thus, star formation has occured recently throughout much of the western half of the NGC 5102 disk, albeit at a very modest rate (see below).
Clues to the mechanisms that drive star formation in the disk of NGC 5102 can be found by examining the spatial distribution of young objects. The spatial distribution of main sequence stars in NGC 5102 is investigated in Figure 4, where the positions of sources with and are shown. The stellar positions are in the plane of the NGC 5102 disk – i.e. they have been de-projected to account for the inclination of the NGC 5102 disk. While there appears to be a slight tendency for the main sequence stars to cluster, they are distributed throughout the western portion of the NGC 5102 disk, with no sign of spiral structure. This is not unexpected given the absence of spiral structure in the NGC 5102 HI distribution (van Woerden et al. 1993). Thus, it appears that star formation in the disk of NGC 5102 at the present epoch is not spurred by spiral density waves.
Much of the HI in NGC 5102 is in a ring that has its greatest concentration between 2 and 4 arcmin from the galaxy center (e.g. Figure 6 of van Woerden et al. 1993). The dashed lines in Figure 4 show the annulus that marks the HI ring in this portion of NGC 5102. Many of the bright main sequence stars in the western portion of NGC 5102 fall outside of the HI ring, suggesting that the large scale HI distribution in NGC 5102 is not an effective tracer of recent star formation.
The density of main sequence stars in the disk of NGC 5102 is considerably lower than in nearby ‘normal’ late-type spirals, and this can be quantified by investigating the specific frequency of blue stars. Following the convention developed to probe globular clusters systems (e.g. Harris & van den Bergh 1981), the specific frequency of young stars is taken to be the number of blue objects per unit integrated brightness. For the current study, the specific frequency of main sequence stars, Sms, is defined to be the number of stars with and between 22 and 24 normalized to a system with an integrated brightness M. Therefore, S, where nms is the number of stars with and between 22 and 24, while MK is the integrated brightness in the region of NGC 5102 being studied. There are 44 stars with RGC between 2 and 5 kpc in the GMOS field that have photometric properties that suggest they are main sequence stars. Using the total band brightness in this radial interval measured from the 2MASS image of NGC 5102 (Jarrett et al. 2003), then S. For comparison, the star counts given by Davidge (2007b), coupled with the band surface photometry from Jarrett et al. (2003), indicate that S in the disk of NGC 2403. Therefore, when normalized to the same integrated band brightness the number density of main sequence stars in NGC 5102 is only that in NGC 2403.
The recent SFR in NGC 5102 can be estimated using NGC 2403 as a benchmark. The total SFR in a spiral galaxy can be computed using diagnostics such as the strength of H emission, which probes star formation in regions of low obscuration, and infrared flux, which probes star formation in heavily obscured areas (e.g. Pérez-González et al. 2006). Using the H and FIR fluxes of NGC 2403 given in Table 4 of Bell & Kennicutt (2001) and the SFR calibrations given by Kennicutt (1998), then the unobscured SFR in NGC 2403 is M⊙ year-1, while the obscured SFR is 0.3 M⊙ year-1. Given that (1) the total MK magnitude of NGC 5102 is magnitudes fainter than NGC 2403 (Jarrett et al. 2003), and (2) the density of young stars in NGC 5102 is 7% that in NGC 2403, then the present day unobscured SFR in NGC 5102 is M⊙ year-1. As for the obscured SFR in NGC 5102, the total far infrared flux in NGC 5102 is that in NGC 2403 (Rice et al. 1988), and so the obscured SFR in NGC 5102 is M⊙ year1. Therefore, the total SFR in NGC 5201 is M⊙ year-1.
4.2 Red Supergiants
Red supergiants (RSGs) populate a near-vertical finger of stars in the kpc CMD in Figure 2. The RSG sequence runs from to , with . A similar feature is seen in the CMDs of disk stars in NGC 2403 (Davidge 2007b) and NGC 247 (Davidge 2006). It should be emphasized that despite the low number density of young stars throughout the disk of NGC 5102, the RSG sequence in the kpc CMD is a statistically real feature. Indeed, whereas there are 13 sources with between 22.5 and 21.4 and between 0.2 and 0.5 in the 2 – 3 kpc CMD, the number of similar objects in the 10 – 11 kpc interval indicates that only of the candidate RSGs in the kpc CMD is probably a foreground star or background galaxy.
The color and shape of the RSG locus on visible wavelength CMDs is sensitive to metallicity, and so it is possible to estimate the metallicity of RSGs in NGC 5102. This is demonstrated in Figure 5, where models with Z = 0.008 and Z = 0.019 from Girardi et al. (2004) are compared with the 2 – 3 kpc CMD. The RSG locus is much better matched by the Z = 0.008 models than the Z = 0.019 models.
The metallicity of RSGs provides constraints on the metallicities of older stars in the disk of NGC 5102. Given that the youngest stars in a galaxy will probably form from interstellar material that has been subject to cumulative enrichment from past generations of stars, then RGB stars with metallicities that are higher than those of the RSGs should be rare in the disk of NGC 5102. It can then be anticipated that the metallicity distribution of RGB stars in NGC 5102 will truncate near [M/H] , and this is seen to be the case (§5.2).
The spatial distribution of RSGs in the western disk of NGC 5102 is examined in the right hand panel of Figure 4. The objects identified as RSGs in this figure have the same photometric properties as marked in Figure 5. It is evident that – as was found for main sequence stars – there are a number of RSGs that fall outside the HI ring boundaries.
5 THE RED GIANT BRANCH
5.1 An RGB-tip Distance Modulus
The distance to NGC 5102 can be measured from the brightness of the RGB-tip. A complication is that the RGB sequence in the disk of NGC 5102 is broad, and the isochrones in the top row of Figure 3 indicate that the RGB stars in this part of NGC 5102 span metallicities from Z = 0.0001 to at least Z = 0.008. Such a broad metallicity spread complicates efforts to measure the brightness of the RGB-tip at visible and red wavelengths, since the upper RGB bends over when [Fe/H] (e.g. Da Costa & Armandroff 1990; Ortolani, Barbuy, & Bica 1991), which in turn blurs the signature RGB-tip discontinuity in the luminosity function (LF).
Age is another parameter that can broaden the RGB and affect the ability to detect the RGB-tip. At a given metallicity, younger stars have bluer colors than older stars, and the 1 Gyr AGB sequences in the bottom row of Figure 3 pass through a part of the CMD that is also occupied by metal-poor RGB stars. The presence of these intermediate age AGB stars will dilute the RGB-tip discontinuity.
The impact of a broad metallicity dispersion can be reduced by restricting the RGB sample to stars with colors that are appropriate for Z . For the current study only stars with between 0.3 and 0.6 are used to determine the RGB-tip brightness. While the isochrones shown in the lower panel of Figure 3 indicate that intermediate age stars may be present in this color interval, the removal of these objects with the available data is problematic. In any event, while AGB stars with this age may reduce the amplitude of the RGB-tip discontinuity, they are not expected to skew the brightness estimated for the RGB-tip. The sample was further culled so that only stars with R kpc are considered. This was done to reduce the impact of photometric errors on the RGB-tip measurement.
The linear and logarithmic LFs of stars with RGC between 4 and 7 kpc and having between 0.3 and 0.6 are shown in the upper two panels of Figure 6. The result of convolving the linear LF with a three point Sobel edge-detection kernel is shown in the bottom panel. There is a peak in the filtered LF at , which is attributed to the RGB-tip. The quoted uncertainty in the RGB-tip brightness is the result of adding in quadrature the error due to binning, which is estimated to be based on the width of the peak in the lower panel of Figure 6, with the error in the photometric calibration, which is magnitude (§2).
The conventional brightness calibration of the RGB-tip is in the filter (e.g. Lee, Freedman, & Madore 1993). To use this calibration, the GMOS magnitude of the RGB-tip was transformed into an IKC magnitude using the transformation equations in Table 7 of Smith et al. (2002). If the band RGB-tip brightness is M (Lee et al. 1993) and A, then a distance modulus of is found for NGC 5102.
The estimated uncertainty in the distance modulus is a lower limit, as it does not account for uncertainties in the transformation into IKC magnitudes. However, there are indications that this transformation does not introduce large errors. One way to determine if the transformation process has seriously skewed the distance modulus is to compute an independent distance modulus from the untransformed RGB-tip magnitude. As it turns out, a distance modulus of 27.50 is computed based on the RGB-tip M brightness predicted by the 10 Gyr Z=0.001 Girardi et al. (2004) isochrone. The good agreement between this distance modulus and that computed from the Lee at el. (1993) calibration in the previous paragraph argues that the transformation errors are probably not large.
An important caveat in the distance estimate is that the RGB stars are assumed to be like those in globular clusters, and this is not an ideal assumption for NGC 5102, where there is a large intermediate age population. Salaris & Girardi (2005) investigate the impact of intermediate age populations on RGB-tip distance estimates, and find that the distance modulus may be in error by magnitude. Salaris & Girardi (2005) note that there are significant uncertainties when correcting the RGB-tip distance modulus for intermediate age populations, due in part to uncertainties in the bolometric corrections of cool stars. In addition, the distance modulus correction also depends on the stellar content. Assigning an uncertainty of magnitude for population effects, which roughly brackets the range of corrections computed by Salaris & Girardi (2005) when modelling the relative distances of the Large and Small Magellanic Clouds with respect to LGS3, then the final distance modulus for NGC 5102 based on the GMOS data is .
The distance modulus found from the GMOS data does not differ significantly from that computed by Karachentsev et al. (2002), who concluded that based on observations of a different part of NGC 5102 than was observed with GMOS. The distance modulus computed here is adopted for the remainder of the study simply because it is internally consistent with the GMOS data. Given that the two RGB-tip distance moduli are not significantly different, we otherwise do not prefer one over the other.
5.2 The Metallicities of RGB Stars
Line blanketing affects the and brightnesses of evolved stars with Z , in that evolutionary sequences for metal-rich and moderately metal-rich systems bend over on CMDs near the bright end; consequently, the most evolved stars on the RGB and AGB may have fainter observed magnitudes than stars that are less evolved. The impact of line blanketing is greatly reduced at wavelengths longward of m, and a survey of NGC 5102 in and will allow for a more complete census of the evolved red stellar content of this galaxy. In the absence of such data, the impact of line blanketing on the morphology of the metal-rich portions of the RGB can be reduced by considering the bolometric magnitudes of individual stars.
A relation between the bolometric correction, BC, and was generated from the Girardi et al. (2004) isochrones. The following three-part relation between BC and was found to match the models with Z to within magnitudes, independent of metallicity and age:
The (Mbol, ) CMDs for the 3 – 4 kpc, 5 – 6 kpc, and 11 – 12 kpc intervals are shown in Figure 7. Isochrones from Girardi et al. (2004) for Z = 0.0001, 0.001, 0.004, and 0.008 are also shown.
The metallicity distribution function (MDF) of RGB stars probes the chemical enrichment history of galaxies. The metallicities of individual RGB stars can be estimated from their colors, and the MDF can be computed from these values. Photometric metallicities were computed for stars with Mbol between –2.9 and –3.1 by interpolating between the 10 Gyr Girardi et al. (2004) isochrones. This Mbol magnitude range was selected because it samples the RGB at a point where the data are largely complete throughout most of the area that was observed with GMOS. The MDFs constructed from these data are shown in Figure 8. The MDFs have been corrected for foreground star and background galaxy contamination by subtracting the MDF of objects in the 10 – 12 kpc interval.
The MDFs are dominated by objects with [M/H] between –1.3 and –0.1. Caution should be exercised when considering the metal-rich end of each MDF, as this is where incompleteness will be greatest. The MDFs in Figure 8 are resticted to R kpc, as the artificial star experiments suggest that incompleteness is not an issue for metal-rich stars at these galactocentric distances. In fact, there are two indirect indications that incompleteness does not influence the overall characteristics of the MDFs in Figure 8. First, it was shown in §4 that the RSGs in NGC 5102 have [Fe/H] , and it is unlikely that the (older) RGB disk stars will be more metal-rich than this. Therefore, the absence of a large number of RGB stars with [M/H] in Figure 8 is to be expected. Second, the degree of incompleteness at a given magnitude and color will be greater in regions of higher stellar density, and so it might be expected that the metal-rich ends of MDFs at small RGC will truncate at lower metallicities that at large RGC. That the MDFs in Figure 8 appear not to change near the metal-rich end over a large range of RGC suggests that incompleteness is likely not a major issue in defining the MDFs.
Crowding is another source of concern when considering the MDFs. If two stars of the same brightness fall in the same angular resolution element then they will appear as a single object that is 0.75 mag brighter than the progenitors. This will have the greatest impact among metal-rich RGB stars, where the RGB-tip is fainter in than for metal-poor stars. The incidence of blending can be estimated empirically by considering the number density of objects with between 25.5 and 26.0, which is the magnitude range where pairs of stars will blend to form objects with brightnesses that are comparable to those of metal-rich RGB-tip stars. Accounting for incompleteness, there are 3240 stars with between 25.5 and 26.0 in the 4 – 6 kpc interval, and 630 such stars in the 6 – 8 kpc interval. Assuming that each resolution element has a radius that is one half of the FWHM, then there will be two-star blends in the 4 – 6 kpc interval and only 6 such blends in the 6 – 8 kpc interval.
The number of blends predicted in the previous paragraph are conservative upper limits. First, stars that are separated by half of the seeing disk radius will form a composite object that is noticeably elongated, and hence will be rejected by DAOPHOT. This is an important consideration, as the predicted number of blends is critically sensitive to the size of the resolution element. For example, if the resolution element is assumed to have a radius that is one quarter that of the seeing disk, then the number of blends expected in the 4 - 6 kpc interval plummets to 10. Second, the number counts used to estimate the blending rate span the entire range of colors, and so not all blends will have colors that are consistent with those of metal-rich stars.
The issue of blending at the metal-rich end of the MDF of stars in the 4 – 6 kpc interval notwithstanding, the overall appearance of the MDFs in Figure 8 suggests that the peak [M/H] may shift to more metal-poor values as RGC increases. Such a trend is not unexpected given the evidence for radial metallicity gradients in the disks of many nearby spiral galaxies based on the measurements of line strengths in HII regions. Still, a Kolomogorov-Smirnov test indicates that the 6 – 8 and 4 – 6 kpc MDFs differ at well below the 90% confidence level – i.e. they are not significantly different. However, the 8 - 10 and 4 - 6 kpc MDFs differ at roughly the 95% confidence level. Thus, there is tentative evidence for a metallicity gradient in the RGB content in the NGC 5102 disk. Larger area surveys of the outer regions of NGC 5102 will be required to obtain the stellar sample sizes that will allow for a more rigourous test for a metallicity gradient.
The MDFs in Figure 8 are contaminated by AGB stars that belong to an intermediate age population (§6). It can be seen from Figure 7 that AGB stars with an age of 1 Gyr and M will masquerade as RGB stars with [Fe/H] , and so interloping AGB stars will skew the true MDF of old RGB stars to lower values. It is thus worth noting that the majority of stars in the MDFs have [Fe/H] , indicating that intermediate age AGB stars likely do not have a large impact on the observed MDFs.
6 THE ASYMPTOTIC GIANT BRANCH
Comparisons with isochrones suggest that (1) the brightest of the AGB stars in the western disk of NGC 5102 have an age Gyr, and (2) the AGB stars are moderately metal-rich, with the majority falling to the right of the Z = 0.004 isochrones in the lower panel of Figure 7. This second result is not unexpected given that the RGB MDFs peak near Z = 0.004 (§5.2); the brightest AGB stars are younger than the RGB stars, and so likely formed from more metal-enriched gas than the majority of RGB stars.
The Mbol LFs of stars with are compared in Figure 9. Relations between age and peak AGB magnitude from the Girardi et al. (2004) models are also indicated at the top of this figure. There are three distinct luminosity regimes that are considered here:
-
1.
M. Stars evolving on the RGB dominate in this luminosity interval in systems with ages in excess of Gyr. A statistically significant population of stars with this brightness is seen out to R kpc in the LFs.
-
2.
Mbol between –3.5 and –4.5. This magnitude range is dominated by AGB stars that belong to old stellar systems. Like RGB stars, an old AGB component can be traced in significant numbers out to R kpc in NGC 5102.
-
3.
Mbol between -4.5 and -6.5. This magnitude interval contains intermediate age AGB stars. Stars in this luminosity range can be traced in significant numbers out to R kpc, indicating that there was star formation at intermediate epochs throughout much of the disk of NGC 5102. The stars in this luminosity range are the focus of attention in the remainder of this section.
There is no obvious discontinuity near M in Figure 9, as might be expected if the intermediate age stars formed in a discrete, modestly-sized star-forming episode. Rather, the continuous nature of the LF near M hints that the brightest AGB stars belong to a population that contributes significantly to the stellar mass of the disk. The fraction of the stellar disk mass that formed during intermediate epochs can be estimated by comparing the LFs in Figure 9 with fiducial LFs of systems with known age and mass. Davidge (2007a) constructed an AGB LF from observations of stars in the six well-characterised LMC clusters that were observed by Ferraro et al. (2004). The clusters have a luminosity-weighted age Gyr. These same data are used here to construct a reference LF that is compared with the NGC 5102 Mbol LF.
Following Davidge (2007a), the model LFs are restricted to two components, consisting of an old and intermediate age population that are combined in various mass ratios. The LF of the old component is taken from observations of the globular cluster 47 Tuc. This cluster is an ideal LF template for the present work because it has a metallicity that is comparable to that of the majority of RGB stars in NGC 5102, and it is known to be old. The observations of 47 Tuc are unpublished, and were obtained with the CIRIM imager on the CTIO 1.5 meter telescope during an observing run in July 1996. The central arcmin2 of the cluster was observed through and filters, with a total exposure time of 12 sec filter-1. The data were reduced using a standard pipeline for near-infrared imaging (e.g. Davidge 2000). Stellar brightnesses were measured with ALLSTAR (Stetson & Harris 1988).
Bolometric magnitudes for individual stars in the LMC clusters were calculated using a relation between the band bolometric correction, BCK, and that was generated from the 0.5 Gyr Z = 0.004 models of Girardi et al. (2004). The bolometric magnitudes of stars in 47 Tuc were calculated using the bolometric corrections discussed in §5.2. The masses of the old and intermediate aged template clusters were estimated from the total band brightnesses of the clusters using M/L ratios from Maraston (2005). Photometric measurements made by Pessev et al. (2006) and Persson et al. (1983) indicate that the LMC clusters have a total brightness , which corresponds to M assuming an LMC distance modulus . Images from the 2MASS survey indicate that the area observed in 47 Tuc has a total brightness M.
Selected model LFs are shown in Figure 10, where fint is the fractional mass of the intermediate age component; the fractional mass of the old population is then . The model Mbol LF flattens with increasing fint. The models are most sensitive to changes in fint when f, since at larger values of fint the intermediate age population dominates the light output by virtue of its higher M/L ratio.
Model LFs are compared with the LF of stars in NGC 5102 with RGC between 3 and 5 kpc in Figure 11. This radial interval was selected to avoid the incompleteness issues that affect the data when R kpc, while the 2MASS data do not go deep enough to allow surface photometry to be done when R kpc. The models have been shifted to show the number of stars expected in a system with an integrated brightness like that in the 3 – 5 kpc interval in NGC 5102, which was measured from the band image of this galaxy in the 2MASS Large Galaxy Atlas (Jarrett et al. 2003). It can be seen that when f the model LFs are too steep when compared with the observations. However, the number counts of stars in NGC 5102 are matched by the models with f 0.2. Therefore, a significant fraction of the stellar mass in the disk of NGC 5102 formed during intermediate epochs; elevated SFRs were not restricted to the bulge of NGC 5102 within the past Gyr, but also occured throughout much of the disk.
Because the model LFs do not change by large amounts when f, it is difficult to pin down fint solely from the LFs. However, other information provides independent constraints. For example, f given that a large RGB component is present. Additional evidence that supports f comes from the number of metal-poor stars in the RGB MDFs, and this is discussed further in §7.2.
7 SUMMARY & DISCUSSION
Deep and images obtained with GMOS on Gemini South have been used to probe the stellar content in a field that samples the western side of the Centaurus Group S0 galaxy NGC 5102. With a distance of only 3.2 Mpc, NGC 5102 is the nearest S0 galaxy, and so is a potential Rosetta Stone for understanding the origins and evolutionary state of this galaxy type. The stellar content of NGC 5102 points to a highly interesting star-forming history, and this is discussed below. A caveat is that NGC 5102 has a number of features that make it an unusual S0.
While there is some uncertainty in the distance modulus of NGC 5102 (§5.1), this will not have a major impact on the conclusions. For example, if the slightly larger distance modulus computed by Karachentsev et al. (2002) is adopted instead of the value computed here then the age of the youngest stars in NGC 5102 will be lowered by only 0.05 – 0.1 dex. The fraction of the galaxy that formed during intermediate epochs and the SFR estimated for this time will increase by modest amounts. As for the impact on older stars, the MDF estimated from RGB stars will be shifted to lower values by dex at the metal-rich end.
7.1 The Star Forming History of NGC 5102 From the Present Day to 1 Gyr in the Past
There is on-going star formation in the disk of NGC 5102, albeit at a subdued level. The most obvious signature of this activity is the modest population of HII regions that are clustered in the eastern and southern areas of the galaxy. A new result is that the GMOS observations reveal that recent star formation has occured in other parts of the NGC 5102 disk, as bright main sequence stars, which probe star-forming activity up to Myr in the past, are seen throughout the western disk of NGC 5102. The spatial distribution of these objects suggests that star formation during the past Myr was not spatially concentrated, but occured at various locations throughout this part of NGC 5102. Given the absence of obvious spiral structure (van Woerden et al. 1993), the spatial concentration of HII regions and the diffuse distribution of bright main sequence stars suggest that star formation at the present day in the disk of NGC 5102 is not spurred by spiral density waves; perhaps star formation is spatially propogating from many seed sights.
The global SFR in NGC 5102 has not changed significantly over the past 10 Myr. Indeed, the density of main sequence stars per band surface brightness in NGC 5102 indicates that the SFR has been that in NGC 2403 during the past Myr (§4.1). A comparison of the number of HII regions in these galaxies can be used to judge their relative SFRs over an even shorter timescale (a few Myr). Sivan et al. (1993) find 366 HII regions in NGC 2403, while Hodge & Kennicutt (1983) identify 605 HII regions. For comparison, there are only 7 HII regions known in the main body of NGC 5102 (McMillan et al. 1994), although this is probably a lower limit as not all of the NGC 5102 disk was surveyed by McMillan et al. (1994). Using integrated K-band brightnesses from Jarrett et al. (2003), then the number of HII regions per unit band brightness in NGC 5102 is that in NGC 2403. This agrees with the spatial densities of the longer-lived bright main sequence stars.
The SFR in NGC 5102 was much higher a few 100 Myr in the past. In §6, it is concluded that at least 20% of the total stellar disk mass in NGC 5201 formed within the past Gyr. Kraft et al. (2005) argue that a large fraction of the stellar mass in the central regions of NGC 5102 also formed during intermediate epochs. It thus appears that the elevated levels of star formation within the past Gyr were not restricted to the central spheroid of NGC 5102, but occured throughout much of the galaxy.
The detection of an intermediate age population in a normal spiral galaxy should not in itself be surprising, as star formation proceeds in a roughly continuous manner in these systems. Consider the Milky-Way, where the global SFR is M⊙ year-1, and likely has not varied greatly with time over the past few Gyr (e.g. Naab & Ostriker 2006; Rana 1991). Given a disk mass of M⊙ (van der Kruit 1986), then of the stellar mass in the Galactic disk formed between 0.2 and 1.0 Gyr in the past. The model LFs discussed in §6 indicate that an external viewer of the Galaxy would detect a prominent bright AGB sequence. This being said, the fractional mass of the disk of NGC 5102 that formed during intermediate epochs suggests that the SFR at those times exceeded that of a normal spiral galaxy, and certainly exceeded the present day SFR in NGC 5102. Given that at least 20% of the stellar disk mass in NGC 5102 appears to have formed sometime in the past 1 Gyr then the SFR per projected area in the NGC 5102 disk must have been at least that in the Milky-Way disk.
A lower limit to the SFR in NGC 5102 during intermediate epochs can be estimated from the available data. van Woerden et al. (1993) find a total mass of M⊙ within 6 kpc of the center of NGC 5102. Adopting a mean dark matter density of M⊙ pc-3 (Puche & Carignan 1991), then the stellar mass in NGC 5102 is M⊙. This stellar mass is not unreasonable, as it is within a factor of two of what is computed from the total band brightness of NGC 5102 from Jarrett et al. (2003) assuming . The total stellar mass that formed during intermediate epochs is then at least M⊙. Star formation in starburst systems occurs over an extended period of time. Studies of distant luminous infrared galaxies suggest a typical time scale of 0.1 Gyr (Marcillac et al. 2006), while observations of closer starburst galaxies like M82 suggest timescales of Gyr (Mayya et al. 2006) to 1 Gyr (e.g. Smith et al. 2006). Conservatively adopting the longer of these timescales, then the SFR in NGC 5102 during intermediate epochs was then at least 1.4 M⊙ year-1.
7.2 The Early Evolution of NGC 5102
While a significant fraction of the NGC 5102 disk formed during intermediate epochs, there is also a large old stellar substrate. Evidence that an RGB is present, and that the disk is not comprised entirely of intermediate age stars, comes from the red envelope of objects with M in the CMD, which can only be moderately metal-rich RGB stars. There is also a clean RGB-tip discontinuity in the LF (§5.1).
Clues into the early evolution of NGC 5102 can be gleaned from studies of the oldest objects. Consider the globular cluster content of NGC 5102. The specific frequency of globular clusters in NGC 5102 is low when compared with other S0s (Kraft et al. 2005), but is not atypical for late-type spiral galaxies. The formation of globular clusters are associated with the early violent epochs of galaxy formation, that produce pressure-supported spheroids. The low specific globular cluster frequency argues against a violent beginning for NGC 5102, such as a major merger of gas rich proto-galaxies.
The RGB stars discussed in §5 are among the brightest individual old stars in NGC 5102. The MDFs constructed from the RGB stars suggest that the vast majority of old stars in the disk of NGC 5102 have metallicities between [Fe/H] and –0.1. That there are old stars with moderately high metallicities hints at much star-forming activity in NGC 5102 at epochs more than 3 Gyr in the past. Comparisons with other galaxies are of interest in this regard. The width and peak metallicity of the NGC 5102 MDF is comparable to the MDF in the inner disk of the LMC constructed by Cole, Smecker-Hane, & Gallagher (2000). However, the NGC 5102 MDF is skewed to lower metallicities when compared with the MDF in the Solar neighborhood (e.g. Wyse & Gilmore 1995) and the disk of M31 (Bellazzini et al. 2003), both of which contain a significant number of objects with [M/H] .
Line blanketing can introduce a bias against the detection of the most metal-rich stars if they fall in areas of the CMD with low photometric completeness. The MDFs were constructed at RGC where artificial star experiments suggest that incompleteness and blending should not be a problem. It is also encouraging that the RSGs in the disk of NGC 5102 have colors that are indicative of [M/H] . As relatively young stars, the RSGs should be among the most metal-rich stars in the disk of NGC 5102, and it is unlikely that there will be a large population of disk RGB stars with metallicities higher than this value. The metal-rich end of the RGB MDF is consistent with this expectation. The affects of line blanketing are greatly reduced in the near-infrared, and deep imaging of the disk of NGC 5102 will provide a means of determining if a substantial population of RGB stars with near-solar metallicity are present.
Contamination by intermediate age stars is another potential source of uncertainty in the MDF. The MDF was measured using stars with M. At this magnitude, AGB stars from intermediate age populations have colors that are the same as those of metal-poor RGB stars, and the presence of unidentified AGB interlopers will skew the MDF to lower values. In fact, some of the stars identified as metal-poor RGB stars in §5 may actually be intermediate age AGB stars. It can be seen from Figure 7 that stars with an age of 1 Gyr and Z = 0.008 have colors at M that are similar to those of RGB stars with [M/H] . Now, the model LFs predict that if f then of the stars with M will come from the 0.7 Gyr population. For comparison, of the stars in the MDFs of the 4 – 6 and 6 – 8 kpc intervals have [M/H] . Thus, the number of stars with [M/H] is not greatly different from that expected if (1) 20% of the disk mass comes from intermediate age stars, and (2) the number of RGB stars in the disk of NGC 5102 with [M/H] is modest. In summary, accounting for intermediate age stars will truncate the RGB MDF near [M/H] , rather than at [M/H] . The peak in the MDF of the 4 – 6 kpc interval at [M/H] is not affected by intermediate age stars; the conclusion that the majority of disk giants in NGC 5102 are moderately metal-rich is thus robust.
We close the discussion of the old stellar content of NGC 5102 by noting that the old disk of this galaxy is spatially extended when compared with late-type spirals. In §3 it is shown that RGB stars can be traced out to R kpc along the disk plane in NGC 5102. This is a lower limit to the actual extent of the stellar disk, as it indicates only the point at which the number of RGB stars can be detected in the presence of contamination from background galaxies and foreground stars. With a distance-corrected exponential scale length of 0.7 kpc (Freeman 1970), then the disk of NGC 5102 is traced out to scale lengths. This exceeds what is measured in many late-type spirals, such as NGC 247 (Davidge 2006), NGC 2403 (Davidge 2007b), and even NGC 300 (Bland-Hawthorn et al. 2005).
7.3 NGC 5102 as a Post-Starburst Galaxy
There are hints that NGC 5102 may have been a late-type disk galaxy earlier in its life. The low specific frequency of globular clusters is consistent with that of a late-type spiral galaxy, rather than of an early-type system (Kraft et al. 2005), while the MDF of RGB stars in the disks of NGC 5102 and the LMC are similar. In addition, while there are no signs of spiral structure in the distributions of young stars or HI, the radial distribution of HI in NGC 5102 more closely follows that in spirals than classical S0s, albeit with a lower mass density (van Woerden et al. 1993).
A SFR like that which occured in NGC 5102 during intermediate epochs may have been high enough to have a significant impact on the observational properties of a normal late-type disk galaxy. Heckman (2002) finds that outflows occur when the density of star formation exceeds solar masses year-1 kpc-2. With an effective radius of 75.6 arcsec (Jarrett et al. 2003), which corresponds to a linear distance of 1.2 kpc, then a SFR of M⊙ year-1 is required to fuel an outflow in NGC 5102. This falls below the lower limit to the SFR during intermediate epochs computed in §7.1 (1.4 M⊙ year-1), and raises the possibility that NGC 5102 may have lost much of its gas and dust in the not too distant past. The result would be a disk-dominated galaxy with a depleted ISM and a low SFR at the present day.
The events that lead to elevated SFRs in the nucleus and bulge of NGC 5102 during the past Gyr are a matter of speculation. There are no morphological features that support a merger-driven origin for the elevated SFRs, and NGC 5102 is in an isolated environment (van Woerden et al. 1993). Still, the distance estimates listed in Table 2 of Karachentsev et al. (2007) place the barred spiral galaxy ESO383–G087, which appears to be the closest known neighbor, at a distance of Mpc, while Cen A is at a distance of Mpc. While NGC 5102 is currently isolated, a triggering encounter may still have occured Gyr in the past. Indeed, the distance between NGC 5102 and ESO383-G087 could be traversed within 1 Gyr if the velocity difference between these galaxies were 300 – 400 km sec-1.
There may be galaxies in other nearby groups that are related to NGC 5102 in an evolutionary context. The high SFR estimated for NGC 5102 during intermediate epochs is reminiscent of what is seen in M82. The SFR of M82 based on the FIR flux is M⊙ year-1, and O’Connell & Mangano (1978) suggest that M82 was likely an Sc/Irr galaxy prior to interacting with M81. Using a variety of observational constraints, including chemical abundances and the depth of Balmer absorption lines, Mayya et al. (2006) conclude that a large fraction of the M82 disk formed over a period of only a few hundred Myr, terminating Gyr in the past. The star formation is powering a mass outflow in M82 (e.g. Heckman, Armus, and Miley 1990), and if the outflow disrupts enough of the ISM of M82 then its appearance a few hundred Myr in the future may be similar to that of NGC 5102 today.
| Radial Interval | Area Sampled |
|---|---|
| (kpc) | (arcmin2) |
| 1 – 2 | 0.2 |
| 2 – 3 | 1.7 |
| 3 – 4 | 2.5 |
| 4 – 5 | 3.0 |
| 5 – 6 | 3.0 |
| 6 – 7 | 3.0 |
| 7 – 8 | 2.9 |
| 8 – 9 | 2.7 |
| 9 – 10 | 2.7 |
| 10 – 11 | 2.7 |
References
- (1)
- (2) Bell, E. F., & Kennicutt, R. C. Jr. 2001, ApJ, 548, 681
- (3)
- (4) Bellazzini, M., Cacciari, C., Federici, L., Fusi Pecci, F., & Rich, R. M. 2003, A&A, 405, 867
- (5)
- (6) Bica, E. 1988, A&A, 195, 76
- (7)
- (8) Bland-Hawthorn, J., Vlajic, M., Freeman, K. C., & Draine, B. T. 2005, ApJ, 629, 239
- (9)
- (10) Cole, A. A., Smecker-Hane, T. A., & Gallagher, J. S. III 2000, AJ, 120, 1808
- (11)
- (12) Crampton, D. et al. 2000, Proc. SPIE, 4008, 114
- (13)
- (14) Da Costa, G. S., & Armandroff, T. E. 1990, AJ, 100, 162
- (15)
- (16) Danks, A. C., Laustsen, S., & van Woerden, H. 1979, A&A, 73, 247
- (17)
- (18) Davidge, T. J. 2000, AJ, 120, 1853
- (19)
- (20) Davidge, T. J. 2006, ApJ, 641, 822
- (21)
- (22) Davidge, T. J. 2007a, AJ, 134, 1799
- (23)
- (24) Davidge, T. J. 2007b, ApJ, 664, 820
- (25)
- (26) Deharveng, J.-M., Jedrzejewski, R., Crane, P., Disney, M. J., & Rocca-Volmerange, B. 1997, A&A, 326, 528
- (27)
- (28) Ferraro, F. R., Origlia, L., Testa, V., & Maraston, C. 2004, ApJ, 608, 772
- (29)
- (30) Freeman, K. C. 1970, ApJ, 160, 811
- (31)
- (32) Fukugita, M., Ichikawa, T. Gunn, J. E., Doi, M., Simasaku, K., & Schneider, D. P. 1996, AJ, 111, 1748
- (33)
- (34) Gallagher, J. S., Faber, S. M., & Balick, B. 1975, ApJ, 202, 7
- (35)
- (36) Girardi, L., Grebel, E. K., Odenkirchen, M., & Chiosi, C. 2004, A&A, 422, 205
- (37)
- (38) Harris, W. E., & van den Bergh, S. 1981, AJ, 86, 1627
- (39)
- (40) Heckman, T. M. 2002, in ASP Conf. Ser. 254, Extragalactic Gas at Low Redshifts, ed. J. S. Mulchaey & J. Stocke (san Francisco: ASP), 292
- (41)
- (42) Heckman, T. M., Armus, L., & Miley, G. K. 1990, ApJS, 74, 833
- (43)
- (44) Hodge, P. W., & Kennicutt, R. C. Jr. 1983, AJ, 88, 296
- (45)
- (46) Humphreys, R. M., & McElroy, D. B. 1984, ApJ, 284, 565
- (47)
- (48) Jarrett, T. H., Chester, T., Cutri, R., Schneider, S. E., & Huchra, J. P. 2003, AJ, 125, 525
- (49)
- (50) Karachentsev, I. D., et al. 2002, A&A, 385, 21
- (51)
- (52) Karachentsev, I. D., et al. 2007, AJ, 133, 504
- (53)
- (54) Kennicutt, R. C. Jr. 1998, ARA&A, 36, 189
- (55)
- (56) Kraft, R. P., Nolan, L. A., Ponman, T. J., Jones, C., & Raychaudhury, S. 2005, ApJ, 625, 785
- (57)
- (58) Landolt, A. U. 1992, AJ, 104, 340
- (59)
- (60) Lee, M. G., Freedman, W. L., & Madore, B. F. 1993, ApJ, 417, 553
- (61)
- (62) Maraston, C. 2005, MNRAS, 362, 799
- (63)
- (64) Marcillac, D., Elbaz, D., Charlot, S., Liang, Y. C., Hammer, F., Flores, H., Cesarsky, C., & Pasquali, A. 2006, A&A, 458, 369
- (65)
- (66) Mayya, Y. D., Bressan, A., Carrasco, L., & Hernandez-Martinez, L. 2006, ApJ, 649, 172
- (67)
- (68) McMillan, R., Ciardullo, R., & Jacoby, G. H. 1994, AJ, 108, 1610
- (69)
- (70) Naab, T., & Ostriker, J. P. 2006, MNRAS, 366, 899
- (71)
- (72) O’Connell, R. W., & Mangano, J. J. 1978, ApJ, 221, 62
- (73)
- (74) Ortolani, S., Barbuy, B., & Bica, E. 1991, A&A, 249, L31
- (75)
- (76) Pérez-González, P. G. et al. 2006, ApJ, 648, 987
- (77)
- (78) Persson, S. E., Aaronson, M., Cohen, J. G., Frogel, J. A., & Matthews, K. 1983, ApJ, 266, 105
- (79)
- (80) Pessev, P. M., Goudfrooij, P., Puzia, T. H., & Chandar, R. 2006, 2006, AJ, 132, 781
- (81)
- (82) Pritchet, C. 1979, ApJ, 231, 354
- (83)
- (84) Puche, D., & Carignan, C. 1991, ApJ, 378, 487
- (85)
- (86) Rana, N. C. 1991, ARA&A, 29, 129
- (87)
- (88) Rice, W., et al. 1988, ApJS, 68, 91
- (89)
- (90) Robin, A. C., Reyle, C., Derriere, S., & Picaud, S. 2003, A&A, 409, 523
- (91)
- (92) Rocca-Volmerange, B., & Guiderdoni, B. 1987, A&A, 175, 15
- (93)
- (94) Salaris, M., & Girardi, L. 2005, MNRAS, 357, 669
- (95)
- (96) Schlegel, D. J., Finkbeiner, D. P., & Davis, M. 1998, ApJ, 500, 525
- (97)
- (98) Sivan, J.-P., Petit, H., Comte, G., & Maucherat, A. J. 1990, A&A, 237, 23
- (99)
- (100) Smail, I., Hogg, D. W., Yan, L., & Cohen, J. G. 1995, ApJ, 449, L105
- (101)
- (102) Smith, J. A. et al. 2002, AJ, 123, 2121
- (103)
- (104) Smith, L. J., Westmoquette, M. S., Gallagher, J. S. III, O’Connell, R. W., Rosario, D. J., & de Grijs, R. 2006, MNRAS, 370, 513
- (105)
- (106) Stetson, P. B. 1987, PASP, 99, 191
- (107)
- (108) Stetson, P. B., & Harris, W. E. 1988, AJ, 96, 909
- (109)
- (110) van den Bergh, S. 1976, AJ, 81, 795
- (111)
- (112) van der Kruit, P. C. 1986, A&A, 157, 230
- (113)
- (114) van Woerden, H., van Driel, W., Braun, R., & Rots, A. H. 1993, A&A, 269, 15
- (115)
- (116) Wyse, R. F. G., & Gilmore, G. 1995, AJ, 110, 2771
- (117)