11email: alexandre.beelen@ias.u-psud.fr 22institutetext: Institut d’Astrophysique de Paris, CNRS and Université Pierre et Marie Curie, 98bis, bd Arago, 75014 Paris / France 33institutetext: Max-Planck-Institut für Radioastronomie, Auf dem Hügel 69, 53121 Bonn / Germany 44institutetext: European Southen Observatory, Karl Schwarzschild Straße 2, D-85748 Garching / Germany 55institutetext: Spitzer Science Center, California Institute of Technology, Mail Code 220-6, Pasadena, CA 91125-0600 / USA
Submillimeter observations of the J2142-4423 Ly protocluster at ††thanks: This work is based on observations made with the APEX Telescope. APEX is a collaboration between the Max-Planck-Institut für Radioastronomie, the European Southern Observatory, and the Onsala Space Observatory.
Abstract
Aims. We present observations aimed at exploring both the nature of Ly emitting nebulae (“Ly blobs”) at and the way they trace large scale structure (LSS), by exploring their proximity to “maximum starbursts” through submillimeter emission. Our most important objectives are to make a census of associated submillimeter galaxies (SMGs), check their properties, and look for a possible overdensity in the protocluster J2142-4426 at .
Methods. We used the newly commissioned Large APEX Bolometer Camera (LABoCa) on the Atacama Pathfinder EXperiment (APEX) telescope, in its Science Verification phase, to carry out a deep map at 870 , and we performed multiple checks of the quality of data processing and source extraction.
Results. Our map, the first published deep image, confirms the capabilities of APEX/LABoCa as the most efficient current equipment for wide and deep submm mapping. Twenty-two sources were securely extracted with 870 flux densities in the range , rms noise , and far-IR luminosities probably in the range . Only one of the four 50 kpc-extended Ly blobs has a secure 870 counterpart. The 870 source counts in the whole area are marginally higher than in the SHADES SCUBA survey, with a possible over-density around this blob. The majority of the SEDs of the submillimeter sources indicate they are starburst dominated, with redshifts mostly . However, there is evidence of a high-z AGN in of the sources.
Key Words.:
galaxies: starburst – galaxies: high-redshift – submillimeter – infrared: galaxies – ultraviolet: galaxies – large-scale structure of universe1 Introduction
Narrow-band surveys are a very powerful technique for detecting Lyman emission from various structures at high redshift. In addition to numerous Ly galaxies, they have revealed the existence of very extended () Ly nebulae, generally called Ly blobs (see e.g. Francis et al. 1996; Steidel et al. 2000; Palunas et al. 2004; Matsuda et al. 2007, and references therein). Currently, only about 10 blobs with diameter, , are known, and twice more with (see e.g. Matsuda et al. 2004, 2007; Smith & Jarvis 2007, and references therein). They are generally part of larger structures of Ly emitters of various sizes.
The origin of the Ly emission in such blobs is still a matter of discussion. Widespread Ly emission is known to be associated with starbursts and shocks. Multiple supernovae explosions, including galactic outflows, associated with giant starbursts, could be excellent candidates for powering Ly emission. But accretion cooling flows (e.g. Nilsson et al. 2006; Smith & Jarvis 2007) and an obscured AGN have also been suggested as other possible power sources. Ly blobs present many similarities with high redshift radio galaxies, which often have giant Ly haloes up to (see Miley & De Breuck 2008, for a review). However, all Ly blobs observed to date remain undetected in deep radio observations, excluding the possibility that their Ly emission is powered by a radio-loud AGN like in the radio galaxies.Whatever is their power source, there is evidence that Ly blobs are strong infrared emitters. For instance, most of the 35 Ly blobs with identified by Matsuda et al. (2004) in the SA 22 region have been detected in deep Spitzer IRAC/MIPS observations (Yamada 2007, Huang et al. in preparation).
The 110 Mpc filament with 37 Ly-emitting objects around the galaxy protocluster J2143-4423 at is one of the largest known structures at high (Palunas et al. 2004; Francis et al. 2004). In addition to its compact Ly galaxies, it also includes four extended Ly blobs (). From Spitzer/MIPS observations, Colbert et al. (2006) have reported the detection of a number of 24 sources associated with Ly emitters. In a central area of the J2143-4423 region, they have detected five 24 sources with a flux density, , closely associated with Ly emitters, three of them being extended Ly blobs. The far-infrared luminosities, LFIR, that they inferred, range from to . There are also three other similar 24 sources with a looser (within ) association to the 50 kpc-Ly blobs. 111The nomenclature about Ly blobs is still a bit confused. A Ly blob (or LAB) refers clearly to an extended or resolved region of Ly emission. However, the evidence for extension depends on the quality of the optical image. In the prototype region SA 22, there is a list of several tens of LABs down to an extension of (see e.g. Table 1 of Geach et al. 2005). In the J2143-4423 region, extensions are published only to (), for four blobs, B1, B5, B6, B7 (see Table 4 of Palunas et al. 2004). However, other unresolved Ly emitters are also labeled B2, B4, B8 and B9 (Francis et al. 1996, 1997; Palunas et al. 2004; Colbert et al. 2006). To avoid confusion, we will call extended objects of the first group 50 kpc-Ly blobs
Such a concentration of Ly blobs suggests an exceptionally large structure (110 Mpc) above . However, neither Ly, nor 24 emissions can give an unambiguous answer to the exact nature of the galaxies and their star formation properties. Submillimeter observations are fundamental to determine the far-IR luminosity of the various 24 sources associated with Ly emitters, and thus their star formation rate. The SCUBA 870 study by Geach et al. (2005) of the similar structure SA 22 discovered by Steidel et al. (2000), with similar Ly luminosity and a larger number of Ly blobs (Matsuda et al. 2004), detected about 20% of the blobs (with possible statistical detection of the full sample). This could indicate that their FIR luminosity FIR luminosity is starburst powered, with FIR luminosities in the ultra-luminous regime (), equivalent to a star formation rate approaching . However, the relation between the Ly and even 24 emission of the blobs to their star formation rate is probably not straightforward, as shown by the surprising non-detection of the strongest () SA 22 SCUBA source in the high-resolution submillimeter imaging of Matsuda et al. (2007), indicating extended submm emission.
In this context, we used the newly commissioned Large Apex Bolometer Camera (LABoCa) (Siringo et al. 2007, 2008 in prep.) to check the properties of ultra-luminous starbursts in the J2143-4423 Ly blobs and their surrounding field. The paper is organized as follows : Section 2 describes the observation with LABoCa of the central part of the z=2.38 Ly-emitter over-density at , (J2000), which was observed at 24 by Colbert et al. (2006), Section 3 presents our analysis and in Section 4 we discuss the results and report our conclusions. Throughout the paper, we assume a concordance -cosmology with , and .
2 Observation
2.1 LABoCa Observations
Observations were conducted using LABoCa (Siringo et al. 2007, 2008 in prep.) installed on the Atacama Pathfinder EXperiment (APEX, Güsten et al. 2006). LABoCa is an array consisting of 295 bolometers arranged in 9 concentric hexagons, operating in total power at 280 mK, with a half-power spectral bandwidth from 313 to 372 GHz, and an effective frequency of 345 GHz (870 ). The number of bolometers with sky response is 266, of which 15 show signature of cross talk and 18 have very low sensitivity; in total 33 bolometers have been discarded from the data analysis. Two additional bolometers have been blinded in order to record the temperature variation of the detector wafer. The complete array field of view covers 11.4′. Using fully sampled observations of Mars, we derived, for each detector, the relative gains and relative positions of the bolometers; the latter were found to be stable within 1″. The gains have been normalized using the median value of all valid bolometers. The effective radial beam profile deduced from Mars observations is shown in Fig. 1. Once deconvolved from the size of Mars, varying from 6.5″ to 6.9″during the observations, the beam profile can be approximated, within a few percent, by a single Gaussian beam of half power beam width (HPBW) of for point source studies.

During the two disjoint observing periods, 2007 July 07-15 and August 15-28 (ESO program ID : 078.F-9030(A) and MPIfR 080.F-9502(A), respectively), the atmospheric conditions were excellent, with typical zenith opacities between 0.07 and 0.17 and a median value of 0.12 at 870 . The telescope pointing was checked once an hour using the nearby radio source PMN~J1957-3845 and was found to be stable within a few arc seconds in azimuth and elevation. The focus setting in the Z direction was checked regularly every 2 to 3 hours on Mars, and at least every day in the X and Y direction and was found to be stable in each direction. The target area was mapped with a raster of scans in horizontal coordinates tracing spirals displaced from each other in a way to obtain optimum spatial sampling. Simulations were made using BoA (see subsection below) in order to derive the best spiral parameters to obtain a fully sampled map of the sky with the actual foot pattern of LABoCa and with little overhead compared to classical On-The-Fly observing mode. The total on sky integration time was 14+7=21 hours.
The absolute flux calibration is based on observations of Mars during the first observing run and a model222see http://www.lesia.obspm.fr/~lellouch/mars/ developed by E. Lellouch, H. Amri and R. Moreno, using general climate model predictions of martian surface and sub-surface temperatures 333see http://www-mars.lmd.jussieu.fr/, and radiative transfer within the surface. The predicted total flux of Mars varied from 660 to 711 Jy, over the first observing period. After correction for the angular extent of Mars, the derived calibration factor for LABoCa is . The absolute flux calibration uncertainty is thus about 7%. Flux densities quoted in the following do not include this uncertainty since it is only useful when compared to other instruments.
2.2 Data Reduction
The data were reduced with an updated version of the BOlometer Array Analysis Software (BoA), a newly designed free software package to handle bolometer array data. BoA is a collaborative effort of scientists at the Max-Planck-Institut für Radioastronomie (MPIfR), Argelander-Institut für Astronomy (AIfA), Astronomisches Institut Ruhr Universität Bochum (AIRUB) and Institut d’Astrophysique Spatiale (IAS), with the primary goal of handling data from LABoCa at APEX, but it can also be used to process data acquired with other instruments such as ASZCa (Dobbs et al. 2006) and (p)ArTéMiS at APEX or MAMBO Kreysa et al. (1998) at the IRAM 30-m telescope.
The data are corrected for atmospheric opacity at the time of the observation by a linear interpolation from a combination of skydips and APEX radiometer measurements. Using the two blind bolometers, it is possible to correct for the temperature variation of the helium-3 stage over the complete observation. Flat-fielding was then applied based on bolometer relative gains on known primary calibrators. Before any further processing, the data stream was flagged according to the telescope pattern to avoid high accelerations, responsible for microphonics, as well as low and high speed, in order to properly disentangle the sky signal spatial frequencies from the atmospheric emission. The sky emission was iteratively estimated and removed using the median value of all valid bolometers, over the whole array first, then by grouping the bolometers by electronics boxes or cables to remove any remaining correlated signal due to the electronics or micro-phonics pick-up. This removed the atmospheric emission satisfactorily across the array and no or little correlated signal is seen after applying this procedure. An iterative despiking is applied to the data, before removing a linear baseline. A last flagging was set up on the bolometers according to the Median Absolute Deviation of their variance in order to filter very noisy or dead bolometers. Finally the data are weighted by the inverse of their variance, and gridded on the sky with a pixel size of one third of the beam, about 6″, the flux in each pixel being the weighted-average of all bolometers observing that position, producing a signal () and a weight () map. Each scan was visually inspected in order to remove obvious problems like wrong sky noise removal, data corruption, canceled scans or bolometers warming up during the observations.
Other methods were tried to remove atmospheric noise, in particular one based on principal component analysis (PCA), where the signal is transformed to a coordinate system where the first axis correspond to the greatest variance of the data. By removing the first few coordinates and projecting the data back to its original basis, the atmospheric emission, responsible for most of the signal is then removed. Both methods, removing median signal and the PCA, show very similar results. Moreover the data was independently reduced following a totally different approach (see Kovács 2006, for an introduction) by using the mini-crush program. The final map and source list are compatible with the result presented here.
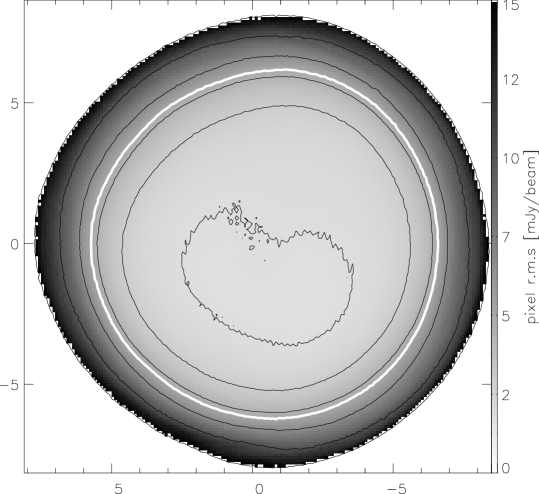
On the best 10% observed region, corresponding to a homogeneously observed surface of , the pixel rms is 1.93 mJy/beam, which correspond roughly to a point source sensitivity rms of 1.4 mJy, as the pixel size is a fraction of the beam. By rescaling the weight map with this value, we produced a noise map shown in Fig. 2. The noise is fairly flat in the center of the map with a pixel rms between 1.95 and 5 mJy/beam and increases rapidly toward the edge of it. In the following we will limit our study to the area with better than 5 mJy/beam pixel rms, corresponding roughly to a surface of , or 60% of our map; this corresponds to the white thick line in Fig. 2.
2.3 Source Extraction
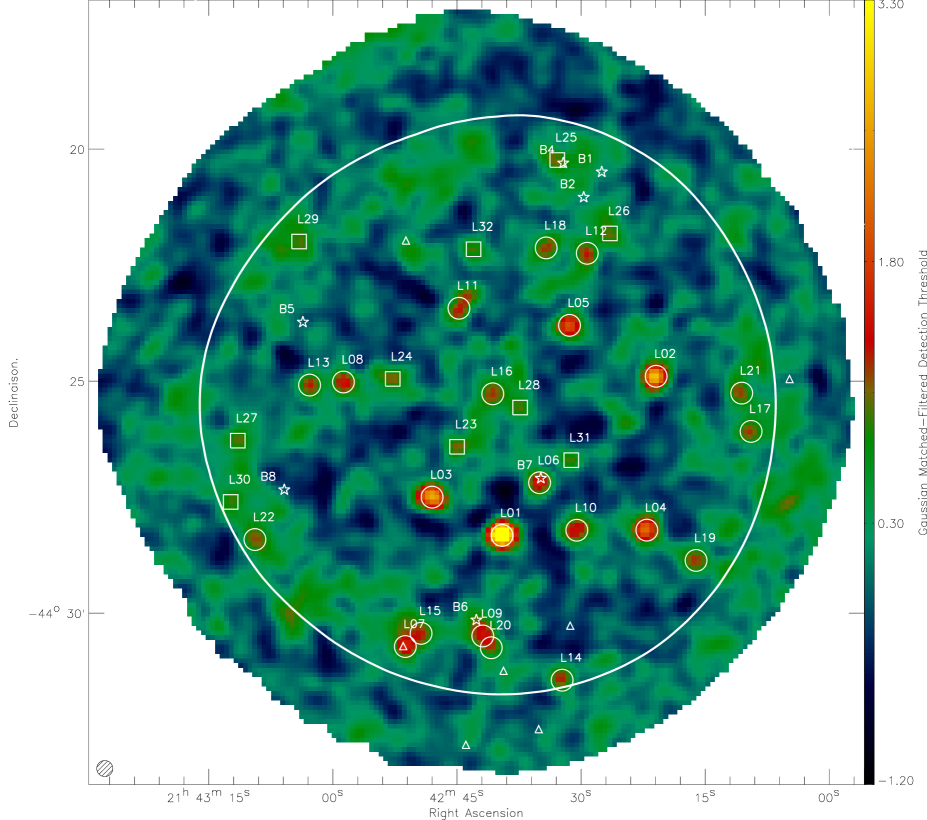
As seen in Fig. 2, the noise is not uniform over the observed field, and the signal (S) and weight (W) map were gaussian-matched-filtered to take this into account. The FWHM of the gaussian () filter was set to , in order to take into account the HPBW of LABoCa and a typical pointing error of 3″. Following Serjeant et al. (2003), the detection threshold map after this noise-weighted convolution can be expressed as
and is presented in Fig. 3.
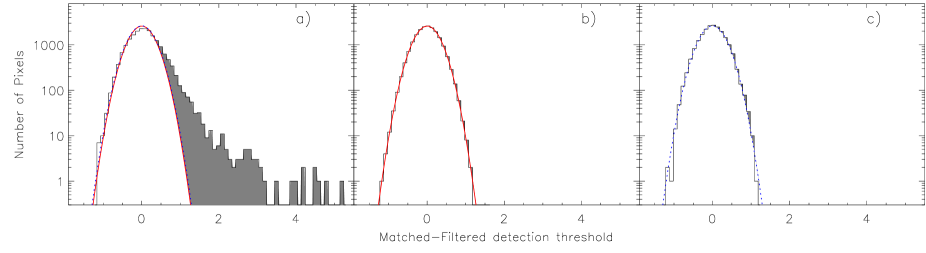
In order to test the robustness of the galaxy candidate identification, two tests were performed. The first test is derived from the jackknife test where the observations are divided into two randomly chosen samples of equal size. The difference of the two maps should remove both resolved and confused sources signal and its histogram should be described by a pure Gaussian. Figure 4 presents the average result of 100 jackknifed maps. A Gaussian distribution fits very well the negative part of the jackknife histogram, and shows no positive-side excess indicating that the jackknife procedure did remove all source signal. For the second test, the relative positions of the bolometers were shuffled inside the field of view, corrupting their astrometry. In the resulting co-added map, any coherent source on the sky should be smeared out in the noise, and any positive excess on the map pixel distribution will be suppressed, while the noise properties of the resulting map remain similar to the real map. Figure 4 shows the histogram of one astrometry-corrupted map, whose negative part is very well fitted by a Gaussian distribution and which presents no or very little excess on the positive side, due to the smearing over the map of the sources signal.
The histogram of the detection threshold map is also shown in Fig 4. The negative part of the histogram is highly Gaussian and is well described by the over-plotted Gaussian fits of the jackknifed and astrometry-corrupted distribution, showing a clear excess on the positive side. The galaxy candidates clearly account for this excess, as the residual map, after source extraction, does not show such a significant excess.
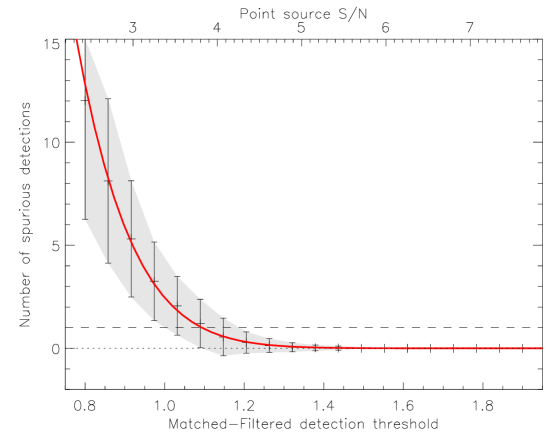
In order to determine the false detection rate, we produced 100 jackknifed maps and performed source extraction, using a clean algorithm (Högbom 1974), with different detection thresholds. This gives a realistic picture of the number of spurious sources expected in our map at a given threshold. However, the jackknifed maps are free of confusion noise, therefore the number of spurious sources might be a slightly underestimated. The result is shown in Fig. 5, where the solid line is an exponential fit to the data as . We find that a Gaussian matched-filtered detection threshold of 1.2 results in at most one spurious source expected at random, whereas with a threshold of 1.0 we expect about four spurious sources. Translated into the non-filtered map, these thresholds correspond roughly to a signal-to-noise ratio for point source of 4.3 and 3.4, respectively.
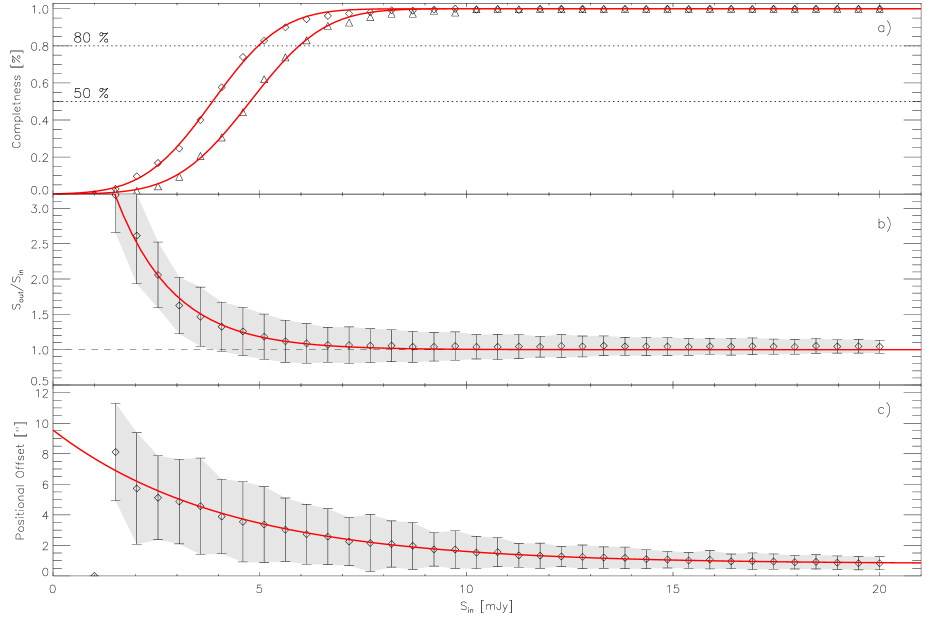
The measured fluxes in a map are biased toward high values due to instrumental, atmospheric and confusion noise, this is known as the “flux boosting” effect. We performed Monte-Carlo simulations to test the completeness, flux boosting and positional uncertainties of the source extraction algorithm. Using one jackknifed map we added, at a random position in the map, one source with flux between 1 and 20 mJy in steps of 0.5 mJy. Repeating this process 500 times for each flux bin, source extraction was made by selecting all regions with a detection threshold, , and we computed the flux densities within an aperture of 20.4″ directly in the non-filtered map. The photometry correction is derived from the high signal to noise map of Mars and is about 7%. The results of these simulations are presented in Fig. 6 for a Gaussian matched-filtered signal-to-noise threshold ratio of 1.00. As expected, the source extraction performs well in extracting all the brighter sources but degrades when dealing with fainter sources. At a flux density of 4 mJy, the completeness is about per cent. The effect of flux boosting is clearly seen for faint flux densities, where the instrumental noise tends to favor detection of sources coinciding with positive noise peaks. At a flux density level of 4 mJy, this effect is on the order of 35 per cent, decreasing exponentially for higher fluxes. Last, the positional offset due to the source extraction algorithm is found to be approximately 4″ for a flux density of 4 mJy and decreasing for higher fluxes. For a flux density of 10 mJy, this positional error is about 1″, corresponding to one sixth of a pixel, negligible with respect to the pointing error.
Within the region of interest of the Gaussian matched-filtered map, we performed source extraction with a threshold of , leading to the detection of 22 sources with and 10 additional sources below this threshold where we expect, in total on the full sample, between 1 and at most 5 spurious sources. The source candidates are listed in Tab. 1, in decreasing Gaussian matched-filtered detection threshold () order and are also seen in Fig. 3. The listed flux densities are corrected for the boosting flux effect and are in the range of 2.9 to 21.1 mJy. The flux uncertainties are computed from dispersion in the sky annulus and the uncertainty in the mean sky brightness. The quoted uncertainties are also corrected for the boosting flux effect but do not propagate its uncertainties.
3 Analysis
3.1 Number counts
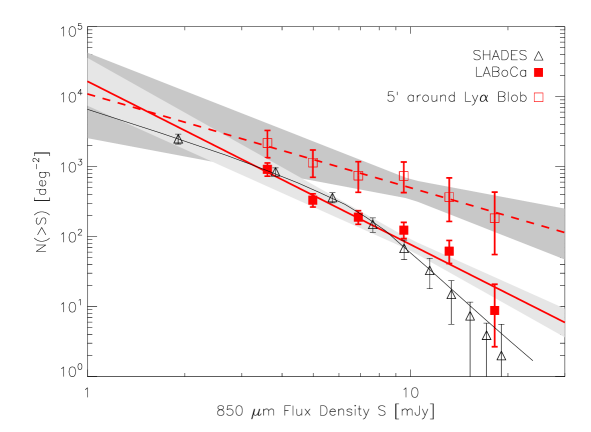
We performed a cumulative number count analysis on the detected sources using the fluxes corrected for the flux boosting effect and for the completeness of the survey as discussed previously. Based on 22 sources, the 870 integrated number counts are presented in Fig. 7 and are well described by a power law of the form : with the parameter , we derived and . On the same figure, we also show the cumulative combined SHADES number counts obtained by Coppin et al. (2006) on a field down to an rms of 2 mJy where galaxies were uncovered. Our sample of 22 sources is too small to allow any meaningful detailed analysis of the number count distribution, and, for example, we do not see any trend for a break in the power law as in the SHADES data. However, we tentatively observe an over density of sources at . This is confirmed when we look at the number counts of 4 sources in a 5′ diameter circle around the source L06, identified as a Ly blob (see below), with a power law parametrized by and . The density of submillimeter galaxies is then one order of magnitude, at a level, higher than for unbiased submillimeter field galaxies.
3.2 Mid-IR Source Identifications
Identification of millimeter and submillimeter galaxies has mainly used the strong correlation between the far-IR and radio luminosities, tracing respectively, warm dust heated by hot, young O-type stars and non-thermal emission resulting from supernova explosions, both phenomena of ongoing star formation. With the low density of faint radio sources, it is unlikely to have a chance association within a few arc second (see e.g. Ivison et al. 2007, and references therein). Unfortunately, no sensitive radio observation is available to date on the observed field. Nevertheless, Mid-IR imaging with e.g. Spitzer has also been used to identify SMGs (Pope et al. 2006; Ivison et al. 2007), although the position uncertainties are larger than for the radio observation and the link between Mid-IR and Far-IR emission is not as well defined as the one between Far-IR and radio (see e.g. Bavouzet et al. 2007) . We used data taken with IRAC (at 3.6, 4.5, 5.8 and 8.0 ) (Colbert et al. in prep.) and MIPS (at 24 ) (Colbert et al. 2006) to identify the sources detected at 870 . From the 3.6 catalog we derived the photometry in all IRAC bands and matched it to the 24 catalog within a search radius of 2″ to produce a global search catalog. Stars were removed using a simple color criterion of (Rodighiero et al. 2006).
Following Condon (1997) and Ivison et al. (2007), the positional uncertainties of a three free parameter Gaussian fit is , where is the beam HPBW and is the flux signal to noise ratio. Adopting a conservative lower value of , the rms position uncertainties are on the order of 4″ in both axes. Taking into account a possible shift between Spitzer and LABoCa absolute astrometric frames on the order of , we have adopted a final search radius of .
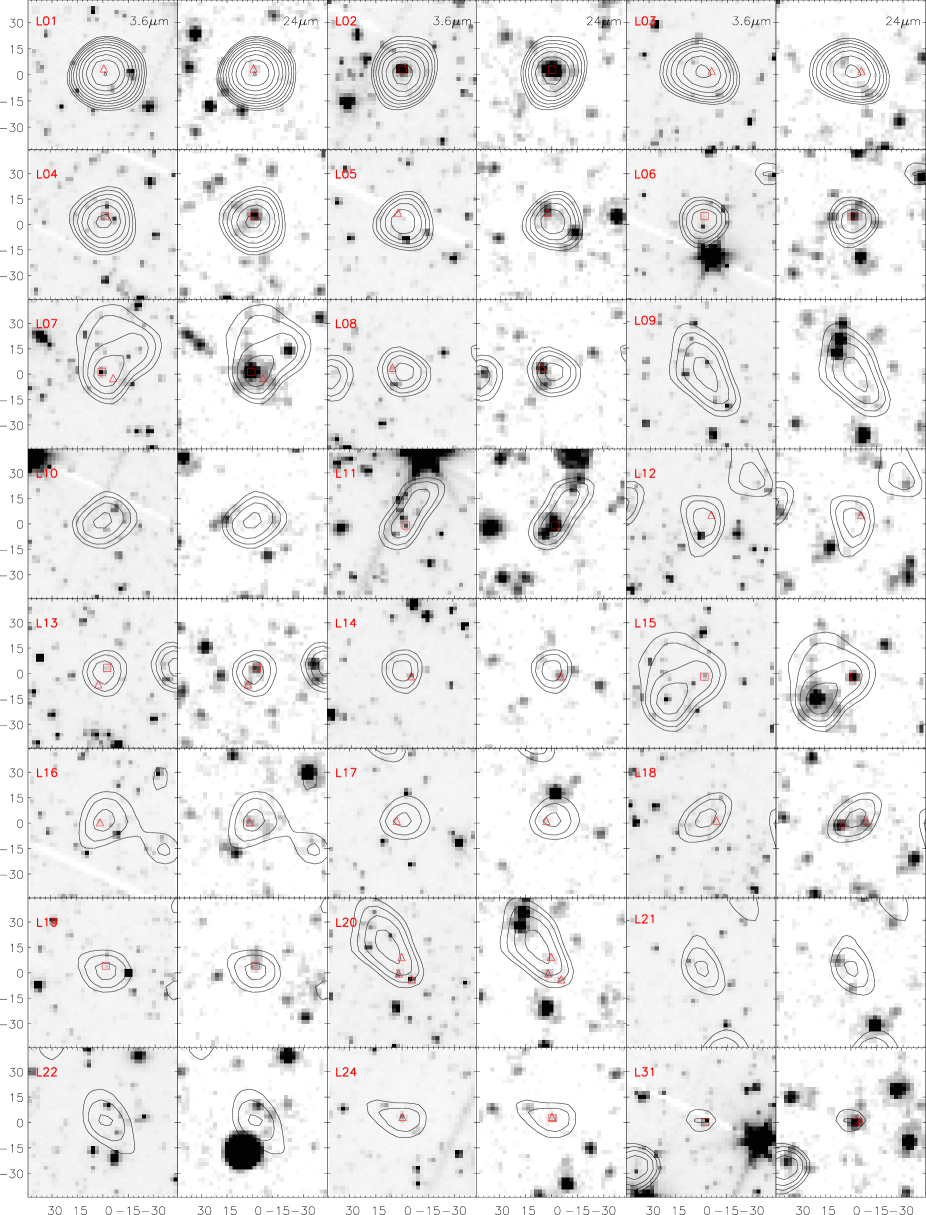
For each 870 source, we searched for all counterparts in the full Mid-IR catalog and we computed the corrected Poisson probability of a chance association using the method described in Downes et al. (1986) with the number counts at 24 and 3.6 of Papovich et al. (2004); Lagache et al. (2004) and Fazio et al. (2004), the latter with IRAC on Spitzer. The position and flux densities of all 24 and 3.6 counterparts within 8″of the 870 LABoCa sources are presented in Table 2, where the most reliable counterparts, with , are listed in bold face. From the 22+12 detected SMGs, ten show a robust counterpart at 24 , 15 others have a 24 counterpart with a probability of spurious association, and finally ten sources do not show a counterpart within 8″. Practically all these 24 sources but one, have a secure IRAC associate (within ) detected at least at 3.6 (Table 2). Figure 8 presents postage stamp images of the 3.6 and 24 emission centered on the 22 securely detected SMGs with . The lack of radio data over that field leads to only half of the sources having a secure counterpart, whereas it is of order of two-thirds in other submillimeter studies (Pope et al. 2006; Ivison et al. 2007) in which source positions are validated by radio identifications. If one takes into account less secure associations (Tab. 2), the total proportion of 24 associations become comparable.
From the four 50 kpc-Ly blobs present in the observed field (Palunas et al. 2004), of which three are detected at 24 (Colbert et al. 2006), only one, B7, is detected at 870 . None of the other Ly emitters present in the 870 image is securely detected, placing an upper limit on their flux densities of (). However, there are hints of emission near the Ly blobs B4 and B6.
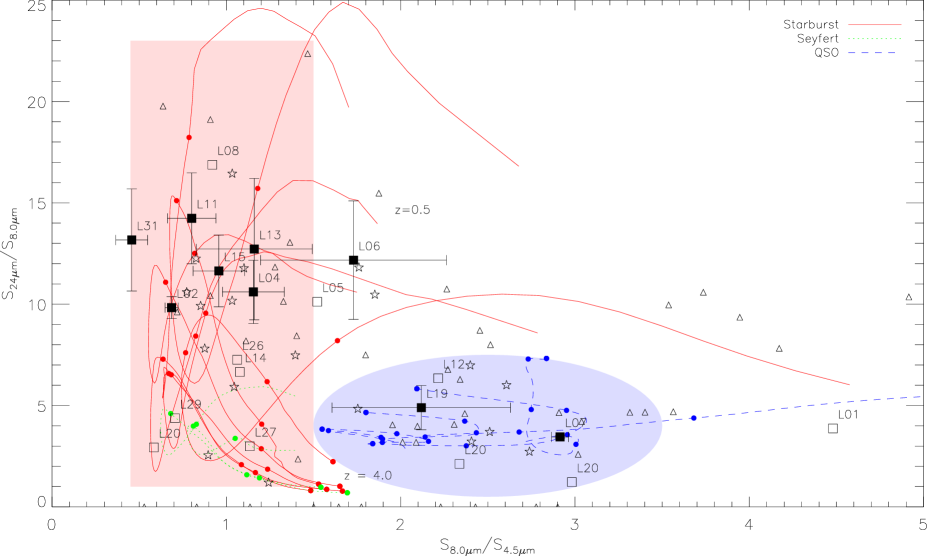
Mid-IR colors can be used to distinguish between starburst and AGN emission (Ivison et al. 2004; Pope et al. 2006; Ivison et al. 2007). We compared the 24 /8.0 and 8.0 /4.5 color of the 9 sources with robust and complete Mid-IR counterpart, with the SWIRE template SED library of typical galaxies described in Polletta et al. (2007). We used 14 template SEDs consisting of 6 starbursts corresponding to the SED of Arp 220, M 82, NGC 6090, NGC 6240, IRAS 22491-1808, and IRAS 20551-4250, and 6 QSO-like SED, 3 type-1 and 2 type-2 and Mrk 231. We also included 2 moderately luminous AGN representing Seyfert 1.8 and Seyfert 2 galaxies (see Polletta et al. 2007, for a detailed description). These templates were redshifted from to 4 and flux densities where computed using the IRAC and MIPS filters. The results are presented in Fig. 9, for all the sources in Tab. 2, together with sources with secure counterparts of Pope et al. (2006) and Seymour et al. (2007). From this diagram, it appears that 6/9 sources (L02, L04, L11, L13, L15 and L33) have colors similar to starburst galaxies at redshift between 1 and 3, whereas 2/9 (L07 and L11) are more likely to be quasars. Finally, one, L06 lies close to the starburst region (see Fig.9).
3.3 Notes on Individual Objects
L01 – This source is among the strongest submillimeter sources and is not securely associated with any Mid-IR source. No radio emission at 843 MHz is detected at the source position in the Sydney University Molonglo Sky Survey (SUMSS) (Mauch et al. 2003) placing an upper limit on the radio flux density of 10 mJy. The submm-to-radio spectral index is then which places this source at following the submm-to-radio spectral index relation of Carilli & Yun (2000) with the spectrum of M82 as template. The possible Spitzer counterpart reported in Tab. 2 has a IR SED typical of an AGN. However, the very large ratio is incompatible with an AGN, but rather needs a strong starburst SED such as that of Arp 220. It is therefore possible that the main Spitzer counterpart is undetected. With a secure completeness limit of , using the limit for the ratio , we can estimate a lower limit on the source’s redshift at (although remains possible with a highly obscured SED). It is even possible that this source is extended or associated with multiple objects within the large LABoCa beam, like other very strong submillimeter sources such as SMM J123711.7+622212 (GN20) (Pope et al. 2006; Iono et al. 2006) or LAB1-SA 22 (Matsuda et al. 2007). Using a modified blackbody with a dust temperature of 40 K and a spectral index of 1.5, this corresponds to an infrared luminosity of .
L02 – This source has a very strong 24 flux and Mid-IR colors well within the starburst region in Fig. 9. There is a radio source at 9.6″ displaced from our nominal position in the SUMSS Catalog. Due to the large beam of the radio observation, it is possible that these two sources are associated, making L02 a radio loud source. Its SED would then be similar to e.g. 4C 41.17 (Seymour et al. 2007; Archibald et al. 2001) but at much lower redshift , compatible with the ratio of 9. However given this low ratio, this source could also be at higher redshift, up to 2.5.
L04 – From the IRAC color of this source, we infer a starburst template (Fig. 9) with a redshifted stellar maximum emission in the 5.8 band and an infrared redshift of inferred from a combination of the four IRAC fluxes (Pope et al. 2006) . Using Arp 220 or IRAS 20551-4250 as best matched templates, we derive an infrared luminosity of .
L06 – This source is associated with the Ly Blob B7 at of Palunas et al. (2004). This is one of the sources with the largest excess flux in the narrow band Ly filter compared to the B filter. It has a very good 24 association (Colbert et al. 2006). There appear to be additional MIPS sources at short distance of 15 ″. The SED of L06 is similar to IRAS 19254-7245 South, a Seyfert 2 and Starbust/ULIRG composite leading to placing this source in the ULIRG regime. With a Ly-IR relation of , this source lies on the trend found by Geach et al. (2005).
L07 – This source is associated with the QSO [FPT2004] J214251.50-443043.2 detected by Francis et al. (2004) at with a B magnitude of . The SED of L07 is well described by a typical type 1 QSO SED with high IR counterpart, with an inferred luminosity of .
L11 – As for L04, the SED rather indicates a starburst (Fig. 9) with a stellar bump in the 5.8 band. The infrared redshift of this source is . Using this redshift and the SED of IRAS 20551-4250, we derive an infrared luminosity of .
L13 – Having a similar SED to L04, this source has a infrared redshift of , and an inferred infrared luminosity of .
L15 – This source has a typical starburst SED like IRAS 20551-4250 with an infrared redshift of and luminosity of . If this redshift estimate is right, the proximity on the sky of L07 and L15 (Figs. 3 and 8) is fortuitous.
L19 – If the association of Tab. 2 is correct, the mid-IR SED and colors are typical of an AGN, with an uncertain redshift, probably 2–3.
Nine sources have at least one counterpart within the search radius of 8″ and within the completeness limit of , but the associations are less secure with probabilities of spurious association in the range 0.05–0.20. For three of them, L03, L05 L14, the ratio, greater than 135, indicates most likely starburst galaxies and places them at , but they could be at a lower redshift if their SEDs where strongly obscured. For the six other galaxy candidates, L08, L12, L16, L17, L18, L20, the ratio, ranging from to , places them at , or around if they have obscured SEDs similar to Arp 220. In the case of L12, the tentative counterpart presents typical colors of an AGN, which would place it at very high redshift ().
Two sources, L09 and L10, have no counterpart candidates within the completeness limit of the 24 observations. With respective lower limits for the ratio of 140 and 120, these sources are likely to be starbursts at or at lower redshift in case of a strongly obscured starburst SED. L09 is close to the position of the Ly Blob B6, but the blending with L20 makes the association unlikely. Last, L21 has also no counterpart candidates but with a lower flux density, this source’s redshift is more likely to be around 1.5.
The quality of the submillimeter fluxes of the ten other sources, L22-32 of Tab. 1 & 2, is lower, as well as most of their possible Spitzer associations. Exceptions of L24 which has a high probability 24 counterpart (see Fig. 8), with , indicating a starburst at , L25 which lies close to the Ly Blob B4, but the higher noise on the edge of the map prevents any firm conclusion and L31 which seems to lie on the edge of the starburst region on the color-color diagram presented Fig. 9 and has .
4 Discussion & Conclusions
By detecting high-z powerful ULIRGs (), our results may cast some light on the association of such SMGs not only with the Ly blobs themselves, but also with the large scale structure that they trace. The meager submillimeter detection rate of only one Ly blob confirms the findings of Geach et al. (2005) that maximum starbursts with are present in only a minority of even 50 kpc-Ly blobs. The detection rate of one out of four 50 kpc-Ly blobs and none in the three other blobs may appear significantly lower than in those of SA 22 by Geach et al. (2005) who detected three out of ten 50 kpc-Ly blobs, and two more among 15 additional moderately extended () blobs. But one should also take into account that, except the detected blob L06/B7, all other blobs are located in regions of the map with relatively high noise, , i.e. larger than the rms of the detections of B7 or of Geach et al. (2005) by factors . Moreover there is a 870 detection () at the 24 position of the B6 blob of Colbert et al. (2006). There are two 870 sources, L09 and L20, within of B6. The average values of the 870 flux densities for undetected blobs – for the 50 kpc-blobs B1, B5 & B6, and for all, B1, B2, B4, B5, B6 & B8 – are also compatible with the value of Geach et al. (2005), for all their blobs. Nevertheless, the non detection at 870 of the blobs B4 and B6 excludes the very large far-IR luminosities, , inferred by Colbert et al. (2006), placing upper limits rather .
More important, we have detected at least twenty additional sources at 870 , with indications that several of them could be associated with the LSS traced by the Ly blobs. As discussed in Sect. 3.3, out of 21 most secure detections outside of L06/B7, 7 sources, L03, L04 L05, L09, L10, L13 & L15, with starburst-like SED have probable redshifts in the range 2.0–2.8 compatible with the redshift of the galaxies protocluster J2143-4423 at ; moreover seven additional sources, L01, L08, L12, L16, L17, L18 & L20 have more uncertain redshifts, but still not incompatible with . Only L02 and L07 have clear indication of lower redshifts. As quoted in Sect. 3.1, five detected sources, are within a circle of diameter 5′ centred on B7, yielding an apparent strong over-density (Fig. 7), which is another argument for their possible membership of a protocluster at . However, spectroscopic determination of the redshifts will be mandatory to confirm the existence of such a compact protocluster and the membership of these SMGs.
The possible redshifts of our submillimeter detections, with most of the sources probably at are in agreement with the general distribution of the redshifts of SMGs (Chapman et al. 2005). However, regarding the nature of the sources, we note a trend for a larger proportion () of AGN-starburst composite mid-IR SEDs than is usually found (e.g. Valiante et al. 2007; Pope et al. 2007): L06/B7 itself has clearly such a profile, as well as L07 and L19 and possibly L12 and L20; there is a possible match of L02 with a radio galaxy although its SED looks starburst dominated at . As discussed, the case of one of the strongest submillimeter sources known to date, L01 () is not completely clear since the mid-IR SED of a possible Spitzer counterpart looks AGN dominated, while the 870 /24 flux ratio suggests a starburst-dominated profile.
This first published deep map illustrates and confirms the capabilities of the LABoCa camera on APEX. As expected, it is currently the most efficient equipment for wide and deep submillimeter mapping. The multiple checks that we have performed about the overall quality of the map, of the achieved signal-to-noise ratio and of the source extraction demonstrate the efficiency of the observing mode and of the data processing which were used and optimized for this work.
The first priority for further work aimed at confirming the nature of these SMGs and their possible relationship with the Ly blobs and their underlying structure, is the determination of their redshifts. Both optical and near-IR determinations should be possible if the redshifts are in the range of , and they should be especially easy for AGN. More complete optical and near-IR data could be useful for this purpose and for considering the possibility of adaptive optics studies to trace the source’s inner structures. Deep radio data (with ATCA, VLA and/or GMRT) would be important to trace the star formation rates and if possible the extension of starbursts, as well as the radio spectral index for trying to disentangle AGN and starburst contributions. Stacking 870 intensities of radio and Spitzer 24 and IRAC sources will extend the information about source counts and the average star formation rate to weaker submillimeter sources. In parallel, a deeper or wider LABoCa map would be useful to increase the number of individual detections, especially of Ly blobs, and the stacking accuracy. High resolution (sub)millimeter imaging would be essential to check the spatial structure, especially of the strongest source L01, similarly to the observation of LAB01-SA22 by Matsuda et al. (2007). Waiting for ALMA, the J2143-4423 region is just at the limit of observability with SMA.
Acknowledgements.
We thank the referee for comments, which improved the manuscript. We thank F. Schuller for help during the development of the BoA software. AB thanks M. Douspis and M. Langer for their useful interactions during the writing of this paper. This work is based on observations made with the APEX Telescope and the Spitzer Space Telescope. APEX is a collaboration between the Max-Planck-Institut für Radioastronomie, the European Southern Observatory, and the Onsala Space Observatory. The Spitzer Space Telescope is operated by the Jet Propulsion Laboratory, California Institute of Technology under NASA contract 1407. We thank the APEX staff and astronomers for their support during the observations and the Bolometer Development Group at the MPIfR for providing the LABoCa bolometer array. Last, but not least, AB thanks the staff of Adobe and Cafe Export in San Pedro de Atacama.References
- Archibald et al. (2001) Archibald, E. N., Dunlop, J. S., Hughes, D. H., et al. 2001, MNRAS, 323, 417
- Bavouzet et al. (2007) Bavouzet, N., Dole, H., Le Floc’h, E., et al. 2007, ArXiv e-prints, 712
- Carilli & Yun (2000) Carilli, C. L. & Yun, M. S. 2000, ApJ, 539, 1024
- Chapman et al. (2005) Chapman, S. C., Blain, A. W., Smail, I., & Ivison, R. J. 2005, ApJ, 622, 772
- Colbert et al. (2006) Colbert, J. W., Teplitz, H., Francis, P., et al. 2006, ApJ, 637, L89
- Condon (1997) Condon, J. J. 1997, PASP, 109, 166
- Coppin et al. (2006) Coppin, K., Chapin, E. L., Mortier, A. M. J., et al. 2006, MNRAS, 372, 1621
- Dobbs et al. (2006) Dobbs, M., Halverson, N. W., Ade, P. A. R., et al. 2006, New Astronomy Review, 50, 960
- Downes et al. (1986) Downes, A. J. B., Peacock, J. A., Savage, A., & Carrie, D. R. 1986, MNRAS, 218, 31
- Fazio et al. (2004) Fazio, G. G., Ashby, M. L. N., Barmby, P., et al. 2004, ApJS, 154, 39
- Francis et al. (2004) Francis, P. J., Palunas, P., Teplitz, H. I., Williger, G. M., & Woodgate, B. E. 2004, ApJ, 614, 75
- Francis et al. (1997) Francis, P. J., Woodgate, B. E., & Danks, A. C. 1997, ApJ, 482, L25+
- Francis et al. (1996) Francis, P. J., Woodgate, B. E., Warren, S. J., et al. 1996, ApJ, 457, 490
- Geach et al. (2005) Geach, J. E., Matsuda, Y., Smail, I., et al. 2005, MNRAS, 363, 1398
- Güsten et al. (2006) Güsten, R., Nyman, L. Å., Schilke, P., et al. 2006, A&A, 454, L13
- Högbom (1974) Högbom, J. A. 1974, A&AS, 15, 417
- Iono et al. (2006) Iono, D., Peck, A. B., Pope, A., et al. 2006, ApJ, 640, L1
- Ivison et al. (2007) Ivison, R. J., Greve, T. R., Dunlop, J. S., et al. 2007, MNRAS, 380, 199
- Ivison et al. (2004) Ivison, R. J., Greve, T. R., Serjeant, S., et al. 2004, ApJS, 154, 124
- Kovács (2006) Kovács, A. 2006, PhD thesis, Caltech
- Kreysa et al. (1998) Kreysa, E., Gemuend, H.-P., Gromke, J., et al. 1998, in Presented at the Society of Photo-Optical Instrumentation Engineers (SPIE) Conference, Vol. 3357, Proc. SPIE Vol. 3357, p. 319-325, Advanced Technology MMW, Radio, and Terahertz Telescopes, Thomas G. Phillips; Ed., ed. T. G. Phillips, 319–325
- Lagache et al. (2004) Lagache, G., Dole, H., Puget, J.-L., et al. 2004, ApJS, 154, 112
- Matsuda et al. (2007) Matsuda, Y., Iono, D., Ohta, K., et al. 2007, ApJ, 667, 667
- Matsuda et al. (2004) Matsuda, Y., Yamada, T., Hayashino, T., et al. 2004, AJ, 128, 569
- Mauch et al. (2003) Mauch, T., Murphy, T., Buttery, H. J., et al. 2003, MNRAS, 342, 1117
- Miley & De Breuck (2008) Miley, G. & De Breuck, C. 2008, A&A Rev., 15, 67
- Nilsson et al. (2006) Nilsson, K. K., Fynbo, J. P. U., Møller, P., Sommer-Larsen, J., & Ledoux, C. 2006, A&A, 452, L23
- Palunas et al. (2004) Palunas, P., Teplitz, H. I., Francis, P. J., Williger, G. M., & Woodgate, B. E. 2004, ApJ, 602, 545
- Papovich et al. (2004) Papovich, C., Dole, H., Egami, E., et al. 2004, ApJS, 154, 70
- Polletta et al. (2007) Polletta, M., Tajer, M., Maraschi, L., et al. 2007, ArXiv Astrophysics e-prints
- Pope et al. (2007) Pope, A., Chary, R.-R., Alexander, D. M., et al. 2007, ArXiv e-prints, 711
- Pope et al. (2006) Pope, A., Scott, D., Dickinson, M., et al. 2006, MNRAS, 370, 1185
- Rodighiero et al. (2006) Rodighiero, G., Lari, C., Pozzi, F., et al. 2006, MNRAS, 371, 1891
- Serjeant et al. (2003) Serjeant, S., Dunlop, J. S., Mann, R. G., et al. 2003, MNRAS, 344, 887
- Seymour et al. (2007) Seymour, N., Stern, D., De Breuck, C., et al. 2007, ApJS, 171, 353
- Siringo et al. (2007) Siringo, G., Weiss, A., Kreysa, E., et al. 2007, The Messenger, 129, 2
- Smith & Jarvis (2007) Smith, D. J. B. & Jarvis, M. J. 2007, MNRAS, 378, L49
- Steidel et al. (2000) Steidel, C. C., Adelberger, K. L., Shapley, A. E., et al. 2000, ApJ, 532, 170
- Valiante et al. (2007) Valiante, E., Lutz, D., Sturm, E., et al. 2007, ApJ, 660, 1060
- Yamada (2007) Yamada, T. 2007, http://sfig.pmo.ac.cn/xining/
| Name | Nickname | 444Gaussian matched-filtered detection threshold | Notes555Identification of the source (see text) | |||
| (IAU) | (J2000) | [mJy]666Corrected from the flux boosting effect 777The absolute flux uncertainty is not included | ||||
| LABoCa J214239-442820 | L01 | 21 42 39.56 | -44 28 20.12 | 5.22 | ||
| LABoCa J214220-442454 | L02 | 21 42 20.98 | -44 24 54.22 | 3.07 | SB | |
| LABoCa J214248-442730 | L03 | 21 42 48.00 | -44 27 30.62 | 2.90 | ||
| LABoCa J214222-442813 | L04 | 21 42 22.08 | -44 28 13.16 | 2.35 | SB | |
| LABoCa J214231-442348 | L05 | 21 42 31.44 | -44 23 48.46 | 2.16 | ||
| LABoCa J214235-442711 | L06 | 21 42 35.03 | -44 27 11.99 | 1.81 | B7 | |
| LABoCa J214251-443043 | L07 | 21 42 51.24 | -44 30 43.73 | 1.75 | QSO | |
| LABoCa J214258-442501 | L08 | 21 42 58.69 | -44 25 01.70 | 1.64 | ||
| LABoCa J214241-443030 | L09 | 21 42 41.88 | -44 30 30.08 | 1.60 | ||
| LABoCa J214230-442813 | L10 | 21 42 30.54 | -44 28 13.34 | 1.58 | ||
| LABoCa J214244-442326 | L11 | 21 42 44.76 | -44 23 26.40 | 1.41 | SB | |
| LABoCa J214229-442215 | L12 | 21 42 29.30 | -44 22 15.30 | 1.41 | ||
| LABoCa J214302-442505 | L13 | 21 43 02.77 | -44 25 05.64 | 1.40 | SB | |
| LABoCa J214232-443127 | L14 | 21 42 32.30 | -44 31 27.24 | 1.38 | ||
| LABoCa J214249-443026 | L15 | 21 42 49.34 | -44 30 26.70 | 1.37 | SB | |
| LABoCa J214240-442517 | L16 | 21 42 40.68 | -44 25 17.04 | 1.32 | ||
| LABoCa J214209-442605 | L17 | 21 42 09.52 | -44 26 05.32 | 1.31 | ||
| LABoCa J214234-442208 | L18 | 21 42 34.25 | -44 22 08.35 | 1.30 | ||
| LABoCa J214216-442852 | L19 | 21 42 16.14 | -44 28 52.23 | 1.29 | AGN | |
| LABoCa J214240-443045 | L20 | 21 42 40.86 | -44 30 45.31 | 1.29 | ||
| LABoCa J214210-442515 | L21 | 21 42 10.66 | -44 25 15.82 | 1.26 | ||
| LABoCa J214309-442825 | L22 | 21 43 09.39 | -44 28 25.24 | 1.25 | ||
| LABoCa J214244-442625 | L23 | 21 42 44.99 | -44 26 25.55 | 1.19 | ||
| LABoCa J214252-442457 | L24 | 21 42 52.75 | -44 24 57.77 | 1.17 | ||
| LABoCa J214232-442014 | L25 | 21 42 32.92 | -44 20 14.71 | 1.15 | ||
| LABoCa J214226-442149 | L26 | 21 42 26.56 | -44 21 49.64 | 1.11 | ||
| LABoCa J214311-442617 | L27 | 21 43 11.44 | -44 26 17.39 | 1.08 | ||
| LABoCa J214237-442534 | L28 | 21 42 37.38 | -44 25 34.77 | 1.05 | ||
| LABoCa J214304-442200 | L29 | 21 43 04.02 | -44 22 00.10 | 1.04 | ||
| LABoCa J214312-442736 | L30 | 21 43 12.32 | -44 27 36.62 | 1.02 | ||
| LABoCa J214231-442642 | L31 | 21 42 31.22 | -44 26 42.79 | 1.02 | SB | |
| LABoCa J214242-442210 | L32 | 21 42 43.00 | -44 22 10.13 | 1.01 | ||
| Nickname | MIPS 24 | IRAC | |||||||
| R.A. | DEC | Offset | P888P was computed with search radius of 8″. Reliable identifications () are listed in bold. | ||||||
| (J2000) | [] | ″ | [] | [] | [] | [] | |||
| L01 | 21 42 39.64 | -44 28 17.26 | 2.9 | 0.09 | |||||
| L02 | 21 42 21.01 | -44 24 51.89 | 2.3 | 0.00 | |||||
| L03 | 21 42 47.54 | -44 27 29.19 | 5.3 | 0.19 | |||||
| L04 | 21 42 22.07 | -44 28 09.02 | 3.3 | 0.02 | |||||
| L05 | 21 42 31.74 | -44 23 42.51 | 6.2 | 0.10 | |||||
| L06 | 21 42 34.97 | -44 27 08.70 | 3.4 | 0.03 | |||||
| L07 | 21 42 50.74 | -44 30 46.07 | 5.5 | 0.11 | |||||
| 21 42 51.49 | -44 30 43.18 | 2.6 | 0.00 | ||||||
| L08 | 21 42 59.27 | -44 25 00.16 | 6.5 | 0.07 | |||||
| L09 | |||||||||
| L10 | |||||||||
| L11 | 21 42 44.73 | -44 23 28.13 | 2.9 | 0.01 | |||||
| L12 | 21 42 28.95 | -44 22 11.12 | 6.0 | 0.17 | |||||
| L13 | 21 43 03.06 | -44 25 12.13 | 8.0 | 0.19 | |||||
| 21 43 02.64 | -44 25 03.15 | 3.4 | 0.04 | ||||||
| L14 | 21 42 31.91 | -44 31 30.09 | 5.5 | 0.12 | |||||
| L15 | 21 42 49.30 | -44 30 29.73 | 2.8 | 0.02 | |||||
| L16 | 21 42 40.91 | -44 25 17.56 | 2.7 | 0.05 | |||||
| L17 | 21 42 09.94 | -44 26 06.06 | 4.4 | 0.16 | |||||
| L18 | 21 42 33.58 | -44 22 09.80 | 7.9 | 0.13 | |||||
| 21 42 34.81 | -44 22 10.35 | 6.4 | 0.13 | ||||||
| L19 | 21 42 16.07 | -44 28 49.50 | 2.3 | 0.04 | |||||
| L20 | 21 42 41.21 | -44 30 47.57 | 4.0 | 0.11 | |||||
| 21 42 41.12 | -44 30 37.23 | 7.9 | 0.20 | ||||||
| 21 42 40.47 | -44 30 51.02 | 7.2 | 0.19 | ||||||
| L21 | |||||||||
| L22 | |||||||||
| L23 | |||||||||
| L24 | 21 42 52.84 | -44 24 55.95 | 2.6 | 0.07 | |||||
| 21 42 52.85 | -44 24 56.16 | 2.0 | 0.05 | ||||||
| L25 | |||||||||
| L26 | 21 42 26.22 | -44 21 52.39 | 4.8 | 0.09 | |||||
| L27 | 21 43 11.73 | -44 26 16.94 | 2.0 | 0.07 | |||||
| L28 | 21 42 37.36 | -44 25 29.41 | 6.7 | 0.19 | |||||
| 21 42 37.98 | -44 25 35.86 | 6.5 | 0.19 | ||||||
| L29 | 21 43 04.22 | -44 22 06.52 | 7.0 | 0.12 | |||||
| L30 | |||||||||
| L31 | 21 42 31.05 | -44 26 44.61 | 2.4 | 0.01 | |||||
| 21 42 30.73 | -44 26 43.02 | 5.3 | 0.15 | ||||||
| L32 | |||||||||