Thickness dependence of linear and quadratic magneto-optical Kerr effects in ultrathin Fe(001) films
Abstract
Magneto-optical Kerr effect (MOKE) magnetometry is one of the most widely employed techniques for the characterization of ferromagnetic thin film samples. Some information, such as the magnitude of coercive fields or anisotropy strengths can be readily obtained without any knowledge of the optical and magneto-optical (MO) properties of the material. On the other hand, a quantitative analysis, which requires a precise knowledge of the material’s index of refraction and the MO coupling constants and is often desirable, for instance, for the comparison of samples, which are different with respect to ferromagnetic layer thicknesses, substrates, or capping layers. While the values of the parameters and the linear MO coupling parameter reported by different authors usually vary considerably, the relevant quadratic MO coupling parameters even for Fe are completely unknown. Here, we report on measurements of the thickness dependence (0–60 nm) of the linear and quadratic magnetooptical effects in epitaxial bcc-Fe(001) wedge-type samples performed at a commonly used laser wavelength of 670 nm. By fitting the thickness dependence we are able to extract a complete set of parameters , , , and for the quantitative description of the MOKE response of bcc-Fe(001). We find the parameters , , and to significantly differ for films thinner than about 10 nm as compared to thicker films, which is indicative of a thickness dependence of the electronic properties or of surface contributions to the MOKE. The magnitude of the quadratic magnetooptical effect is found to be about one third of the record values reported recently for Co2FeSi.
pacs:
78.20.Ls 78.20.Ci 78.20.Bh 75.70.Ak 75.30.Gw 75.60.-dI Introduction
The magneto-optical Kerr effect (MOKE) of ferromagnetic (FM) thin films has been a field of intensive studies over the last three decades. This interest in MOKE was motivated by three aspects: (i) its importance as a experimental magnetometric tool, (ii) as a means to measure the band structure of FM materials, and (iii) its application in magneto-optical (MO) storage media. MOKE is probably the tool most widely employed for the magnetometric characterization of thin-film samples employed for spintronics. Among its most common applications are the quantitative determination of the coercivity, magnetic anisotropy, and interlayer exchange coupling from the analysis of hysteresis loops recorded with the MOKE signal. Other prominent applications are the investigation of spin dynamics in the time-domain and magnetic domain imaging. The main advantages of the MOKE over other techniques are its compatibility with high magnetic fields, surface sensitivity with a typical information depth of some 10 nm, a time resolution down to the sub-picosecond regime, a reasonable spatial resolution of the order of about 0.5 m, and robust and inexpensive experimental setups.
Many applications neglect the absolute magnitude of the Kerr effect, which is given by the magnitude and phase of the complex Kerr angle. Instead they describe the dependence of the normalized Kerr angle on the magnetization angle by means of adjustable response coefficients. This type of description has the advantage that it does not require any knowledge of the materials’s optics, yet it is sufficient to extract a lot of information, such as the magnitude of the magnetocrystalline anisotropy of FM single-layer systems,Shishen ; JMMM_297_118 or the antiferromagnetic interlayer exchange coupling of FM double-layer systems.JMMM_240_235 ; PhD On the other hand, the absolute magnitude of the complex Kerr angle provides valuable information, which can support the experimental data, and can be employed to quantitatively compare samples with, for instance, different FM layer thicknesses, substrates, or capping layers and to determine the thickness of the FM layers, the MOKE information depth, etc. However, the full quantitative MOKE information is generally not linked by simple analytic formulae to the material properties, which are the indices of refraction and the linear and quadratic MO coupling parameters and of all involved layers. Even in ultrathin films of only some nanometers thickness, a linear dependence of the size of the MOKE response on the FM layer thicknesses, known as additivity law – which has been claimed by Qiu et al. in Ref. PRB_45_7211, – is generally not valid.JAP_98_033516
Therefore, a general numerical treatment of the MOKE by solving Maxwell’s equations and the standard boundary conditions is indispensable for the quantitative interpretation of the Kerr angle. A prerequisite for this calculation is the precise knowledge of the optical and magnetooptical material parameters. Although spectroscopically determined values for and are available for many materials, the overall agreement of the data from different sources is often, as for instance in the case of bcc-Fe,Oppeneer rather poor. The strong variation of the tabulated optical constants is frequently attributed to surface contamination or oxidation of the ex-situ measured samples, but thickness or quality variations of the films are also plausible. For instance, (i) in Ref. PRL_80_5200, the Kerr angle of Fe has been found to oscillate as a function of the thickness of a capping Au layer due to quantum well states, (ii) spectroscopic MOKE data of thin Fe films show features, which cannot be explained by the bulk electronic band structure of Fe,JAP_91_8246 and (iii) there is strong evidence for interfacial contributions in the MOKE.PRB_64_155405
Moreover, the literature values are almost exclusively limited to the first order linear MO coupling parameter . For many FM materials, e.g. from elementary Fe JMMM_172_199 ; PRB_55_8990 ; Shishen ; JAP_91_7293 to the more complex Heusler alloy Co2FeSi,JPD_40_1563 , however, the second order quadratic coupling constants have a comparable impact on the Kerr angle. To our knowledge the only published value of a second order MO coupling constant is the imaginary part of of Ni of about at the wavelength nm, which has been experimentally determined from Brillouin light scattering data by Giovannini et al.PRB_63_104405 The second order magnetooptical parameters, which are , , and for systems with cubic symmetry, give rise to MO effects quadratic and even in the magnetization . These effects are known as quadratic MOKE (QMOKE) or Voigt effect in reflection, and have recently received a lot of attention.JMMM_172_199 ; PRB_55_8990 ; Shishen ; JAP_91_7293 ; JPD_40_1563 Effects quadratic in also turn out to be important in magnetization-dependent second harmonic generation (MSHG),PRB_75_64401 x-ray magnetic linear dichroism and the closely related x-ray Voigt effect.XMLD All the more it is surprising, that to our knowledge no one has yet determined a full set of corresponding material parameters to describe the QMOKE.
Apart from their practical significance for MOKE magnetometry, the MO coupling parameters are also important in fundamental research. From a microscopic point of view the MO coupling is due to the interplay of the exchange exchange interaction leading to a splitting of the bands and the spin-orbit (SO) coupling. It is therefore closely related to the magnetocrystalline anisotropy energy, which also arises due to SO coupling. The MO coupling parameters may be seen as an important probe for the fundamental electronic interactions in FM materials, e.g. spectroscopic MOKE is a widely used standard tool to evaluate the band structure in FM metals.Oppeneer While the linear MO effect is due to first order SO coupling, the quadratic MO coupling is thought to be caused by second order SO coupling terms. The SO coupling is known to be altered at the interfaces and in ultrathin films, which gives rise to the well-known thickness dependence of the magnetocrystalline anisotropy energy, e.g. in Fe,MAE and interfacial MOKE contributions, which have been observed by various authors.PRB_64_155405
In this contribution we report on a magnetometric study of the magnetooptical response of bcc-Fe(001) wedge-type samples with thicknesses ranging from 0 to 60 nm. We have determined both components of the complex Kerr angle, the Kerr rotation and the Kerr ellipticity. Effects linear and quadratic in , LMOKE and QMOKE respectively, are separated by fitting the hysteresis loops to a single domain model. The QMOKE, which is known to be anisotropic, i.e. it depends on the sample orientation with respect to the plane of incidence, has been determined for both Fe(001)[110] and Fe(001)[100] directions parallel to the plane of incidence. By fitting the thickness dependence of LMOKE and QMOKE we are, for the first time, able to extract a full set of Fe material parameters , , , and at a light wavelength of 670 nm. We find a sizeable thickness dependence, which, however, seems to be mainly of non-magnetic origin. The main effect is an increased index of refraction for Fe film thicknesses below about 10 nm as compared to thicker films. A large maximum absolute value of the quadratic Kerr effect (QMOKE) of 0.37 mrad is found at about 22 nm Fe thickness. This value is of a comparable order of magnitude as the recently reported record QMOKE values for Co2FeSi.JPD_40_1563
The paper is organized as follows: In Sec. II.1 we describe briefly the sample preparation. Details of the experimental MOKE setup and the data recording are given in Sec. II.2. Section III deals with the modeling of the MOKE and the hysteresis loops. The results are presented and discussed in Sec. IV. Finally, we summarize our results in Sec. V.
II Experimental details
II.1 Sample preparation and experimental MOKE setup
Epitaxial Fe(wedge)/Ag(1 nm)/Au(2 nm) have been prepared by molecular beam epitaxy on top of a GaAs/Ag(001) buffer system. The Au capping layer has has been chosen thick enough to prevent oxidation and thin enough to be able to determine large Kerr angles. The Ag interface layer has been introduced in order to prevent a possible alloying of Fe and Au. The preparation is described in detail elsewhere.BUER96-1 ; BUER97-1 All thicknesses have been precisely determined using a calibrated quartz crystal monitor. The Fe thickness has been varied continuously between 0 and 8 nm for sample A and stepwise in sample B with discrete Fe thicknesses of 5, 8, 12, 18, 24, 32, 44, and 60 nm.
II.2 MOKE setup
The MOKE measurements were performed using light from a Toshiba TOLD9231M multi-mode laser diode with a wavelength of 670 nm and a spectral half-width of less than 2 nm. An in-plane magnetic field with a maximum strength of 0.7 T is generated by a Broker electromagnet with FM yoke and measured with a Hall probe. The sample is mounted on a manually rotatable holder with an angle scale, which allows a determination of the angle with respect to the plane of incidence with a precision of about .
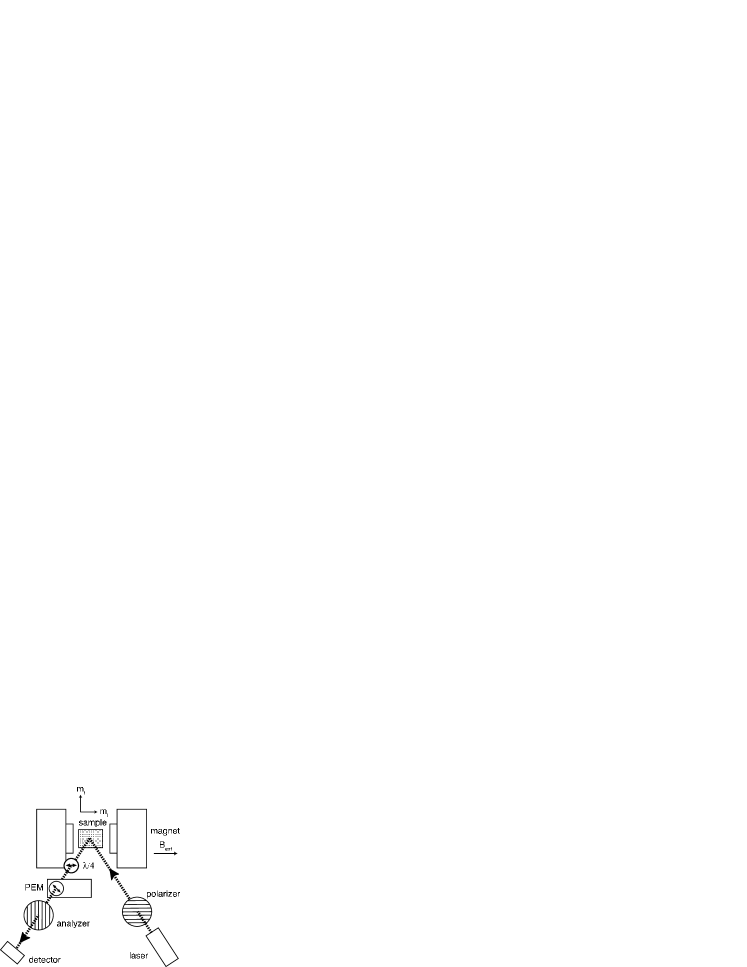
The optical setup consists of a light beam with its plane of incidence parallel to the external field direction illuminating the sample under an angle of incidence of 15∘ with respect to the sample normal (see Fig. 1). The incident light is polarized in direction (electric field component in the plane of incidence) employing a rotatable Glan-Taylor type polarizer. The phase of the reflected light is modulated at a frequency kHz with a HINDS PEM-90 photo elastic modulator (PEM) at diagonal modulation axis (rotated by 45∘ with respect to the -direction) and at a retardation of 90∘. A quarter wave plate with its retardation axis parallel to the direction can be placed between sample and PEM. Consecutively the light passes through an analyzer of the same type as the polarizer, but oriented in direction. The light intensity is then converted into an electrical voltage by a homemade diode detector. In order to avoid possible multiple reflections between the sample and the optical elements in the reflected beam-path, which might impair the data by parasite signals, a diaphragm with a diameter of about 2 mm is placed right after the sample. Analyzer, PEM, and quarter wave plate are slightly tilted with respect to the optical axis so that the light reflected back to the sample is blocked by the diaphragm.
With this setup the small (50 kHz) component determined with a Lock-In amplifier is to first order proportional to the -ellipticity times the reflected intensity, while the much larger (100 kHz) and DC components, recorded simultaneously with a multimeter are to first order proportional to the reflected intensity alone.diplom By introducing a quarter wave plate between sample and PEM we are able to measure the -rotation instead of the ellipticity. The two Kerr angle components ( and ) are calculated by dividing the measured component by the component.
As the amplification factor of the detector is frequency-dependent, the measured Kerr angle has to be calibrated. For this purpose, we have used a thick Au sample and turned the analyzer out of the direction by an angle , while recording the ellipticity and rotation signal. The data are then adjusted such that the measured dependence of the resulting rotation and ellipticity as a function of the polarizer angle matches the theoretical relationship
| (1) |
where and are the diagonal Fresnel reflection coefficients. A value has been calculated using the Fresnel formulas and taking the literature value CRC_HANDBOOK for the index of refraction of Au at our laser wavelength. We have performed the calibration procedure for both the real and imaginary parts of Eq. (1), i.e. with and without quarter wave plate, and find an excellent agreement for the calibration factors (less than 2% difference). This corroborates that the calibration works properly and possible detriments of the measurement by multiple reflections are indeed well under control.
III Numerical modelling of the MOKE and hysteresis loops
The optical and MO material properties can be described by the permittivity tensor , which can be expanded in a power series of the Cartesian direction cosines of the magnetization :
| (2) |
The number of independent linear and quadratic MO coupling constants, and respectively, is reduced by the symmetry of the crystal and the Onsager principle . For cubic symmetry the permittivity tensor is completely defined by five quantities: The nonmagnetic part of the permittivity , which is given by the square of the index of refraction , the linear MO coupling constant , and three independent quadratic MO coupling parameters , and . Instead of the linear MO coupling , the Voigt parameter is frequently used. The complex Kerr angle, which is a measure of the magnitude of the MOKE signal can be calculated using the standard matrix formalism as explained in Refs. Yeh, ; CJP_41_663, ; PRB_43_6423, . Our open-source computer program developed for the calculation of the MOKE can be downloaded from Ref. code, .
The small complex Kerr angle is generally defined as the off-diagonal divided by the diagonal Fresnel reflection coefficients, for instance for incident p-polarized light: . We would like to point out that this definition is insufficient as it does by no means define the sign of the Kerr angle, which depends on the choice of coordinate system, relative orientation of the and directions, the in-plane wave-vector of the light, and the sign of the exponent of the wave function. The sign convention in magneto-optics is indeed a long-standing problem, i.e. different authors report different signs for the complex Kerr and Faraday rotation angles,Oppeneer . Even worse hardly any article gives a clear definition of the employed sign conventions. Therefore, we will here briefly derive an unambiguous definition of the sign, which must include the rotational sense of the Kerr angle, the geometry of the experimental setup, and the orientation of the longitudinal and transversal components and of the magnetization. We define the complex rotation to be positive when the rotational vector is pointing in the propagation direction of the reflected light, i.e. the polarization vector ( direction) is rotated in clockwise direction when looking in the direction of the reflected beam. The orientation of the coordinate system is defined as depicted in Fig. 1 with positive , which is also the direction of a positive external field pointing to the right, pointing up, and , which is the direction of the in-plane light wavevector, pointing to the left when looking onto the the sample. With this convention for a 60 nm Fe film the Kerr rotation due to a positive results in a negative Kerr rotation and a positive Kerr ellipticity . The negative Kerr rotation is equivalent in sign to a counterclockwise turn (looking in direction of the incident beam) of the polarizer and the positive ellipticity to a clockwise turn of the polarizer out of the direction, respectively.
It is convenient to expand the Kerr angle as a function of the directional cosines of the magnetization vector ,JAP_91_7293 e.g. for in-plane magnetization:
| (3) |
where are the longitudinal (LMOKE), and the quadratic, and the usually much smaller transversal (TMOKE) response coefficients. Similar relations hold for the more general case including out-of-plane magnetization, the Faraday effect, and even the calculation of Brillouin light scattering intensities, PRB_75_184436 which are closely related to the MOKE problem.
Note that some authors use a different form for the second quadratic term, namely , which is equivalent to our term, if the magnetization is in a single domain state except for a factor of and a constant offset of . In the case of a multi-domain state this kind of description does not generally hold as additional significant MO effects due to the magnetization gradient PSSA_118_271 can be present. The longitudinal coefficients stem from the linear MO coupling parameter alone and are known to be isotropic, i.e. independent on the sample orientation, as long as the FM layers have cubic symmetry. By contrast, the quadratic coefficients are due to a combined effect of the linear and quadratic MO couplings and are anisotropic, i.e. they depend on the relative orientation of the sample with respect to the plane of incidence. For cubic systems the resulting coefficients have been found to have the form: JAP_91_7293
| (4) | |||
| (5) |
where is the angle between the in-plane component of the light wavevector and an in-plane Fe[001] direction, and and are QMOKE constants for the plane of incidence parallel to the [001] and [011] directions, respectively. The anisotropy of the QMOKE stems from the symmetry of the effective SO coupling tensor , which is closely related to the symmetry of the crystal. For Fe(001) with in-plane magnetization and are the relevant SO coupling parameters for the [011] () and [001] direction (), respectively. The parameter is a measure for the anisotropy strength.JAP_91_7293
The coefficients have an isotropic and an anisotropic contribution. They depend on the sum of and . JAP_91_7293 Therefore, errors in the determination of and affect the accuracy of the values. A wrong sign of the value will not simply lead to wrong signs, but to wrong values of the second order MO coupling constants. On the other hand, the coefficients stem purely from the parameters, namely from ,JAP_91_7293 and vanish if the plane of incidence is parallel to the symmetry directions [001] and [011].
The response coefficients can be determined experimentally – at least for single layer systems – with a suitable setup, for instance, by rotating the field. JAP_91_7293 ; ROTMOKE They can also be calculated numerically from the optical and MO material parameters , , and . As our MOKE setup does not allow for a field rotation, we choose here the alternative approach of analyzing remagnetization loops recorded at different sample orientations.
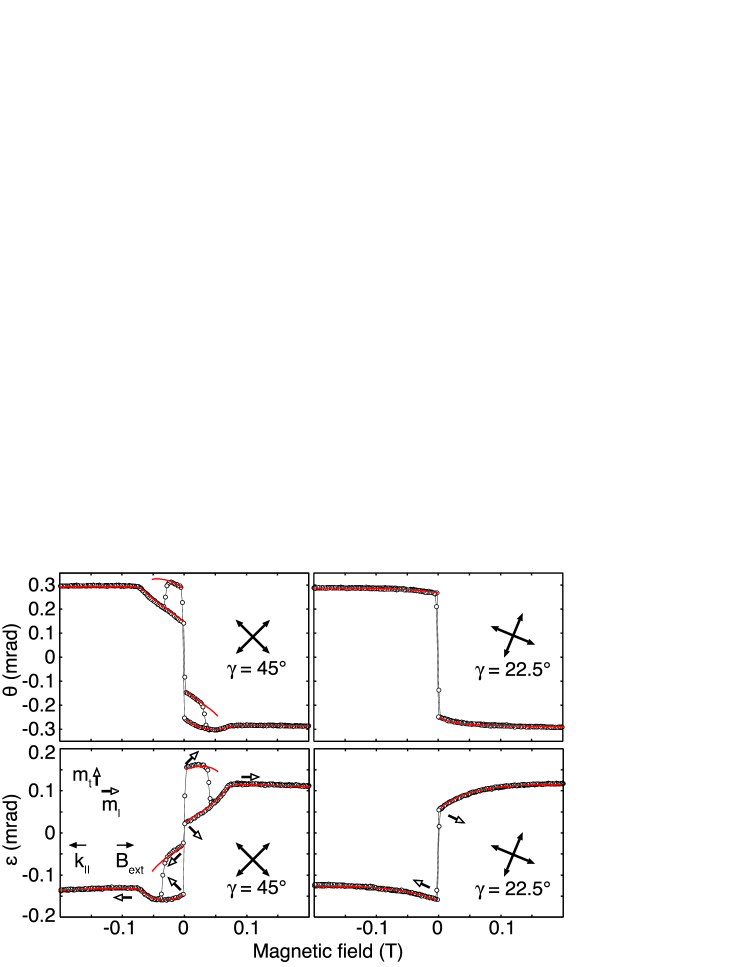
Typical MOKE loops for a 60 nm Fe film are shown in Fig. 2. The experimental Kerr rotation (top graphs) and ellipticity (bottom graphs) are plotted with connected open circles. We have determined the MOKE response coefficients , , and by fitting experimental remagnetization loops to a single domain model taking into account the sample orientation , the cubic anisotropy parameter , and describing the Kerr angle via Eqs. (3–5). While the left loops recorded at an angle , i.e. with field parallel to a hard [011] direction, depend on and , the right loops are recorded at and, therefore, depend on and both and . Thus, a simultaneous fitting of the loops for both orientations yields a full set of MOKE response coefficients , , and .
IV Results and discussion
IV.1 Linear MOKE
The thickness dependence of the experimental linear MOKE extracted from the hard axis loops is marked in Fig. 3 by red circles and blue triangles for sample A and B, respectively. The data for thicknesses of 5 nm and 8 nm measured for both samples are in excellent agreement indicating that the sample quality and thickness calibration of samples A and B are very similar. The upper and lower curves corresponds to the imaginary and real part of the Kerr angle (ellipticity and rotation ), respectively. In agreement with the results of previous publications on similar systems, PRB_45_7211 the Kerr ellipticity increases linearly with the film thickness below 5 nm, which is indicative for the law of additivity of the MOKE effect size to be valid in this regime. On the other hand, there is no such linear behavior for the Kerr rotation, which changes sign at about 4 nm, meaning that the additivity does not hold for the Kerr rotation. This breakdown of the additivity law is due to the dominant imaginary phase of the Kerr angle found for ultrathin Fe layers on noble metal substrates. In contrast, on semiconducting substrates, e.g. GaAs, the Kerr angle of Fe is mainly real and the additivity holds for the rotation, but not for the ellipticity. JAP_98_033516 For thicker layers, the phase of the electromagnetic wave inside the Fe layer changes due to the real part of the perpendicular wavevector component and therefore, gives rise to negative Kerr ellipticity contributions coming from Fe layers buried deeper than about 12 nm, where the slope changes sign. On the other hand, the imaginary part of the wavevector leads to a decreasing intensity of the electromagnetic wave with increasing depth inside the film, which determines the information depth of about 40 nm, where the slope begins to asymptotically flatten.
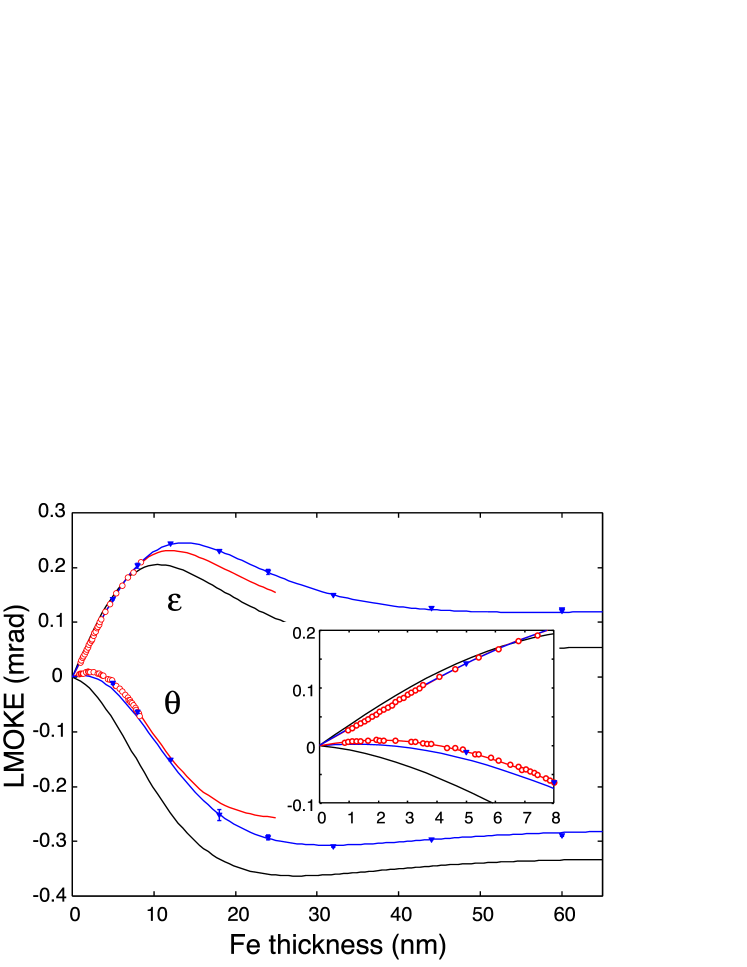
The thickness dependence calculated using literature values of the indices of refraction from Refs. CRC_HANDBOOK, and Yolken, , , , , and the linear MO coupling from Ref. Krinchik, is plotted as black lines. As found earlier by Qiu et al., PRB_45_7211 the material constants from literature approximately reproduce the Kerr ellipticity, which is insensitive to small phase changes of . However, the literature data fail to describe the Kerr rotation.
We have fitted our experimental data employing the full matrix formalism Yeh ; CJP_41_663 using fixed indices of refraction for Ag and Au from literature as specified above, and treating the index of refraction and the MO coupling of Fe as free parameters. The red and blue curves in Fig. 3 correspond to the data of samples A and B, respectively. The fit results are listed in Table 1. It turns out that a satisfactory fit over the whole thickness range with only one thickness-independent set of material parameters is impossible. The fit to the data of sample A with smaller thicknesses results in a significantly about 10% larger index of refraction with different phase as compared to the thicker sample B. On the other hand, the MO coupling parameter mainly differs in phase by about 10∘, while the absolute values are in rather good agreement within less than 3% difference. Thus, it seems that the difference between thin and thick Fe layers is mainly of optic rather than of magneto-optic origin.
Our value of the index of refraction of Fe determined from the data of the thicker sample B, , compares reasonably well with the value of Yolken and Kruger.Yolken While the real part is in excellent agreement, our imaginary part is about 7% smaller, which is probably within in the range of the systematic experimental errors. On the other hand, our value for the linear MO coupling for sample B is significantly by about 20% smaller and has a phase difference of about 17∘ compared to the data of Krinchik and Artemev.Krinchik
The curve fitted to the data from the thinner sample departs from the experimental data at about 15 nm, which corresponds to approximately half the penetration depth of the light. This circumstance might hint at an improper description of the optical properties of the Ag substrate as a reason for the apparent thickness dependence of the index of refraction of Fe. The substrate mainly influences the Kerr angle for Fe thicknesses below 15 nm as the light reflected from the substrate can reach the sample surface. In order to test this conjecture, we have additionally fitted the data with the indexes of refraction of the substrate and capping layers as free parameters. However, we could not substantially improve the overall quantitative agreement of the fits. Therefore, improper optical parameters of the non-magnetic layers can be ruled out as a reason for the encountered thickness dependence of the optical Fe properties. Possible explanations for the thickness dependence are: (i) The tensile strain of the Fe due to the small lattice mismatch of 0.7% between Fe and the Ag substrate leading to an anisotropic permittivity tensor, (ii) altered electronic properties of the thin Fe layer due to the proximity to the noble metal substrate and the capping layers, which can have a sizable influence, PRL_80_5200 ; PRB_64_155405 and (iii) interfacial MOKE contributions, PRB_64_155405 which have been neglected in the theoretical description.
IV.2 Quadratic MOKE
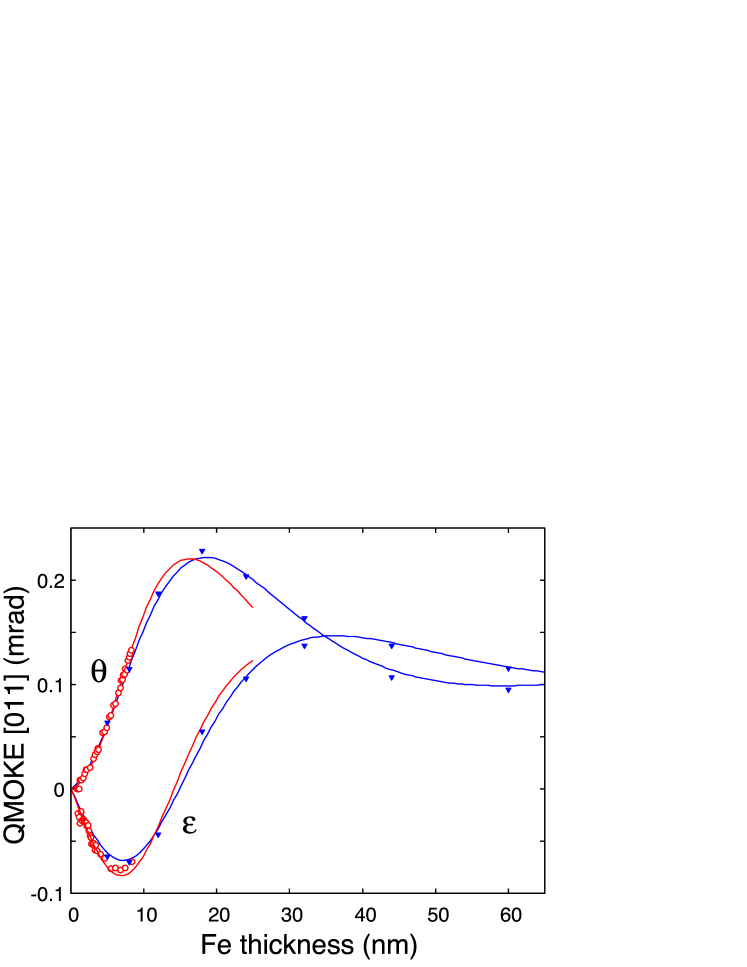
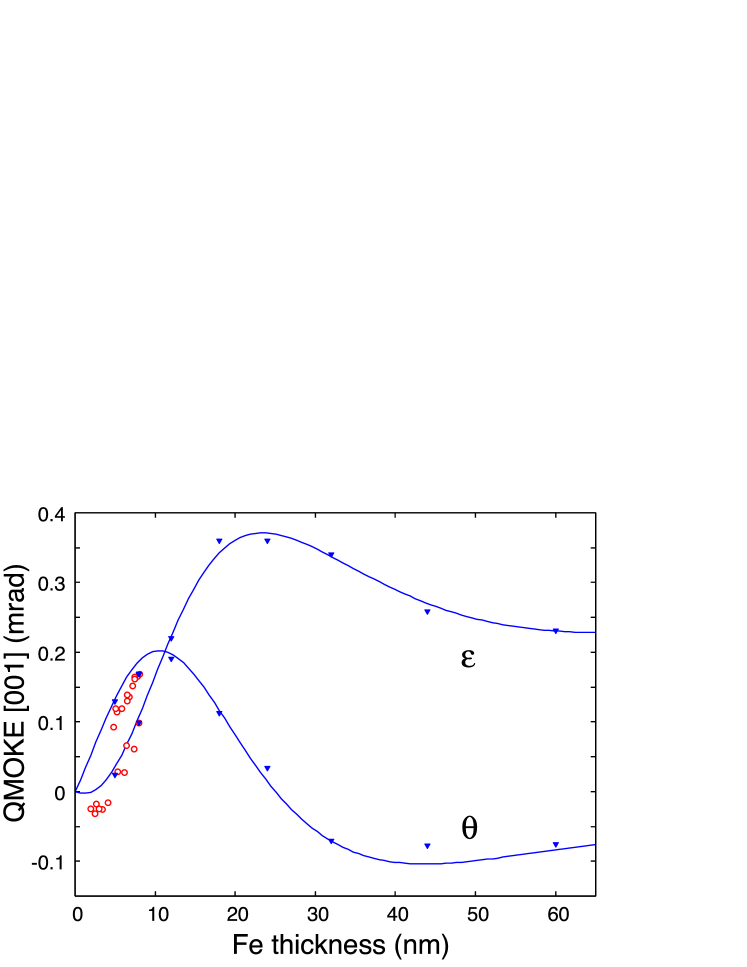
The thickness dependence of the QMOKE coefficients for the hard axis (Fe[011] direction) and the easy axis (Fe[001] direction) configurations are plotted in Figs. 4 and 5, respectively. In contrast to LMOKE, in this case the real part (Kerr rotation ) is the quantity, which depends linearly on thickness for ultrathin Fe layers, while the slope of the imaginary part (Kerr ellipticity ) changes sign at approximately 7 and 2 nm for the [011] and [001] configuration, respectively. Thus, taking into account the significant QMOKE contribution the additivity holds for neither phase of the Kerr angle.
The extracted relevant second order MO coupling constants, and , for the hard and easy axis configurations are listed in Table 1. They have been determined by fitting the data taking into account the and parameters from the fits to the LMOKE data (Fig. 3). The determination of the parameter depends on the both the values of and [see Eq. (3)]. Therefore, the propagation of errors results in a significantly poorer quality of the experimental data. As a consequence we could not reliably determine the parameter for sample A.
| Parameter | Sample A (0 - 8 nm) | Sample B (5 - 60 nm) | Literature CRC_HANDBOOK ; Yolken |
|---|---|---|---|
We find maximum absolute values of the QMOKE at about 22 nm of 0.23 mrad and 0.37 mrad for the hard and easy axis configurations, respectively. These values should be compared to the record QMOKE value of about 1.05 mrad note recently found in Co2FeSi alloys in Ref. JPD_40_1558, . This comparable order of magnitude of the QMOKE of Fe and Co2FeSi implies that the maximum QMOKE value of Fe in the visible wavelength region might be even larger than that of Co2FeSi as both materials are expected to have a distinct frequency dependence resulting from their electronic band structures.
In Fig. 2 of Ref. JAP_91_7293, Postava et al. give the dependence of LMOKE and QMOKE contributions on sample orientation for a 50 nm thick bcc-Fe(001) sample capped with 1.5 nm Pd and measured at an incident angle of 3.25∘. Based on our fitted optical and MO material constants we have calculated the , , and constants for the sample structure and experimental configuration of Ref. JAP_91_7293, and assuming . We find a value of mrad which is comparable, but about 20% smaller than the value of mradnote determined by Postava et al. On the other hand, our QMOKE data differ more distinctly, although they are of a similar order of magnitude. While we find , which is about 30% larger than the value determined by by Postava et al., our value for is about a factor of 2 smaller than determined by Postava et al. This difference of the QMOKE is clearly larger than the experimental errors caused by uncertainties in the layers thicknesses, the optical properties of the capping layers, and the calibration of the MOKE setup. Although both the sample of Postava et al. and our samples are epitaxial bcc-Fe(001), a possible explanation could be a strong structural dependence of the QMOKE as described in Ref. JPD_40_1563, for Co2FeSi.
V Conclusions
The thickness dependence of the linear and quadratic MOKE of wedge-type thin Fe(001) films magnetized in the sample plane has been measured. Good quantitative agreement of the experimental data with calculations assuming bulk-type optic and MO material constants indicates that the thickness dependence of the MOKE is mainly due to bulk-type magnetooptical coupling. On the other hand, we found a sizable departure from theory for thicknesses below about 10 nm. This can be explained by thickness dependent optic and MO material parameters, which are possibly due to MO surface effects or thickness dependent features of the bandstructure, e.g. quantum-well states. By fitting the experimental data to results of a numerical model, we extracted a complete set of material constants , , , and for the quantitative description of the MOKE of bcc-Fe(001) at the laser frequency employed. To our knowledge this is the first report of the second order MO-coupling constants of Fe. They are comparable to the first-order constants and thus, of general significance for the theoretical description of the MOKE. The index of refraction is in excellent agreement and the linear MO-coupling constants agree reasonably with previous works. In contrast, a comparison of the second-order constants with earlier QMOKE data from Postava et al. demonstrates a remarkable difference. This suggests that the anisotropic second-order MO-coupling might strongly depend on the sample properties.
Acknowledgements
The authors would like to thank K. Postava for helpful discussions.
References
-
(1)
Present address: Institut für Angewandte Physik,
Corrensstr. 2-4, Westfälische Wilhelms-Universität Münster,
D-48149 Münster, Germany
Electronic mail: m.buchmeier@uni-muenster.de - (2) S. Yan, R. Schreiber, P. Grünberg, and R. Schäfer, J. Magn. Magn. Mater. 210, 309 (2000).
- (3) D. Berling, S. Zabrocki, R. Stephan, G. Garreau, J. L. Bubendorff, A. Mehdaoui, D. Bolmont, P. Wetzel, C. Pirri, and G. Gewinner, J. Magn. Magn. Mater. 297, 118 (2006).
- (4) R. R. Gareev, D. E. Bürgler, M. Buchmeier, R. Schreiber, and P. Grünberg, J. Magn. Magn. Mater. 240, 235 (2002).
- (5) M. Buchmeier, PhD Thesis, Universität zu Köln (2003), http://kups.ub.uni-koeln.de/volltexte/2003/677/
- (6) Z. Q. Qiu, J. Pearson, and S. D. Bader, Phys. Rev. B 45, 7211 (1992).
- (7) M. Nyvlt, M. Przybylski, J. Grabowski, and J. Kirschner, J. Appl. Phys. 98, 033516 (2005).
- (8) P. M. Oppeneer, in “Handbook of Magnetic Materials“, Vol. 13, p. 229, edited by K. H. J. Buschow, (Elsevier Science B. V., North Holland 2001).
- (9) Y. Suzuki, T. Katayama, P. Bruno, S. Yuasa, and E. Tamura, Phys. Rev. Lett. 80, 5200 (1998).
- (10) J. Grondilova, M. Rickart, J. Mistrik, K. Postava, S. Visnovsky, R. Lopusnik, S. O. Demokritov, and B. Hillebrands, J. Appl. Phys. 91, 8246 (2002).
- (11) J. Hamrle, M. Nyvlt, S. Visnovsky, R. Urban, P. Beauvillain, R. Megy, J. Ferre, L. Polerecky, and D. Renard, Phys. Rev. B 64, 155405 (2001).
- (12) K. Postava, H. Jaffres, A. Schuhl, F. Nguyen Van Dau, M. Goiran, and A. R. Fert, J. Magn. Magn. Mater. 172, 199 (1997).
- (13) R. M. Osgood, B. M. Clemens, and R. L. White, Phys. Rev. B 55, 8990 (1997).
- (14) K. Postava, D. Hrabovsky, J. Pistora, A. R. Fert, S. Visnovsky, and T. Yamaguchi, J. Appl. Phys. 91, 7293 (2002).
- (15) J. Hamrle, S. Blomeier, O. Gaier, B. Hillebrands, H. Schneider, G. Jakob, K. Postava, and C. Felser, J. Phys. D 40, 1563 (2007).
- (16) L. Giovannini, R. Zivieri, G. Gubbiotti, G. Carlotti, L. Pareti, and G. Turilli, Phys. Rev. B 63, 104405 (2001).
- (17) E. D. Mishina, A. I. Morosov, A. V. Mishina, V. Moshnyaga, L. Sudheendra, K. Samwer, and Th. Rasing, Phys. Rev. B 75, 064401 (2007).
- (18) H. C. Mertins, S. Valencia, A. Gaupp, W. Gudat, P. M. Oppeneer, and C. M. Schneider, Appl. Phys. A 80, 1011 (2005).
- (19) R. J. Hicken, S. J. Gray, A. Ercole, C. Daboo, D. J. Freeland, E. Gu, E. Ahmad, and J. A. C. Bland, Phys. Rev. B 55, 5898 (1997).
- (20) D. E. Bürgler, C. M. Schmidt, J. A. Wolf, T. M. Schaub, and H.-J. Güntherodt. Surf. Sci. 366, 295 (1996).
- (21) D. E. Bürgler, C. M. Schmidt, D. M. Schaller, F. Meisinger, R. Hofer, and H.-J. Güntherodt. Phys. Rev. B 56, 4149 (1997).
- (22) M. Buchmeier, Diploma Thesis, Universität zu Köln (1999), http://hdl.handle.net/2128/2892
- (23) Handbook of Chemistry and Physics, 82nd edited by D. R. Lide, (CRC Press 2002).
- (24) P. Yeh, Surf. Sci. 96, 41 (1980).
- (25) S. Visnovsky, Czech. J. Phys. 41, 663 (1991).
- (26) J. Zak, E. R. Moog, C. Liu, and S. D. Bader, Phys. Rev. B 43, 6423 (1991).
- (27) http://hdl.handle.net/2128/2605
- (28) M. Buchmeier, H. Dassow, D. E. Bürgler, and C. M. Schneider, Phys. Rev. B 75, 184436 (2007).
- (29) R. Schäfer and A. Hubert, phys. stat. sol. (a) 118, 271 (1990).
- (30) R. Mattheis and G. Quednau, J. Magn. Magn. Mater. 205, 143 (1999).
- (31) H. T. Yolken and J. Kruger, J. Opt. Soc. Am. 55, 842 (1965).
- (32) G. S. Krinchik and V. A. Artemev, Sov. Phys. JETP 26, 1080 (1968).
- (33) Refs. JAP_91_7293, and JPD_40_1563, give the size of QMOKE originating from in saturation, which is a factor of 2 smaller than our definition of the parameter.
- (34) J. Hamrle, S. Blomeier, O. Gaier, B. Hillebrands, H. Schneider, G. Jakob, B. Reuscher, A. Brodyanski, M. Kopnarski, K. Postava, and C. Felser, J. Phys. D 40, 1558 (2007).