Discussion on the recent proton-DVCS results of Jefferson Lab.
Abstract
We present the recent data issued from the Halls A and B of Jefferson Laboratory for the Deep Virtual Compton Scattering Process on the proton. An important set of data for beam spin asymmetries, unpolarized cross sections and differences of polarized cross sections have been obtained. We modestly attempt a first “global” analysis of these three observables at a single , and kinematic point. We find that it is extremely challenging to describe simultaneously these data in the framework of a few Generalized Parton Distributions models.
1 Introduction
Generalized Parton Distributions (GPDs) have emerged this past decade as a powerful concept and tool to study nucleon structure. They describe, among other aspects, the (correlated) spatial and momentum distributions of the quarks in the nucleon (including the polarization aspects), its quark-antiquark content, a way to access the orbital momentum of the quarks, etc… We refer the reader to Refs [1, 2, 3] for example, for very detailed and quasi-exhaustive reviews on the GPD formalism and the definitions of some of the variables and notations that will be employed in the following.
Experimentally, GPDs are most simply accessed through the measurement of the exclusive leptoproduction of a photon (Deep Virtual Compton Scattering -DVCS-) and, possibly, of a meson (Deep Virtual Meson Production). In this short write-up, we want to concentrate on the recent proton DVCS data that have emerged from two pionneering experiments from the Halls A and B of Jefferson Laboratory and which provide to this day the most extensive and precise data set for the DVCS process that has ever been available. The results of these experiments have recently been published [4] or are under refereeing process [5]. The goal of these conference proceedings is humbly to attempt a first “global” understanding of both these data sets.
2 The JLab data
2.1 Hall A experiment E-00-110
Hall A experiment E-00-110 has measured for the first time ever the cross section of the DVCS process in the valence region ( 2 GeV), the region of interest to access quark GPDs. The reaction was identified by detecting the scattered electron with the high resolution arm spectrometer of the JLab Hall A and the final state photon in a PbF2 crystals calorimeter. The DVCS process was then identified by cutting on the missing mass of the proton. Contamination by or events could be estimated and subtracted, in particular by using a sample of fully exclusive events where the missing proton was actually detected in a dedicated array of scintillators.
The 4-fold (polarized and unpolarized) differential cross sections (i.e. without any integration over an independent variable) have been extracted for 3 bins in and are shown on Fig. 1 for =2.3 GeV2, the highest reached in the experiment.
The particular shape in of the unpolarized cross section (lower panel of Fig. 1) is typical of the Bethe-Heitler (BH) process where the final state photon is radiated by the beam or the scattered electron. It is a process which leads to the same final state than the DVCS process and which therefore interferes with it. The dot-dot-dashed green curve on the lower part of Fig. 1 shows its precise shape and contribution. It can be seen that it dominates most of the cross sections and only around = 180o, there is a large discrepancy (a factor 2) between the BH and the data which could a priori be attributed to the DVCS process itself and therefore could contain sensitivity to GPDs. As it is an unpolarized cross section, this sensitivity is through the square of the DVCS amplitude and both its imaginary and real parts are expected to contribute.
The difference of polarized cross sections allows a different sensitivity to GPDs : on the one hand, like in general most of polarization observables, it is sensitive to the imaginary part of the process, therefore to the sole imaginary part of the DVCS process since the BH amplitude is real ; and on the other hand, since it arises from an interference, it is sensitive in a linear fashion to the DVCS amplitude.
2.2 Hall B experiment E-00-113
Experiment E-00-113 used the JLab Hall B CLAS spectrometer to measure this same process . Here, the three final state particles were detected, using, in particular, for the final state photon, a new dedicated PbWO4 crystals calorimeter equipped with Avalanche Photo-Diodes. This did not fully prevent a residual contamination by events but this latter background could be estimated ( in average) and subtracted by Monte-Carlo techniques. Due to the large acceptance of the CLAS spectrometer, the largest-ever phase space for DVCS in the valence region has been explored by this experiment. Fig. 2 shows the beam spin asymmetries (BSAs) which have extracted and which have been recently submitted to publication [5].
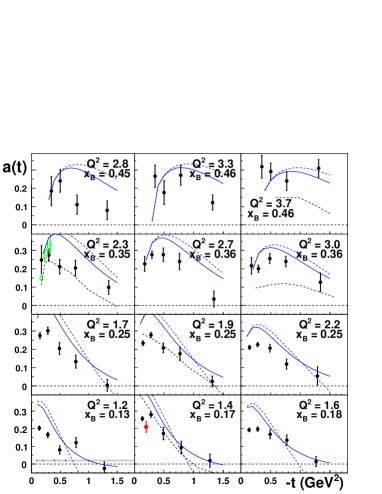
On this figure, the blue solid curves are the result of a DVCS GPD calculation using twist-2 Double Distributions for the GPD ( and being neglected), based on the so-called VGG model [7, 8]. The blue dashed curves are the result of the corresponding twist-3 Double Distributions calculation. As it will be discussed more precisely in the next section, these calculations tend in general to overestimate the data at low . The dashed black curve is the result of a Regge calculation [9] for the DVCS process, i.e. not based on GPDs, which, although interesting in itself as providing a potential additionnal contribution to the DVCS process, we will not discuss here.
We note that the BSAs which have been extracted from the Halls A and B are relatively compatible and consistent, where the data overlap (= 0.35, =2.3 GeV2). The Hall B unpolarized cross sections and differences of polarized cross sections are still under analysis and should hopefully be expected before the end of this year. It will be crucial that similar agreement is reached for these normalized cross sections. Let us recall that these pioneering experiments are definitely challenging, measuring 4-fold differential cross-sections at the level of a few picobarns.
3 Data interpretation
In this section, let us concentrate our discussion on the single 0.36, = 2.3 GeV2, = 0.28 GeV2 bin, which is common to the Halls A and B experiments and for which we have 3 observables available to compare with : unpolarized cross sections, differences of polarized cross sections and beam spin asymmetries (i.e. the ratio of the two former ones).
In principle, two processes contribute to the reaction in the kinematic regime we discuss here : the BH and the DVCS which should be added at the amplitude level. The BH is very well known depending only on the nucleon form factors which are rather well controlled at the rather low value discussed here. Therefore the lever arm lies only in the DVCS process, both in its real and imaginary parts. Being at fixed , and and, furthermore, the dependence of the 3 observables being imposed on general grounds by the BH and leading-twist handbag DVCS amplitudes, the only freedom is therefore adding or subtracting a “constant” (i.e. independent of , , and ) to either the imaginary or the real part of the DVCS amplitude.
As already mentionned, from Fig. 2, it seems that the standard Double Distributions VGG calculation systematically overestimates the experimental BSAs. Two obvious remedies to this are then : diminishing the imaginary part of the DVCS amplitude or increasing the real part of the DVCS amplitude. Fig. 3 shows the (simultaneous) effect of increasing the real part of the DVCS amplitude on the BSA, the unpolarized cross section and the difference of polarized cross section.
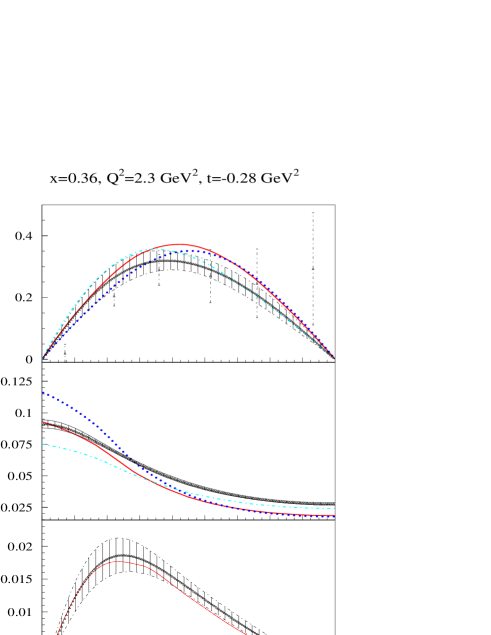
Let us first concentrate on the upper part of Fig. 3 which shows the BSA for the above mentionned = 0.36, = 2.3 GeV2, = 0.28 GeV2 bin as a function of . The red solid curve is basically the VGG twist-2 calculation of Fig. 2 which confirms here that (both the Halls A and B) experimental data are overestimated. The dotted (dark) blue line shows the effect of “boosting” the real part of the DVCS amplitude. A typical motivation for this would be the presence of a strong D-term [10] (in this calculation, we have taken, as a simple example, the Weiss-Polyakov D-term multiplied by (t) for its dependence and renormalized by a factor 2). We see that, as anticipated, this allows the BSA to decrease and be, at least at , in better agreement with the data. This figure shows by the way that the analysis of the BSA cannot simply be reduced to the value of the BSA at as the whole dependence shape, which is not a simple sin, can show some sensitivity and information to the DVCS amplitude.
Now, getting an agreement simply for the BSA is not so much a challenge as it is a ratio and several contributions can compensate or annihilate each other. What is the effect on the other observables ? The middle panel of Fig. 3 shows that neither the “standard” VGG twist-2 calculation (red curve) nor the “real part-modified” are able to describe the unpolarized cross section. If the “standard” VGG twist-2 calculation matches the data at , it misses by a factor 2 the data at = 180o. The “real part-modified” calculation even removes the agreement at = 0o.
On Fig. 3, the solid (light) blue curve shows the result of changing the sign of the additional real part term to the DVCS amplitude (i.e. taking an opposite sign to the one advocated in Ref. [10]). The BSA at also decreases and brings the theoretical calculation in relative agreement with the data. More precisely, the general dependence of the BSA seems to show a better agreement with the Hall A data and somewhat less with the Hall B data. Turning to the unpolarized cross section, it gives a nice agreement in the region = 180o but underestimates strongly the data at = 0o. In the framework of this short study, whatever the value and the sign of this real term, the conclusion should be clear : it is impossible to reproduce the dependence and normalisation of the unpolarized cross section.
We finally note that the difference of polarized cross sections (lower panel of Fig. 3) is insensitive to the presence or not of a D-term (be it strong or not, positive or negative) : all three calculations just discussed give the same result (thin solid red line) as it is an observable sensitive only to the imaginary part of the DVCS amplitude. The agreement for this latter observable is very good and this tends to give support to the option of decreasing the real part of the DVCS amplitude in order to get an agreement for the BSA, if it were not for the strong disagreement for the unpolarized cross section that we just observed.
The other option that can be envisaged to reconcile the theory and the data for the BSA is, as mentionned at the beginning of this section, to decrease the imaginary part of the DVCS amplitude. We do not discuss precisely this solution here but it has recently been pursued in details by M. Vanderhaeghen and M. Polyakov [11]. In the framework of the “dual” model, it can be shown that the imaginary part of the DVCS amplitude can be decreased in a natural way. These authors have shown that the agreement with the BSA is very satisfying (like it is by increasing the real part as we just saw), but that, again, no agreement with the dependence of the unpolarized cross section can be found (the disagreements are at the same level of what we show in the middle panel of Fig. 3) and, furthermore, the difference of polarized cross sections is now in severe disagreement.
4 Conclusion
For the first time in the field of GPDs, we are confronted with strong experimental constraints due to the large data sets that have recently poured and been released by the JLab Hall A and CLAS collaborations (with much more to come soon !). For the first time, theory might be faced with a strong challenge. This short study has shown that, at this date, with a few models that have been developped so far (Double Distributions, D-term, dual model), it is basically impossible to reproduce, even for a single , and bin, simultaneously the dependence of the three “most basic” observables which are the BSA, the unpolarized cross section and the difference of polarized cross section for DVCS on the proton. Given that the lever arm in any model is very limited (changing the real or the imaginary part of the DVCS amplitude at a fixed , and , the dependence being imposed by the general forms of the leading-twist handbag DVCS and BH amplitudes), it seems that this conclusion might be rather model independent. Further data (Hall B cross sections data in particular are eagerly waited) are clearly needed in order to resolve this issue. We finally stress that this short study has been carried in the approximation of neglecting the , and GPDs (justified in the framework of the VGG model). If the strength of these latter GPDs turned out to be much more important than the VGG predictions, some conclusions might possibly have to be reconsidered.
References
- [1] K. Goeke, M. V. Polyakov and M. Vanderhaeghen, Prog. Part. Nucl. Phys. 47, 401 (2001).
- [2] M. Diehl, Phys. Rept. 388, 41 (2003).
- [3] A.V. Belitsky, A.V. Radyushkin, Phys. Rept. 418, 1 (2005).
- [4] C. Muñoz Camacho et al., Phys. Rev. Lett. 97, 262002 (2006).
- [5] F.-X. Girod et al., arXiv:0711.4805 [hep-ex].
- [6] S. Stepanyan et al., Phys. Rev. Lett. 87, 182002 (2001).
- [7] M. Vanderhaeghen, P.A.M. Guichon, M. Guidal, Phys. Rev. D 60, 094017 (1999).
- [8] M. Guidal, M. V. Polyakov, A. V. Radyushkin and M. Vanderhaeghen, Phys. Rev. D 72, 054013 (2005).
- [9] J.-M. Laget, Phys. Rev. C 76, 052201 (2007).
- [10] M. Polyakov and C. Weiss, Phys. Rev. D 60, 114017 (1999).
- [11] M. Polyakov and M. Vanderhaeghen, arXiv:0803.1271 [hep-ph].