The inverse-Compton X-ray-emitting lobes of the high-redshift giant radio galaxy 6C 0905+39
Abstract
We present new XMM-Newton data of the high-redshift (), -sized giant radio galaxy 6C 0905+39. The larger collecting area and longer observation time for our new data means that we can better characterise the extended X-ray emission, in particular its spectrum, which arises from cosmic microwave background photons scattered into the X-ray band by the energetic electrons in the spent synchrotron plasma of the (largely) radio-quiet lobes of 6C 0905+39. We calculate the energy that its jet-ejected plasma has dumped into its surroundings in the last years and discuss the impact that similar, or even more extreme, examples of spent, radio-quiet lobes would have on their surroundings. Interestingly, there is an indication that the emission from the hotspots is softer than the rest of the extended emission and the core, implying it is due to synchrotron emission. We confirm our previous detection of the low-energy turnover in the eastern hotspot of 6C 0905+39.
1 Introduction
At redshift , 6C 0905+39 is one of the highest redshift giant radio galaxies known. It spans on the sky (Law-Green et al., 1995), which represents a projected size of in the cosmology assumed in this paper. Blundell et al. (2006) observed this powerful, classical double FR II (Fanaroff & Riley, 1974) radio galaxy with Chandra and detected extended X-ray emission along the axis of the radio source which we concluded was emitted by inverse-Compton scattering of the Cosmic Microwave Background (ICCMB, CMB) by the lobes (undetected in the radio) of the radio galaxy. The sheer physical size of the source means that the extended emission cannot be due to up-scattering of a nuclear photon component and the breadth of the X-ray lobes rules out jet emission via beamed ICCMB. It is common for the lobes of radio sources at low- and high-redshift to emit X-rays in this way (e.g. Croston et al. 2005, Overzier et al. 2005, Erlund et al. 2006). Higher redshift objects are easier to detect and/or less ambiguous than low-redshift objects because ICCMB is not redshift-dimmed compared with other emission processes (Schwartz, 2002). The energy stored in ICCMB-scattering electrons can potentially be considerable and is more representative of the actual amount of energy that a radio source pumps into its environment than synchrotron radio emission because it is much longer lived and probes the lower Lorentz-factor electrons thought to dominate typical particle energy distributions.
In this paper we present recent XMM-Newton observations of 6C 0905+39. Throughout this paper, all errors are quoted at unless otherwise stated and the assumed cosmology is , and . One arcsecond represents on the plane of the sky at the redshift () of 6C 0905+39 and the Galactic absorption along the line-of-sight is (Dickey & Lockman, 1990).
2 Data Reduction
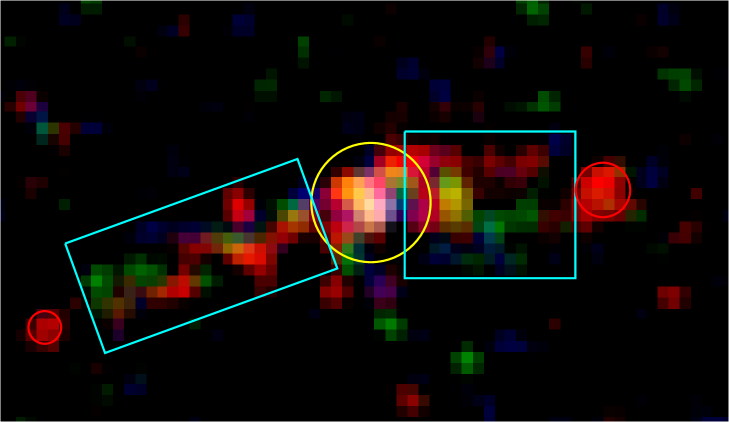
Our XMM-Newton data of 6C 0905+39 consists of of EPIC-pn data and of data for each of the EPIC-MOS cameras. 6C 0905+39 was observed on 2006 October 30. The standard pipeline was used to reduce the data, SAS tools EPCHAIN and EMCHAIN were used for the EPIC-pn and both EPIC-MOS data respectively. After filtering the resulting files to remove periods dominated by flares and taking dead-time intervals into account, of good-time for the PN, and for both MOS 1 and MOS 2 were left. In total, in the band (after summing the MOS 1, MOS 2 and the PN data and using the regions shown in Fig 3), there are 1271 counts (of which 579 are background) in the source, 830 (422 background) in the extended emission (lobes and hotspots) and 441 counts (159 background) in the core. Spectra for the extended X-ray emission (excluding the 15 core region), the nucleus ( circle) and background (an area of sky free from sources near 6C 0905+39 on the same chip) were extracted separately for each instrument. They were then stacked and fitted using XSPEC v 11.3.2. All spectral data were fitted over the band. The nucleus of 6C 0905+39 is addressed in Erlund et al. (2008) and so is not discussed further here.
The radio data used in this paper first appeared in Blundell et al. (2006) and were reduced using standard AIPS techniques.
3 Results
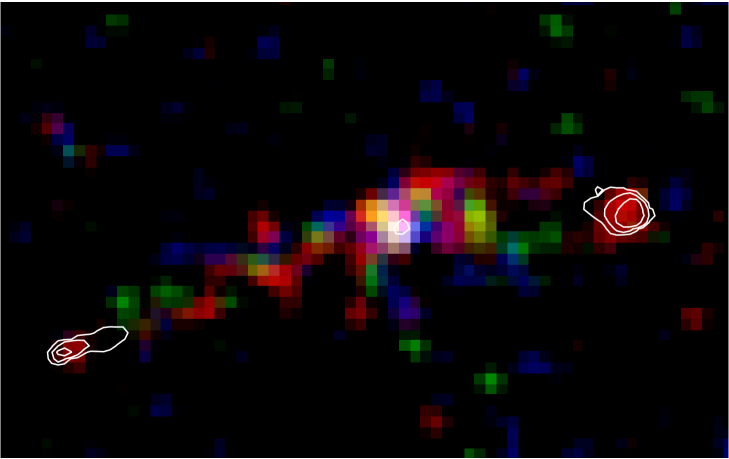
Our XMM-Newton data clearly show X-ray emission extending along the radio axis of 6C 0905+39 to the east and west (Fig. 1). This was first detected by Chandra and presented in Blundell et al. (2006) where we noted that, as Chandra resolves the transverse extent of this extended emission (, although the paucity of counts makes the difficult to measure this accurately), it cannot be jet emission (since this would be very narrow) but rather is due to inverse-Compton up-scattering of the CMB by spent radio plasma from the lobes. The XMM-Newton data supports this interpretation. The spectra extracted from the EPIC-pn, MOS 1 and MOS 2 data were binned by 20 counts per bin and associated with a background spectrum, response and ancillary response files using GRPPHA. They were then fitted with a Galactic-absorbed power-law using XSPEC (which subtracts the background) giving a photon index of and a normalisation of with a reduced-chi-squared of with degrees of freedom (d.o.f.). The absorption-corrected X-ray luminosity of the extended emission in the band is , and the observed flux in the same band is . Blundell et al. (2006) found from the Chandra data, but the XMM-Newton spectra are better constrained and typical of extended inverse-Compton emission associated with radio galaxies (e.g. Croston et al. 2005; Erlund et al. 2006). (Note that the values presented for the extended emission in Erlund et al. 2008 came from a larger extraction region.)
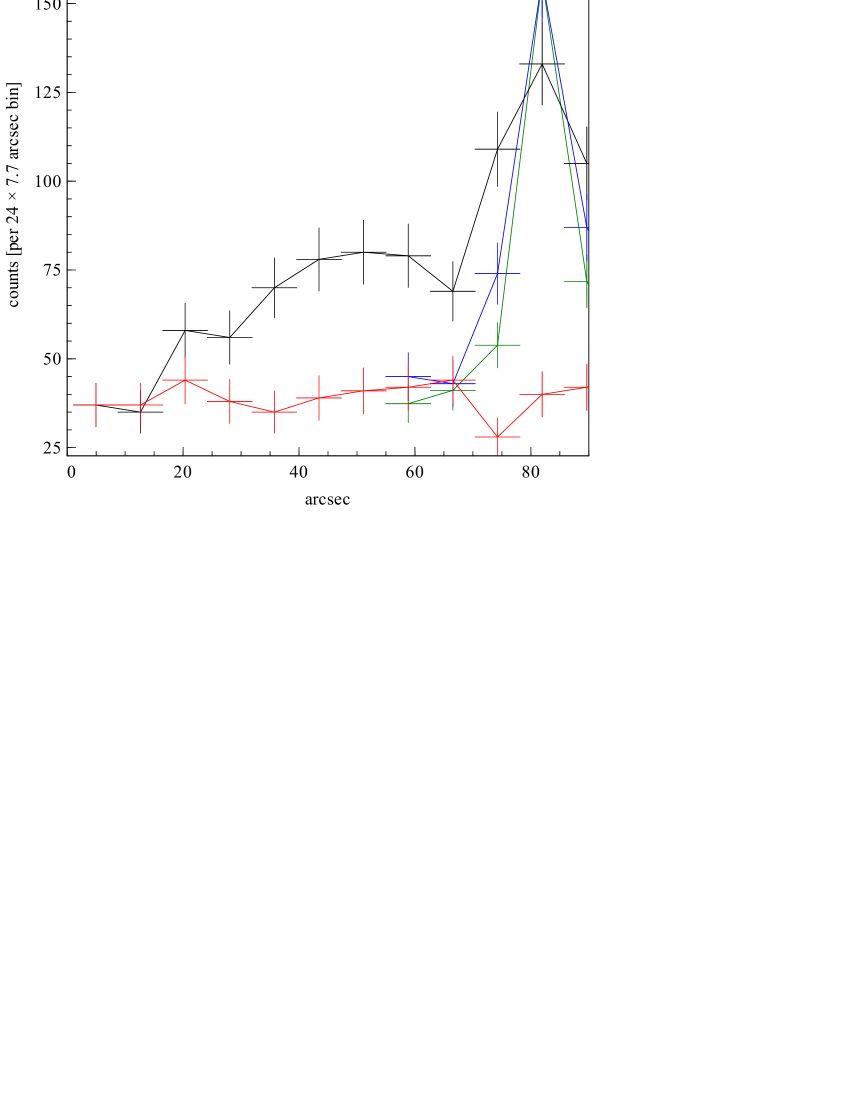
The number of X-ray photons increases towards the core (by per cent) as can be seen in Fig. 1 and Fig. 2. The latter figure shows four profiles: the eastern lobes in black; a source-free region in red to give an idea of the background level on the chip; the core in blue (i.e. roughly perpendicular to the radio axis); and a bright (comparison) source to the north-east of 6C 0905+39 which has been normalised so as the sides of the core profile are roughly matched in green. This green line illustrates that the point spread function (PSF) of the central core does not significantly contaminate the extended emission. Each profile is calculated using a rectangular region 24 wide from a stacked PN, MOS1 and MOS2 image with pixels. The PSF is arcsec at the FWHM which corresponds to one point.
Blundell et al. (2006) noted that most of the X-ray emission in the Chandra observation lay between the radio hotspots and core, along the lobes of 6C 0905+39. The more extended western hotspot emitted in X-rays but the eastern one did not at the upper limit of our Chandra observation. In Blundell et al. (2006), we interpreted the lack of X-ray emission from the eastern hotspot together with the presence of X-ray emission in the lobe material nearby as a direct detection of the low-energy turnover in the electron population (). Our deep XMM-Newton data show a very similar picture, with rather different X-ray emission associated with the eastern hotspot from that of the rest of the associated lobe. Interestingly, our new XMM-Newton observation reveals some very soft photons (approximately two thirds of these photons have energies below ) associated with the eastern hotspot, which would expect to be undetectable in our current Chandra observation. We consider the nature of this very soft emission in Section 4.0.2.
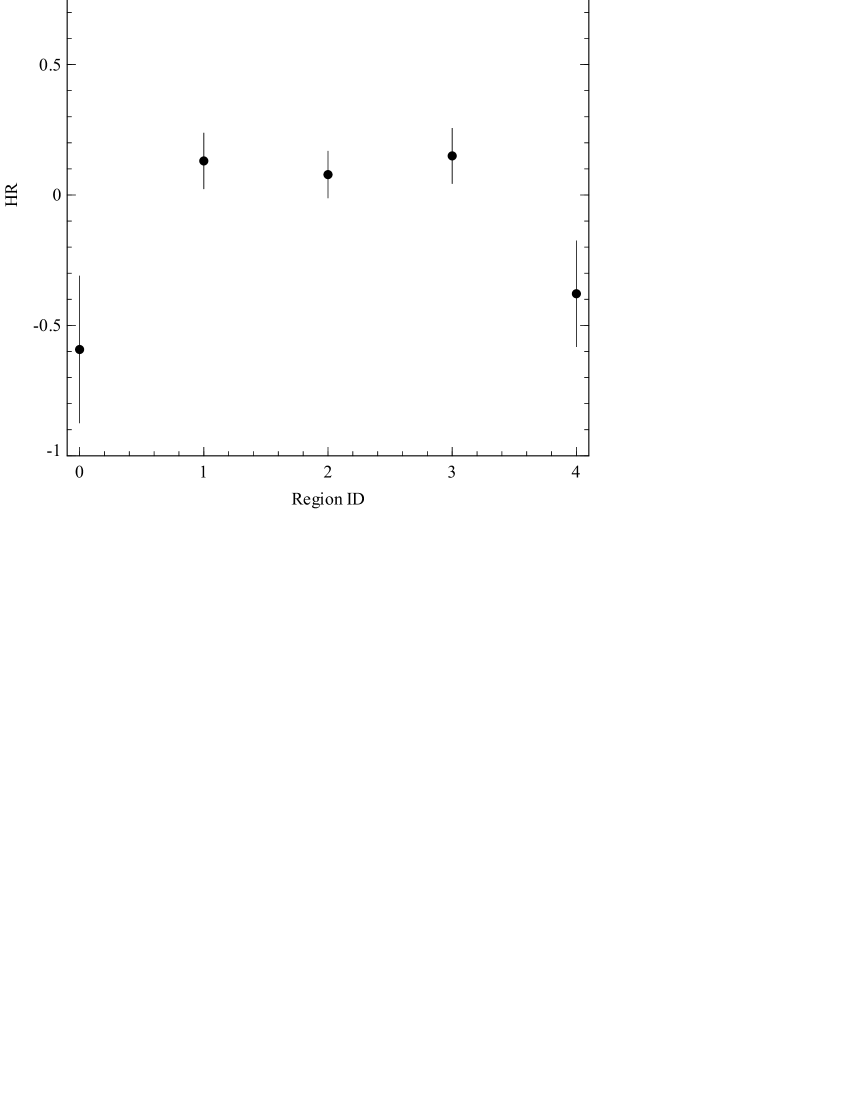
In order to determine whether there is any significant difference between the hardness ratio111Here we calculate the hardness ratio, , where is the number of counts in the hard band and is the number of counts in the soft band of the X-ray emission from the hotspots, lobes and core, the number of counts in the regions shown in Fig. 3 were calculated for the PN and both MOS cameras in the soft and hard band ( and ) respectively using CIAO tool dmstat. The counts in each region were calculated separately and by careful specification of the region files within ds9 contamination of the core region in the lobe region was avoided. These energy bands were chosen so that the number of counts in each band would be roughly equal. The hardness ratio in each region was calculated taking into account the background counts in each band. The resulting hardness ratio profiles as illustrated in Fig. 4, which shows that both hotspots are softer than the lobes and nucleus. A constant hardness ratio model is a poor fit to the data giving a best fit hardness ratio of and a . Fig. 2 shows that the difference between the hardness ratio of the lobes and hotspots is unlikely to be due to contamination from the core.
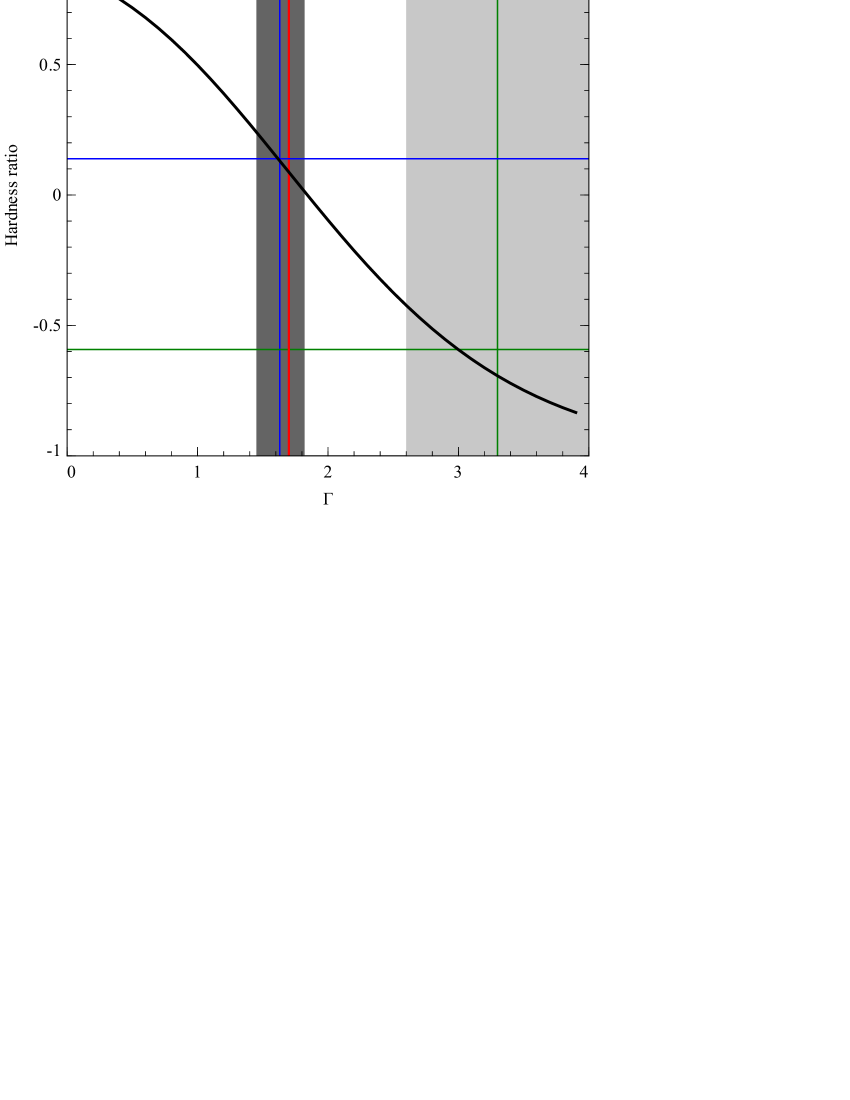
The relationship between the X-ray photon index and hardness ratio is plotted in Fig. 5. XSPEC was used to evaluate this, taking into account the Galactic absorption along the line-of-sight to 6C 0905+39. Fig. 5 shows that lower hardness ratios imply steeper spectra. Thus at X-ray energies, the lobes have a flatter spectrum than the hotspots.
4 discussion
The diffuse X-ray emission spanning the gap between the core and the radio-emitting hotspots in 6C 0905+39 is a clear case of inverse-Compton scattering of CMB photons by the relativistic electrons stored in the spent synchrotron plasma once accelerated in the hotspot (as per the standard model of FR II radio galaxy evolution see e.g. Blundell et al. 1999). Beamed ICCMB emission from a relativistic jet can be ruled out from the morphology of the X-ray emission in the Chandra data which, at , is too laterally extended to correspond to a jet (Blundell et al., 2006).
4.0.1 The X-ray emission mechanism in the hotspots
The difference in the X-ray hardness ratio (and correspondingly the spectral index / photon index) between the hotspots and the lobes emission implies that different X-ray emission processes are taking place. Law-Green et al. (1995) studied the spectral indexes of the radio emission associated with the hotspots and the small amount of lobe emission detected. The radio spectral indexes222The spectral index, , is related to the photon index, as , is defined as . of the eastern and western hotspots are and respectively, whereas the small radio lobes associated with these hotspots have spectral indexes of and respectively (these values come from Law-Green et al. 1995 who do not provide errors). In other words in the radio the spectral index may steepen from the hotspot to the lobe as would be expected from a curved particle distribution in a region with a magnetic field gradient (for reasons why this model is most likely see Blundell & Rawlings 2000). If it were the case that the X-rays from both the hotspot and lobes were from ICCMB emission, then the same curved spectrum and magnetic field should also cause the X-ray ICCMB emission to steepen between the hotspot and lobes (because the energy distribution will shift on expansion from the hotspot to the lobes). In fact the X-ray emission is steeper (i.e. softer) in the hotspot than in the lobes, this and the steepness of the spectrum implies that we are seeing the high energy tail of synchrotron emission in the hotspot.
Synchrotron self-Compton (SSC) emission has the same spectral shape as the synchrotron spectrum that has been up-scattered. The spectral indices of the radio hotspots are flatter than the X-ray spectral indices which would argue against this emission mechanism in the hotspot. However, to calculate the expected SSC flux in the eastern hotspot, we have assumed a minimum energy magnetic field with no low-energy cut-off (, for ), that the 408 emission (, peak and lobe flux; Law-Green et al. 1995) provides the SSC seed photon field and that the region responsible for up-scattering photons into the X-ray band is cylindrical with a diameter of 28 and a length of 56. The predicted SSC 1 X-ray flux density is then . This is several orders of magnitude lower than what we actually detect, which is (calculated from a power-law fitted to the eastern and western hotspot where the normalisation between the two regions was independently fitted). However, Blundell et al. (2006) inferred a low-energy turnover of in the population of this hotspot, in which case and the predicted 1 flux is . However, this would mean that the electrons emitting radio synchrotron lie below the low-energy turnover and so this emission mechanism can be ruled out (for confirmation of the detection of the low energy turnover in this object see Section 4.0.2).
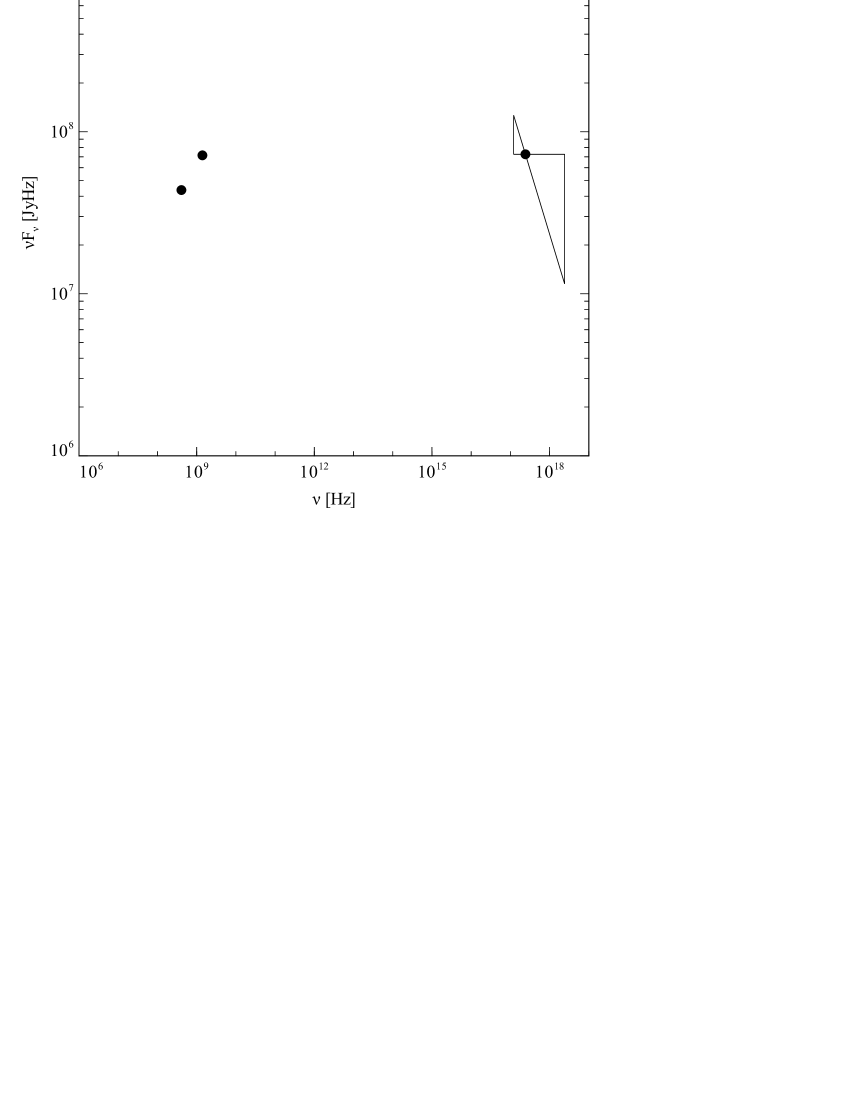
Thus we conclude X-ray synchrotron emission from the hotspots, where the magnetic field strength is likely to be enhanced compared with that of the lobes and where particles are being accelerated, is the most likely explanation for the change in spectral index between the hotspot and the lobe emission. The 1 X-ray flux density is consistent with a cooling or curved synchrotron spectrum (see Fig. 6). Extrapolating the radio flux density at 408 (107) up to 1 (assuming a straight power-law particle distribution) using the radio spectral index for the eastern hotspot (, calculated from the integrated flux density values for the eastern hotspot–lobe component given in Law-Green et al. 1995) gives a predicted monochromatic X-ray flux density of ; we detect , consistent with a steepening particle distribution curved in the usual way.
4.0.2 The electron population in the hotspots
Noting the eastern hotspot of 6C 0905+39 to be inefficient at up-scattering CMB photons into the X-ray band, yet the nearby lobe to be efficient, Blundell et al. (2006) deduced that this was direct evidence of a low-energy turnover in the electron population. The morphology of our new XMM-Newton data is similar to that of our Chandra data.
Assuming a power-law electron distribution which extends back to low Lorentz factors (), we make use of Equation 1 in Celotti & Fabian (2004) to determine the ratio of the predicted monochromatic X-ray luminosity, , to monochromatic radio luminosity, as follows
| (1) |
for the eastern hotspot, where is the energy density of the CMB at redshift and is the energy density of the magnetic field. , and are the observed frequencies in the radio and X-ray and the frequency of the peak of the CMB (again, at ) and is the gyro-frequency. is the spectral index of the radio emission. Re-writing Equation 1 to express it as a function of magnetic field strength, , gives
| (2) |
where is the charge on the electron, is the mass of the electron and is the speed of light.
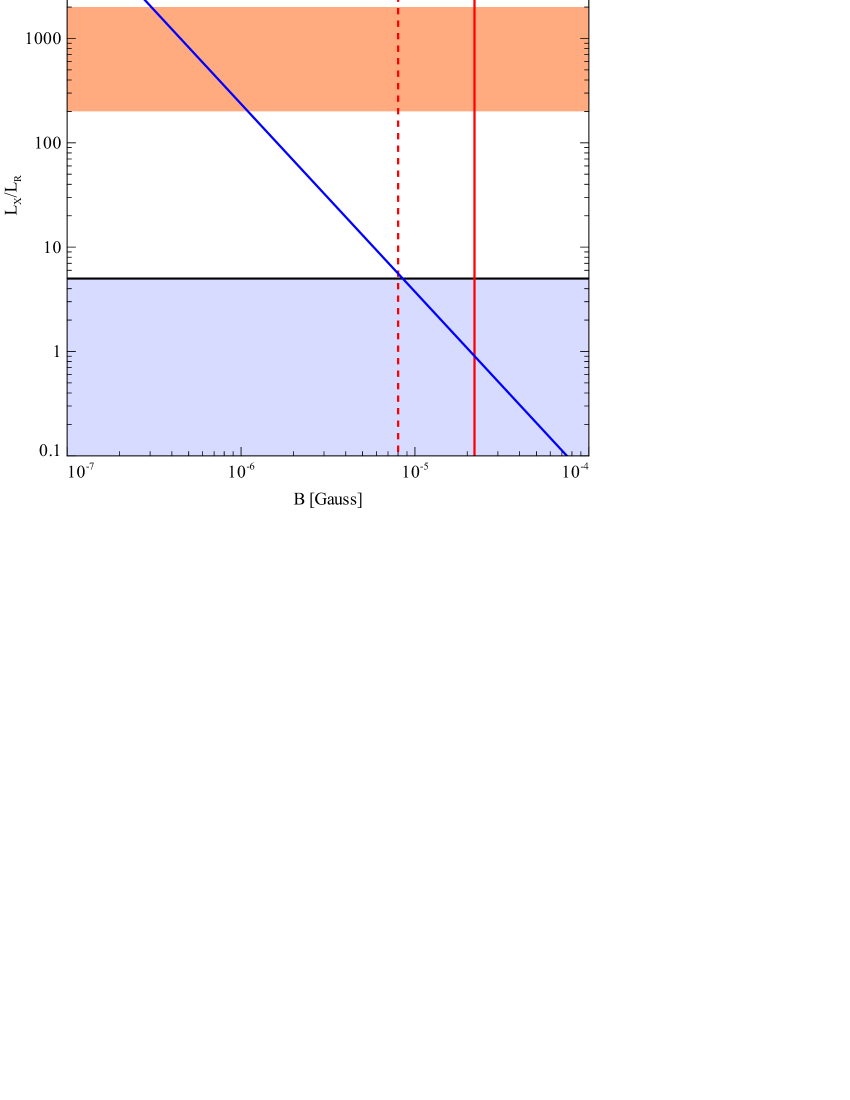
Fig. 7 shows the dependence of the X-ray–radio luminosity ratio on magnetic field strength at the redshift of 6C 0905+39: as the magnetic field decreases, increases. In order to detect ICCMB emission from the eastern hotspot, the magnetic field must be well below the minimum-energy magnetic field, , assuming no low-energy turnover. We note, however, that depends on , with a higher resulting in a lower (as described in Blundell et al. 2006 and illustrated in Fig. 7). It is therefore not possible to determine whether there is a low-energy turnover in the eastern hotspot using just our XMM-Newton and radio hotspot data so we now consider the other relevant information from these observations.
In Blundell et al. (2006) we considered the implications of the X-ray bright lobes and X-ray faint hotspots in 6C 0905+39. We concluded that the X-ray emission from the lobes implied that there must be a low-energy turnover in the eastern hotspot. The same argument still holds. Assuming a constant hotspot advancement speed (and that any expansion due to cooling takes place laterally), we can consider a region of lobe emission of the same length as the current eastern radio hotspot. The electrons responsible for inverse-Compton scattering CMB photons in the lobe have a Lorentz factor of . These electrons will have cooled by at least an order of magnitude (Blundell et al., 1999) since they left the hotspot. So calculating the number of electrons in a hotspot-sized region of the lobe tells us roughly the number of electrons there must have been in the hotspot. We can therefore calculate the number of electrons that there would be in the hotspot if there were no low-energy turnover, for an assumed spectral index. Then we calculate how much ICCMB emission these electrons would have produced. The ratio between this and the radio emission at 408 is shown as an orange region in Fig. 7 (the range of reflects the uncertainty in the size of the hotspot region. We consider the lobe-length–to–hotspot-length ratio to be between 10 and 100.) Fig. 7 clearly shows that there must be a high low-energy turnover in the hotspot of 6C 0905+39 with a as the expected X-ray luminosity is two orders of magnitude above our detection limit.
Fig 7 implies that if we are seeing the low-energy turnover then the magnetic field in this hotspot must be relatively weak. This could explain why we see X-ray synchrotron hotspot emission from this source when usually high-luminosity FR II radio galaxies do not have high frequency synchrotron emission associated with their hotspots. This is thought to be because the magnetic field is too strong (see, for example, Meisenheimer et al. 1989 and Blundell et al. 1999).
We assume that power is transferred from the central black hole to the hotspots of 6C0905 along jets with high efficiency and with little radiation, presumably because most of the transferred energy is kinetic in the form of bulk motion of particles. Although a high bulk Lorentz factor could make radio through X-ray radiation from particles in the jets undetectable by relativistic beaming, it would also greatly amplify the energy density of the CMB in the jet frame. This would lead to steep inverse-Compton losses of such energetic electrons, so electrons with these energies come from re-acceleration at the hotspots.
4.0.3 Increase in X-ray lobe photons towards the core
There is a per cent increase of X-ray emission towards the core (see Fig. 2; 30% of the total extended emission contaminates the core spectrum; see Erlund et al. 2008 for details). Given that the X-ray emission process is inverse-Compton, this implies that there are either more electrons with or that the energy density of the seed photon field has increased.
The central galaxy is bright in the infra-red (, at 5.8; Seymour et al. 2007333calculated using the flux density in the IRAC 5.8 band) so will provide a source of photons which could be up-scattered (off lower Lorentz factor electrons, ) along with the CMB (off electrons); however, this photon field will be dominated by the CMB beyond of the central galaxy444The energy density of the photons is calculated using , equating it to the energy density of the CMB which is and solving for , which is the distance from the nucleus in cm. The galaxy has been approximated as a point source. and so can be ruled out.
The amount of ICCMB emission in the X-ray depends only on the number density of the electrons with as the energy density of the CMB is constant throughout the source (and is independent of the magnetic field strength). One way in which there could be increasing numbers of electrons closer to the core is if we are seeing the low-energy turnover in the electron population as the back-flowing plasma approaches the core and cools. There could be a contribution from more lobe plasma closer to the nucleus.
4.0.4 Feedback
Emission that arises from inverse-Compton scattering of the CMB probes electrons with a lower energy than those typically responsible for producing radio synchrotron emission. In the case of 6C 0905+39, it means that the lobes of this high-redshift giant radio galaxy are detected in X-rays but not in the radio. Using the long-lived X-ray emission we can probe the amount of energy that 6C 0905+39 has pumped into its environment in the last , : approximately the length of time required to cool the electrons responsible for up-scattering the CMB into the X-ray band i.e those with Lorentz factors . We follow the arguments in Erlund et al. (2006) making use of their Equation 4:
| (3) |
where is the X-ray luminosity in the band and . The luminosity of the extended emission (both lobes and hotspots) emission is in the band, but there is a further contaminating the core spectrum (Erlund et al., 2008), meaning that the whole of the extended emission has a luminosity of . is the energy density of the photon field which is being up-scattered, in this case the CMB. is the Lorentz factor of the electrons responsible for most of the up-scattering: we assume that . is the Thomson cross-section. The lower limit to the amount of energy pumped into the environment by 6C 0905+39 is ; including protons can increase this by two to three orders of magnitude to or more.
Some clusters of galaxies require a large amount of energy deposited into the X-ray emitting gas to offset cooling and explain why significant amounts of cool gas are not detected in the X-ray in the centres of these systems. This feedback requires a power input of the order of (Dunn & Fabian, 2006) which gives a total energy of over . This simple comparison is to illustrate the huge amount of energy stored in the lobes of powerful radio galaxies: enough to stem a cooling flow. Other powerful FR II radio sources have similar lower limits to their reservoirs of energy stored in electrons (i.e. Erlund et al. 2006). Most radio galaxies in clusters are FR I radio sources which are likely to be less powerful.
4.0.5 Energy in ghost reservoirs
Saripalli et al. (2005) found four giant radio galaxies at in a statistically complete survey using the 2100 deg2 SUMSS field. None of these sources were classical double FR II radio galaxies. One is an FR I and the other three are also below the FR I–FR II luminosity divide but are possibly relic FR II sources because they have relaxed lobes and no hotspots (see also Cordey 1987 for another example of a large relic radio galaxy). This illustrates how rare sources such as 6C 0905+39 are at low redshifts. If three of Saripalli et al. (2005) relaxed doubles are in fact relic sources as they suggest, then powerful galaxies will be more common at higher redshift (closer to the peak in the space density of radio sources). 6C 0905+39 may be such an example as it has clear hotspots and, unlike its lower redshift counterparts, it has very little lobe emission at radio frequencies (Law-Green et al., 1995). The lack of radio lobe emission is due to a lack of particles having the right energies to radiate synchrotron emission at radio wavelengths, given the ambient magnetic field strength. (Radio observations at 408, Law-Green et al. 1995, and at 1.4, Blundell et al. 2006, appear not to have suffered from flux loss due to interferometric under-sampling, see Blundell et al. 2006.)
Sources such as the three relaxed doubles in the Saripalli et al. (2005) complete sample contain large reservoirs of aged synchrotron plasma which is ideally placed to up-scatter the CMB. These sources appear to be the most common sort of giant radio galaxy at low redshift based on the results in Saripalli et al. (2005) (they made up three out of four of the sources in their complete sample). Most giant radio galaxies could contribute to the anisotropies in the CMB and therefore are a potential contaminant in SZ (Sunyaev-Zel’dovich) surveys, particularly relic giant radio sources which are not strong radio emitters and so would be undetectable in the radio at relatively low redshifts. Given that most of the X-rays associated with 6C 0905+39 are associated with its extended emission, and are not co-spatial with the radio emission, this radio galaxy has pumped an otherwise completely undetectable into its environment.
5 conclusions
Our XMM-Newton observation of the giant, high-redshift () radio galaxy 6C 0905+39 clearly shows extended X-ray emission aligned along the radio axis of the source. The longer observation time and greater sensitivity of our XMM-Newton observations means that we can better characterise this emission. It is richer than the previous Chandra data, with an increase in X-ray emission towards the central source and a difference in the hardness ratio of the hotspots and lobe emission. We demonstrate that the soft X-ray emission in the hotspots of 6C 0905+39 is most likely to be X-ray synchrotron emission. We confirm our previous detection of the low-energy turnover in the eastern hotspot and suggest that the increase in X-ray emission towards the core is due to the low-energy turnover in the electron population being revealed as the electron population cools.
We find that the minimum energy that 6C 0905+39 has pumped into its environment in the last is (protons could increase this by a factor of ) and that it is clear that in 6C 0905+39, older plasma is more efficient at up-scattering the CMB than freshly accelerated plasma. This implies that there are more electrons with in the older plasma and thus that the younger plasma has a low-energy turnover above .
The complete sample of Saripalli et al. (2005) of low-redshift giant radio galaxies shows that actively fed giant FR II sources are rare (they found none), but that relic FR II sources may be the most common type of low-redshift giant radio galaxy (three out of four of their sources were potential relic sources). The Universe may be littered with the X-ray bright relics which could in their turn have an effect on the detected CMB anisotropies and hence SZ surveys. It is important to note that these would not be correlated with the observed distribution of currently radio-bright extended sources.
Acknowledgements
MCE acknowledges STFC for financial support. ACF and KMB thank the Royal Society.
References
- Blundell et al. (2006) Blundell K. M., Fabian A. C., Crawford C. S., Erlund M. C., Celotti A., 2006, ApJ, 644, L13
- Blundell & Rawlings (2000) Blundell K. M., Rawlings S., 2000, AJ, 119, 1111
- Blundell et al. (1999) Blundell K. M., Rawlings S., Willott C. J., 1999, AJ, 117, 677
- Celotti & Fabian (2004) Celotti A., Fabian A. C., 2004, MNRAS, 353, 523
- Cordey (1987) Cordey R. A., 1987, MNRAS, 227, 695
- Croston et al. (2005) Croston J. H., Hardcastle M. J., Harris D. E., Belsole E., Birkinshaw M., Worrall D. M., 2005, ApJ, 626, 733
- Dickey & Lockman (1990) Dickey J. M., Lockman F. J., 1990, ARA&A, 28, 215
- Dunn & Fabian (2006) Dunn R. J. H., Fabian A. C., 2006, MNRAS, 373, 959
- Erlund et al. (2008) Erlund M. C., Fabian A. C., Blundell K. M., 2008, MNRAS accepted, 0
- Erlund et al. (2006) Erlund M. C., Fabian A. C., Blundell K. M., Celotti A., Crawford C. S., 2006, MNRAS, 371, 29
- Fanaroff & Riley (1974) Fanaroff B. L., Riley J. M., 1974, MNRAS, 167, 31P
- Law-Green et al. (1995) Law-Green J. D. B., Eales S. A., Leahy J. P., Rawlings S., Lacy M., 1995, MNRAS, 277, 995
- Meisenheimer et al. (1989) Meisenheimer K., Roser H.-J., Hiltner P. R., Yates M. G., Longair M. S., Chini R., Perley R. A., 1989, A&A, 219, 63
- Overzier et al. (2005) Overzier R. A., Harris D. E., Carilli C. L., Pentericci L., Röttgering H. J. A., Miley G. K., 2005, A&A, 433, 87
- Saripalli et al. (2005) Saripalli L., Hunstead R. W., Subrahmanyan R., Boyce E., 2005, AJ, 130, 896
- Schwartz (2002) Schwartz D. A., 2002, ApJ, 569, L23
- Seymour et al. (2007) Seymour N. et al., 2007, ApJS, 171, 353