The Youngest Galactic Supernova Remnant: G1.9+0.3
Abstract
Our 50 ks Chandra observation of the small radio supernova remnant (SNR) G1.9+0.3 shows a complete shell structure with strong bilateral symmetry, about in diameter. The radio morphology is also shell-like, but only about in diameter, based on observations made in 1985. We attribute the size difference to expansion between 1985 and our Chandra observations of 2007. Expansion is confirmed in comparing radio images from 1985 and 2008. We deduce that G1.9+0.3 is of order 100 years old – the youngest supernova remnant in the Galaxy. Based on a very high absorbing column density of cm-2, we place G1.9+0.3 near the Galactic Center, at a distance of about 8.5 kpc, where the mean remnant radius would be about 2 pc, and the required expansion speed about km s-1. The X-ray spectrum is featureless and well-described by the exponentially cut off synchrotron model srcut. With the radio flux at 1 GHz fixed at 0.9 Jy, we find a spectral index of and a rolloff frequency of Hz. The implied characteristic rolloff electron energy of about TeV is the highest ever reported for a shell supernova remnant. It can easily be reached by standard diffusive shock acceleration, given the very high shock velocities; it can be well described by either age-limited or synchrotron-loss-limited acceleration. Not only is G1.9+0.3 the youngest known Galactic remnant, it is also only the fourth Galactic X-ray synchrotron-dominated shell supernova remnant.
Subject headings:
supernova remnants, X-rays : general — supernova remnants: individual (G1.9+0.3 (catalog )) — X-rays: ISM1. Introduction
Estimates for the supernova rate in the Milky Way Galaxy give about 3 per century (e.g., van den Bergh & Tamman, 1991), so that we expect 60 supernova remnants (SNRs) younger than 2000 yr, while fewer than 10 are confirmed. This well-known deficit motivated our program of Chandra observations of compact radio remnants, in search of evidence of youth. Here we report a confirmation of a young SNR, but one of remarkable properties: comparison of radio and X-ray images separated by 22 years demonstrates significant expansion, allowing the inference of an age of order 100 years. In addition, its X-ray emission appears to be purely synchrotron radiation, making G1.9+0.3 the fourth clear-cut X-ray-synchrotron-dominated Galactic SNR, after SN 1006 (Koyama et al., 1995), G347.3–0.5 (Koyama et al., 1997), and G266.2–1.2 (Slane et al., 2001).
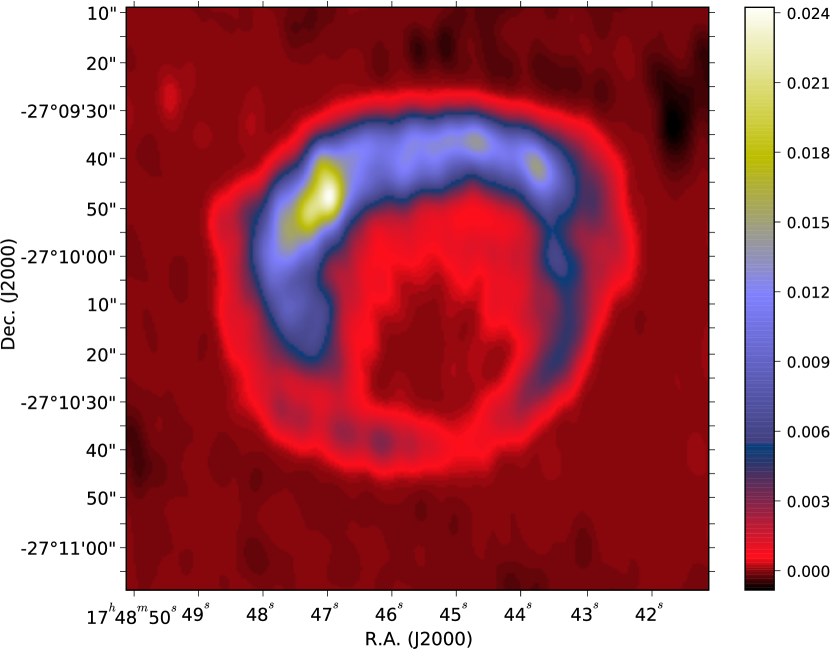
G1.9+0.3 was identified by Green & Gull (1984) as a potential young SNR, from a radio image showing a -diameter shell. This angular size made G1.9+0.3 the smallest Galactic SNR, with a mean radio surface brightness about half that of Tycho’s SNR and about 20 times that of SN 1006, suggesting an age of order yr. Green & Gull (1984) point out the general resemblance of G1.9+0.3 to Kepler’s SNR, and mention that it would be below 10 pc in diameter at any distance in the Galaxy. VLA111The Very Large Array is operated by the National Radio Astronomy Observatory, a facility of the National Science Foundation operated under cooperative agreement by Associated Universities, Inc. observations from 1985 (Green 2004, reproduced in Fig. 1) show a strong asymmetry in the shell at 21 cm, perhaps indicative of an external density gradient. Radio flux measurements with different instruments and frequencies are inconsistent; from VLA measurements, Nord et al. (2004) report a radio spectral index () between 74 and 327 MHz (consistent with flux estimates by Gray 1994) and giving a 1 GHz flux of 0.9 Jy. This steep a spectrum is typical of historical SNRs but rare otherwise. No counterparts are obvious in optical or infrared images. The remnant was detected with ASCA (Sakano et al., 2002), but contamination from nearby bright sources precluded detailed analysis.
2. X-ray Images and Spectra
We observed G1.9+0.3 with Chandra using the ACIS-S CCD camera (S3 chip) on 2007 February 10 for 24 ks, and March 3 for 26 ks. We checked aspect correction and created new level–1 event files appropriate for VFAINT mode. No flares occurred during the observation. CTI correction was applied and calibration was performed using CALDB version 3.4.0. Finally, the datasets were merged and weighted response files created. We extracted spectra using the specextract script, using a background region on the S3 chip. About 8,000 counts were obtained from the remnant.
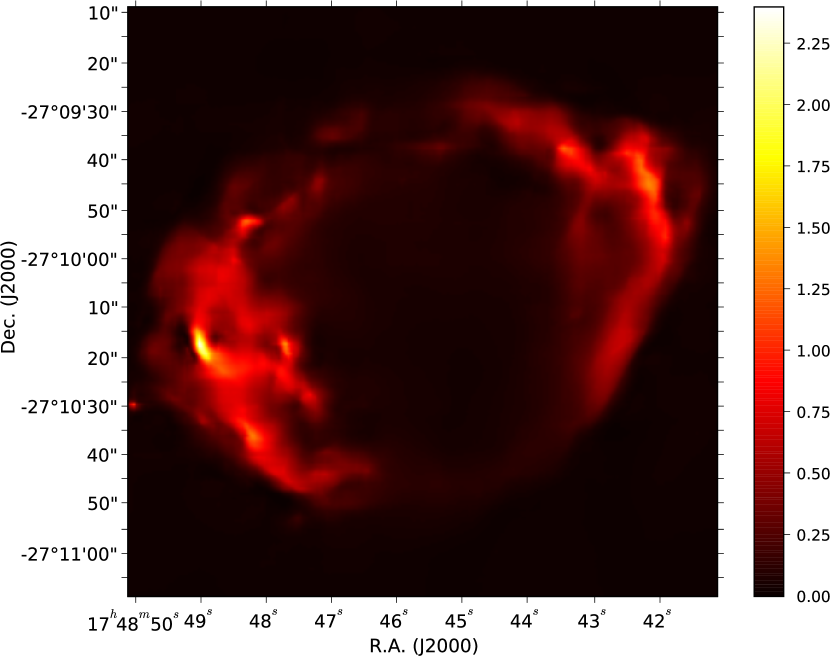
Figure 2 shows the image over the full energy range, platelet-smoothed (method described in Willett 2007). The bright ring is nearly circular, though fainter extensions (“ears”) protrude symmetrically on the E and W sides. The azimuthal brightness variations are quite different in radio and X-rays; the former has a single maximum to the north, while the latter shows remarkable bilateral symmetry reminiscent of SN 1006. However, the difference in radio and X-ray morphologies is quite unlike SN 1006. The angular extent is considerably larger than suggested by the radio image: about . The bright ring is slightly smaller E-W, about . No central source is apparent.
Instead of subtracting background (rendering the statistics non-Poisson), we modeled it with a combination of Gaussians and power-laws, exponentially cut off on both ends. The spectrum is shown in Figure 3, along with the background model. No lines at all are evident. Very high absorption is also apparent. We fit the data with the srcut model for synchrotron emission from a power-law distribution of electrons with a high-energy exponential cutoff (Reynolds & Keohane 1999). The model has four parameters: absorbing column density , 1-GHz radio flux, power-law spectral index , and rolloff frequency ; we fixed the radio flux to 0.9 Jy (though brightening may have occurred; Green et al. 2008). Parameter estimation was done with Markov Chain Monte Carlo simulations, as implemented in the XSPEC package (Arnaud, 1996). Constant Bayesian priors were assumed for the three undetermined parameters. We found cm-2, and Hz ( keV) – one of the highest values ever reported for a SNR. (Errors are 90% confidence intervals.) Now the high column means that dust scattering will be important, preferentially for lower-energy X-rays, hardening the spectrum. Including scattering will reduce the inferred column density and rolloff frequency somewhat. Detailed modeling will be required for quantitative assessment. In any case, evidently we have discovered the fourth example of a Galactic synchrotron-X-ray dominated SNR.
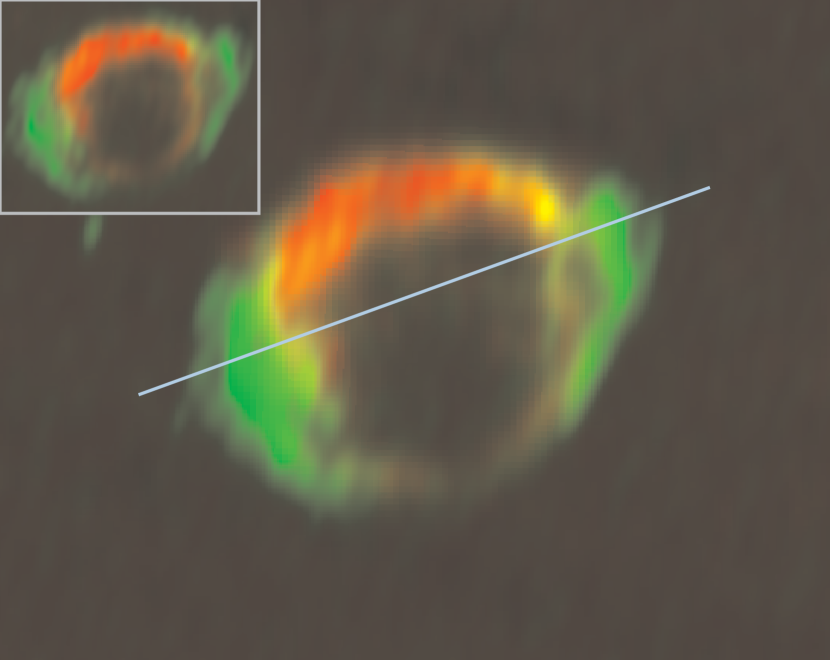
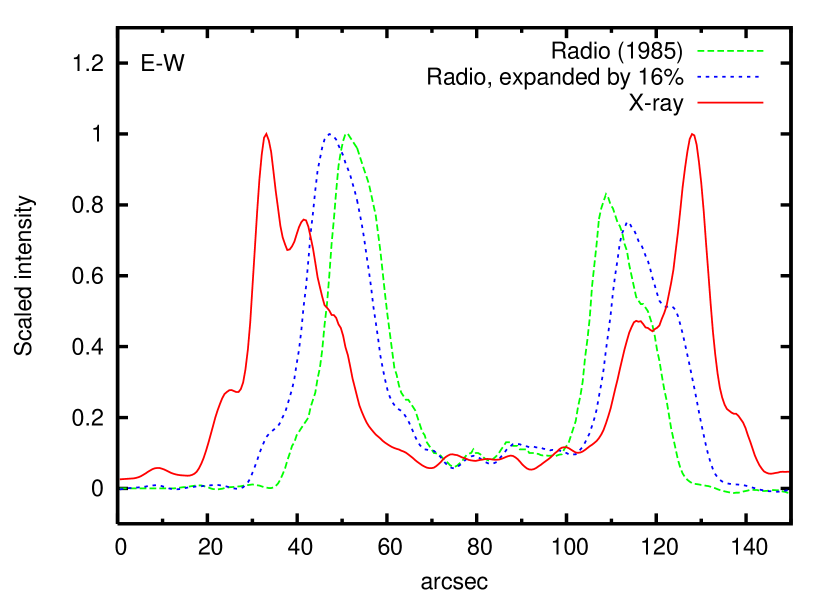
The striking size difference led us to compare the radio and X-ray images in more detail. The bright X-ray ring shows indentations and bright features that correlate well with the outer extent of the radio image – though at considerably larger radius, as can be seen in Figure 4. We smoothed the raw X-ray image to the resolution of the radio image, and examined an E-W profile (Figure 5) chosen to pass through prominent radio and X-ray features. Finite resolution should not affect the radio/X-ray size ratios. The distance between X-ray peaks, about , should be a lower limit to the X-ray diameter; if the X-rays abruptly turned on at the shock, those locations would appear as the outer inflection points, separated by about , a clear upper limit. The outer radio edge was estimated from inflection points in the radio profile, not from the peaks, as we expect an intrinsically much thinner X-ray than radio ring. The radio diameter judged in this way was . These values give fractional expansions of between 13% and 19% of the 1985 size. We adopt an estimate of % for the expansion in the 22 years since 1985, giving an age estimate of about yr, or less if deceleration has occurred as is likely. We shall argue below that G1.9+0.3 is near the center of the Galaxy; at 8.5 kpc, the shock speed is 14,000 km s-1. While such speeds are seen in optical spectra of supernovae, they are unprecedented in supernova remnants.
We recently obtained VLA Exploratory Time to examine G1.9+0.3 at the present epoch (Green et al. 2008). The VLA is currently in C configuration, so we observed at 6 cm to achieve comparable resolutions (. Averaged over all azimuths, the shell profile peaks at a radius of about in 1985 and in 2008. There are also some morphological differences in the images; however, a careful analysis of the averaged profiles gives an expansion of % (Green et al. 2008), consistent with our determination.

3. Discussion
The extremely high absorption toward G1.9+0.3 makes it unlikely that it is much closer than the Galactic Center (GC) region, at about 8.5 kpc. In fact, the Galactic extinction model of Marshall et al. (2006), based on near infrared 2MASS extinction colors, gives an infrared absorption of at the GC distance and . Assuming the same amount of heavy-element depletion onto dust grains as in the dust model of Weingartner & Draine (2001), about half of the absorption can be accounted for by material located in front of the GC. However, the very high expansion we infer argues against much larger distances than to the Galactic Center, suggesting that the additional absorption is local to the source. We assume a nominal distance of 8.5 kpc, at which pc. Then the mean radius of the bright X-ray ring is about 2 pc, with the E and W “ears” at about 2.2 pc. The very high expansion velocities would be mitigated at a substantially smaller distance, but the extreme absorption and absence of any IR counterpart (for instance, from a more local dense cloud of some kind) argue strongly against this.
Our inferred age of about 100 yr makes G1.9+0.3 the youngest known remnant in the Galaxy. The very high absorption would have rendered the supernova undetectably faint. The average optical absorption foreground to the GC exceeds , and the dust local to the GC region contributes a comparable amount, resulting in . Even a bright SN Ia with would be fainter than .
Three arguments slightly favor a Type Ia origin for G1.9+0.3. First, the bilateral symmetry of the X-ray synchrotron emission suggests interaction with a roughly uniform magnetic field, with electron acceleration dependent on the obliquity angle between shock normal and B (e.g., Fulbright & Reynolds 1990). A stellar-wind magnetic field, as expected for a core-collapse (CC) progenitor, should be a tightly wound Archimedean spiral, i.e., almost perpendicular to the shock normal at all azimuths, removing that possible explanation for the nonthermal morphology. However, Tycho, a prototype Ia remnant, does not show bilateral symmetry, nor does the radio emission in G1.9+0.3. Second, the very high expansion speeds are slightly more probable for a Ia supernova. Third, there is no indication of a pulsar-wind nebula at the center (but a compact object with a soft spectrum like that in Cas A could not be seen with this high absorption). The question is still open; the position of G1.9+0.3 near the GC is consistent with either type, as both the bulge and disk populations are substantial there.
The high velocities suggest that little deceleration has occurred. The mass of gas in a sphere of radius 2.2 pc is only for a mean number density and cosmic abundances. A model Type Ia explosion with an exponential ejecta profile (Dwarkadas & Chevalier, 1998) achieved the current size and shock velocity for standard explosion parameters, an age of 100 yr, and cm-3, characteristic of the ISM hot phase. For this density, the extremely low X-ray emission measure, combined with the ionization timescale of only cm-3 s, means that no significant X-ray line emission would be expected from shocked ISM. The age is so small that very little of the ejecta have been shocked, so a contribution to the spectrum from shocked ejecta should be small as well.
Densities might be larger than average in the northern radio-bright limb. We partitioned the shell into two sections, the northern limb and the remainder, and made joint fits with a nonthermal srcut model in both limb sections, adding a vpshock model with cosmic abundances in the northern limb alone. Thermal emission with emission measure as high as cm-3 for gas with temperature 4 keV and shock age cm-3 s can be accommodated by the current data; the very low ionization age suppresses most X-ray lines. (However, the absence of Fe K emission confirms that the continuum we see is nonthermal.)
The rolloff photon energy is related to the e-folding energy of the exponential cutoff in the electron spectrum, , by TeV (Reynolds & Keohane, 1999, with a numerical error corrected), where is in keV, and G is the post-shock magnetic field. From the fitted value keV, we infer TeV – the highest value ever reported for an integrated spectrum. However, with our very high shock velocities, the predictions of standard shock acceleration theory can easily accommodate such energies. If radiative losses cut off the electron spectrum, , so keV is independent of . Standard results (e.g., Reynolds 1998) for a shock with speed km s-1 give keV, for Bohm diffusion and a perpendicular shock, and a compression ratio of 4 (the estimate depends only weakly on these assumptions). We estimate , so we can easily reach the required value, even with considerably less efficient acceleration. An estimate of the limitation due to finite age can be made assuming no deceleration; the expression for acceleration time to energy given in Reynolds (1998) gives yr, so that the shock could produce our observed in only a few years. Likely higher values of at the bright limbs would then not pose any problem.
The contrasting X-ray and radio azimuthal brightness profiles imply substantial spectral differences between the northern and southern hemispheres. Preliminary spectral fits do suggest differences, but unexpectedly mainly in rather than . Efficient shock acceleration is expected to produce concave-up curvature in the particle spectrum (hardening to higher energies), so that in srcut is a mean radio–to–X-ray spectral index. If deeper X-ray observations confirm this form of spectral difference, the result may have significant implications for the understanding of shock acceleration. Other radio–X-ray differences, such as the faint “ears” of X-ray emission beyond the bright ring on the E and W sides, could in principle be due to pre-shock diffusion, or simply reflect lower sensitivity to faint radio emission. Estimates of the diffusion length, assuming a mean free path of one gyroradius of a 94 TeV electron in a magnetic field of a few Gauss, are roughly consistent with the observed length scale of , but more extensive radio and X-ray observations are needed to test this explanation.
A supernova this recent should produce a significant signal in the 1.156 MeV gamma-ray decay line as radioactive 44Ti decays first to 44Sc and then to 44Ca, as has been reported for Cas A (Iyudin et al., 1994). Estimates of the yield of 44Ti in SNe Ia range from to (Iwamoto et al., 1999), while CC predictions range between and (Thielemann, Nomoto, & Hashimoto, 1996). For a half-life yr (Görres et al., 1998), we predict a flux of ph cm-2 s-1 at an age of 140 yr. For comparison, the flux reported for Cas A is ph cm-2 s-1 (Iyudin et al., 1994). Renaud et al. (2006) examined INTEGRAL data from the GC region, acquired within the first 2 years of its operations, while searching for 44Ti-decay emission from another claimed young supernova remnant, G0.570–0.018. They showed a map of the Galactic plane near the GC with no evidence for emission from G1.9+0.3. They did not detect their target; the limit should apply as well to G1.9+0.3. For an age of 140 yr, their upper limit on the yield of 44Ti is ; at 160 yr, it has increased to . We believe a deeper INTEGRAL observation will provide an important test of the youth of G1.9+0.3 and may even help discriminate among progenitor masses (for CC) or explosion mechanisms (for Ia).
We can make crude predictions of continuum gamma-ray fluxes to be expected from G1.9+0.3, using results quoted in Reynolds (2008). The integral photon flux above 100 MeV due to the decay of mesons created by the collisions of cosmic-ray ions accelerated in G1.9+0.3 with ambient thermal gas is about ph cm-2 s-1, where the explosion energy is erg, and is the fraction of explosion energy in cosmic-ray ions (Drury, Aharonian, & Völk, 1994). This should very roughly scale as photon energy or slightly steeper, so that the integrated flux above 0.2 TeV is about ph cm-2 s-1, or about 1 mCrab. This is about times below the H.E.S.S. upper limit in the GC region (Aharonian et al., 2006); with and our density estimate of cm-3, we do not expect a detectable signal. The very high inferred from the synchrotron spectrum means that the predicted inverse-Compton spectrum from upscattering cosmic microwave background photons (ICCMB) will be depressed by Klein-Nishina effects. Any TeV upper limit can be accommodated by simply raising the magnetic field, as it means that fewer electrons are required to explain the synchrotron spectrum. But the predictions for ICCMB TeV flux are so low that the lower limit on the magnetic field corresponding to the current H.E.S.S. limit is less than 1 G.
4. Conclusions
We have detected expansion between 1985 and 2007 that demonstrates that SNR G1.9+0.3 has an age of about 100 years. It also has a synchrotron-dominated X-ray spectrum with the highest rolloff energy yet observed, but consistent with this very young age. Synchrotron domination requires both high shock speeds, for acceleration to energies of order 100 TeV and above, and low ambient densities, to suppress thermal X-ray emission. Both these conditions appear to be present for G1.9+0.3. The implied lack of deceleration is consistent with the requirement of a lack of thermal emission.
Our results invite many predictions. Our first, that a new radio observation should immediately show expansion, has already been verified. Another Chandra observation should show it as well. Time variations in the nonthermal fluxes, both radio and X-ray, are likely and may give information about the density profiles of ejecta and/or ambient medium. The INTEGRAL satellite will observe G1.9+0.3 shortly, testing the prediction for the 1.16 MeV gamma-ray line. The high absorbing column makes optical detection hopeless, but the implied high dust density suggests that a search for infrared light echos, such as those recently detected from Cas A (Krause et al., 2005; Kim et al., 2008; Dwek & Arendt, 2008), should be undertaken. At a projected distance of only 300 pc from the GC, G1.9+0.3 is likely to be near substantial local dust. A more extensive X-ray observation to search for any thermal emission is crucial, as such emission could corroborate this picture and also give information on a stage of SNR evolution never before observed.
References
- Aharonian et al. (2006) Aharonian, F.A., for the H.E.S.S. collaboration. 2006, ApJ, 636, 777
- Arnaud (1996) Arnaud, K.A. 1996, in Astronomical Data Analysis Software and Systems V, eds. G. Jacoby & J. Barnes ASP Conf. Ser. 101, 17
- Drury, Aharonian, & Völk (1994) Drury, L.O’C., Aharonian, F., & Völk, H. 1994, A&A, 287, 959
- Dwarkadas & Chevalier (1998) Dwarkadas, V.V., & Chevalier, R.A. 1998, ApJ, 497, 807
- Dwek & Arendt (2008) Dwek, E., & Arendt, R. G. 2008, ApJ, submitted (arXiv:0802.0221)
- Fulbright & Reynolds (1990) Fulbright, M.S., & Reynolds, S.P. 1990, ApJ, 357, 591
- Görres et al. (1998) Görres, J., et al. 1998, PRL, 80, 2554
- Gray (1994) Gray, A.D. 1994, MNRAS, 270, 835
- Green (2004) Green, D.A. 2004, Bull. Astr.Soc. India, 32, 335
- Green & Gull (1984) Green, D.A., & Gull, S.F. 1984, Nature, 312, 527
- Green et al. (2008) Green, D.A., et al. 2008, MNRAS, in press
- Iwamoto et al. (1999) Iwamoto, K., et al. 1999, ApJS, 125, 439
- Iyudin et al. (1994) Iyudin, A.F., et al. 1994, A&A, 284, L1
- Kim et al. (2008) Kim, Y., et al. 2008, ApJ, in press
- Koyama et al. (1995) Koyama, K., et al. 1995, Nature, 378, 255
- Koyama et al. (1997) Koyama, K., et al. 1997, PASJ, 49, L7
- Krause et al. (2005) Krause, O., et al. 2005, Science, 308, 1604
- Marshall et al. (2006) Marshall, D. J., et al. 2006, A&A, 453, 635
- Nord et al. (2004) Nord, M.E., et al. 2004, AJ, 128, 1646
- Renaud et al. (2006) Renaud, M., et al. 2006, ApJ, 638, 220
- Reynolds (1998) Reynolds, S.P. 1998, ApJ, 493, 375
- Reynolds (2008) Reynolds, S.P. 2008, ARA&A, 46, in press
- Reynolds & Keohane (1999) Reynolds, S.P., & Keohane, J.W. 1999, ApJ, 525, 368
- Sakano et al. (2002) Sakano, M., et al. ApJS, 138, 19
- Slane et al. (2001) Slane, P,O., et al. 2001, ApJ, 548, 814
- Thielemann, Nomoto, & Hashimoto (1996) Thielemann, F.-K., Nomoto, K., & Hashimoto, M. A. 1996, ApJ, 460, 408
- van den Bergh & Tamman (1991) van den Bergh, S., & Tammann, G. 1991, ARA&A, 29, 363
- Weingartner & Draine (2001) Weingartner, J.C., & Draine, B.T. 2001, ApJ, 548, 296
- Willett (2007) Willett, R. 2007, in Statistical Challenges in Modern Astronomy IV, eds. G.J. Babu & E.D. Feigelson, APS Conf. Ser. 371, 247