Strong Near-Infrared Emission Interior to the Dust-Sublimation Radius of Young Stellar Objects MWC275 and AB Aur.
Abstract
Using the longest optical-interferometeric baselines currently available, we have detected strong near-infrared (NIR) emission from inside the dust-destruction radius of Herbig Ae stars MWC275 and AB Aur. Our sub-milli-arcsecond resolution observations unambiguously place the emission between the dust-destruction radius and the magnetospheric co-rotation radius. We argue that this new component corresponds to hot gas inside the dust-sublimation radius, confirming recent claims based on spectrally-resolved interferometry and dust evaporation front modeling.
1 Introduction
The inner tenths of an AU in disks around young stellar objects (YSOs) hosts fascinating astrophysical phenomena like disk winds, jets, dust sublimation/condensation and thermal annealing, and gas in-fall onto the star. To make spatially resolved observations of these phenomena, milli-arcsecond angular resolution is needed even for nearest the systems. Using the sub-milli-arcsecond resolution capabilities of the CHARA (ten Brummelaar et al. 2005) interferometer array (operated by Georgia State University on Mt.Wilson), we probed inner disks of the YSOs MWC275 and AB Aur at 0.1AU scales and found NIR emission within the dust destruction radius in these systems.
MWC275 (A1e, d=122pc, V=6.86, K=4.59, M∗=2.3M⊙) and AB Aur (A0pe, d=144pc, V=7.01, K=4.37, M∗=2.4M⊙) are Herbig Ae stars - pre-main-sequence stars of intermediate mass. This class of stars shows a significant excess of near-infrared (NIR) flux (Natta et al. 2001) over the stellar photospheric emission. Current theories (Dullemond et al. 2001; Isella & Natta 2005; Tannirkulam et al. 2007) explain this excess solely on the basis of a “puffed up inner dust rim”. In these “rim” theories, dust sublimation terminates the circumstellar dust disk at a finite radius (the truncation radius depends on the luminosity of the central star and dust properties) creating an optically-thin cavity (Millan-Gabet et al. 1999; Tuthill et al. 2001; Eisner et al. 2004) around the star. The outer edge of the cavity forms a dusty rim that traps stellar photons, re-radiating the energy mostly in the NIR. The rim idea seems to broadly explain much of the correlation between the NIR sizes and luminosities of the stars observed in a number of YSO systems (Monnier & Millan-Gabet 2002; Monnier et al. 2005; Millan-Gabet et al. 2007).
However, recent results have begun to indicate that models in which the entire NIR excess arises solely from dust rims are inadequate in explaining some of the observed YSO properties. Akeson et al. (2005) noted that NIR emission from the the dust rim alone was not sufficient to explain the spectral energy distribution (SED) of some TTauri stars. Isella et al. (2006) pointed out that the dust evaporation temperatures of well studied astronomical dust types (Pollack et al. 1994) were too low (producing dust rims with large inner radii) to explain the anomalously small NIR size of AB Aur. Eisner et al. (2007) and Eisner (2007) had to invoke gas emission to account for the apparent decrease in NIR sizes of Herbig Ae/Be stars with decreasing wavelength. Most recently, Kraus et al. (2007) showed that the NIR visibilities of Herbig Be star MWC147 could not be explained without including emission from inside the dust evaporation radius. Due to the lack of sufficient spatial resolution, some of these conclusions are tentative and based on indirect arguments with multiple interpretations.
2 Observations
To unambiguously constrain NIR disk structure in YSOs, we began an observation campaign with the CHARA Array using the “CHARA Classic” beam combiner (ten Brummelaar et al. 2005) . The targets were observed at K band (central wavelength of 2.13 microns) with the long baselines of CHARA at a variety of orientations in 8 runs between June 2004 and June 2007. The longest baseline observation for MWC275 was 325m (resolution 111Resolution is defined as -lambda is wavelength of observation and D is the interferometer baseline length. of 0.67 milli-arcseconds) and 320m (resolution of 0.68 milli-arcseconds) for AB Aur. The data were reduced using standard CHARA reduction software (ten Brummelaar et al. 2005) and these results were cross checked with an independent code developed at University of Michigan (the full calibrated OIFITS data set will be posted on OLBIN - http://olbin.jpl.nasa.gov). HD164031 , HD166295 (Merand et al. 2005) and HD156365 with uniform-disk (UD) diameters of 0.83 0.08 mas, 1.2740.018 mas and 0.440.06 mas were used as calibrators for MWC275. AB Aur visibilities were calibrated with HD29645 (UD diameter=0.540.07 mas) and HD31233 (UD diameter=0.760.13 mas). The visibility errors (which include calibration errors, statistics and errors due to finite calibrator size) are at the 6% level, typical for CHARA Classic. The new fringe-visibility data from CHARA were combined with past measurements from IOTA (Monnier et al. 2006), PTI (Eisner et al. 2004) and the Keck Interferometer (Monnier et al. 2005) providing a baseline coverage from 15m-320m on the targets, placing strong constraints on the geometry of the inner-most disk regions.
The baseline orientations used have allowed us to clearly detect the asymmetry of the MWC275 disk (details in a followup paper), as having inclination=482o, PA=1362o, consistent with the inclination of 51 degrees, and PA of 13915o determined in Wassell et al. (2006). Thus, in Fig §2 the visibility of MWC275 is shown as a function of “effective baseline” -
where is the angle between the uv vector for the observation and the major axis of the disk and is the inclination of the disk. Under the flat disk assumption, the effective baseline correctly accounts for the change in resolution due to the disk inclination and PA (geometry of finitely thick disks is represented only approximately with optical depth effects and 3-D geometry of thick disks not being taken into account), allowing us to plot the visibility measurements as a function of one coordinate, simplifying presentation and analysis. As the AB Aur disk is near face on (Eisner et al. 2004), we have plotted its visibility as a function of true projected baseline (Fig §2).
3 Modeling
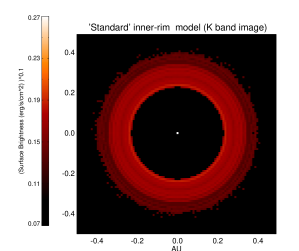
To elucidate the structure of the inner disk and the dust rim, we constructed dust-only rim models for MWC275 and AB Aur and fit the models to the visibility data. In these models, all of the K-band emission is assumed to come from the inner dust rim and the central star (“standard” model). The rim is in hydrostatic equilibrium and its shape is set by the pressure dependence of the dust grain evaporation temperatures (Isella & Natta 2005; Tannirkulam et al. 2007). The normalization of the pressure dependence of the evaporation temperatures (discussed in more detail in a followup paper) is adjusted so that the model rims fit the short baseline ( 100m) visibility data. As can be seen in Fig §1, a realistic treatment of dust physics produces a curved inner rim with a sharp inner edge, set by dust destruction, and a sharp outer edge, set by the fact that the rim shadows (Dullemond et al. 2001) a portion of the disk behind it preventing direct star-light from reaching the region.
We are able to fit the standard model to the visibility data for MWC275 and AB Aur at baselines shorter than 100m (Fig §2) fairly well 222The near-IR disk size obtained from the Keck Interferometer data is 20% larger than the size obtained with the CHARA data (June2004-Aug2006 epochs). The size determined from the S2W1 June2007 data also differs at the 25% level from the size obtained from earlier CHARA epochs. The size fluctuations could be related to the observed variability in the infrared photometry of MWC275 (Sitko et al. 2007). Variability does not affect any of our conclusions. (a result already established in multiple previous studies; Monnier & Millan-Gabet (2002); Eisner et al. (2004); Isella et al. (2006) ). Rim radii from the model fit are 0.19 AU (thickness 0.04 AU) for MWC275 and 0.21AU (thickness 0.05 AU) for AB Aur (see Table §1 for details). However, the standard model fails glaringly at fitting the long-baseline data. For baselines longer than 110m the standard rim predicts strong bounces in the visibility response which are not observed in the data.
The lack of bounce in visibility cannot be explained in the framework of the standard rim model. Models for NIR excess in Herbig Ae stars in which all of the excess arises in rims will display bounces in visibility at long baselines because of the presence of sharp ring-like features with high spatial frequency components in the corresponding images, even for the smoothest rims physically plausible.
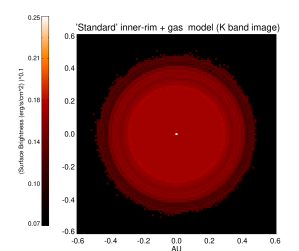
The only explanation for the absence of long-baseline visibility bounce in the data is the presence of an additional smooth emission component within the dust destruction radius that suppresses the large visibility bounces seen in a rim-only model (the smooth emission component has to be on size scales similar to the dust sublimation radius and cannot arise from a compact source like magnetospheric accretion). Fig §1 shows a standard model to which NIR emission has been added within the dust evaporation radius. Our data cannot uniquely constrain this emission profile and we assume a constant surface brightness disk (a uniform disk), which is a simple model. A rim + uniform disk model in which the uniform disk emission (refer Table §1 for details) accounts for 40-60% of the total K-band emission provides a good fit to the visibility (Fig §2) over the whole baseline range.
Besides the interferometry, emission inside the dust evaporation radius can also help explain the NIR flux budget of MWC275 and AB Aur. MWC275 and AB Aur have total K-band emission a factor of 10 larger than the stellar photospheric K-band emission, whereas the total emission produced by standard rim models (Isella & Natta 2005) is only a factor of 3.5 larger (SED analysis will be presented in a followup paper) than the photospheric emission. The emission component inside the dust rim can supply the “missing” K-band flux in MWC275 and AB Aur. In the next section we discuss candidates for the physical origin of this emission.
4 Physical Interpretation
We consider 3 opacity candidates for providing the smooth K-band emission component: a) a dusty spherical halo around the stars (Vinkovic et al. 2006), b) highly optically transparent/refractory dust extending inside the rim and c) gas inside the dust evaporation front. Vinkovic et al. (2006) showed that halo models can fit NIR SED and some early NIR interferometry data on Herbig Ae stars. However, the detection of asymmetries in NIR emission of MWC275 (Section §2) and other Herbig Ae/Be stars (Eisner et al. 2004) support a disk model over the spherically symmetric halo model of Vinkovic et al. (2006). The gas densities in the inner disk are not high enough to let dust survive beyond 1800K (Pollack et al. 1994), making optically transparent/refractory dust an unlikely candidate for the excess K-band emission.
Hot gas is an excellent candidate as a NIR emission source inside the dust sublimation radius. Molecular gas is known to have dense NIR opacity features at kilo-kelvin temperatures (Carr et al. 2004; Ferguson et al. 2005). The required gas emission levels to explain the long-baseline visibility data can be obtained with optically thin gas emission (optical depth 0.15) with a temperature range of 2500K-3500K (Muzerolle et al. 2004; Eisner 2007). Our claim regarding the presence of gas emission inside the dust rim is further supported by the detection of the Br line in young star HD104327 (Tatulli et al. 2007) on size scales similar to the dust destruction radius.
The required color excess (E(H-K)) from gas emission to match the SED in MWC275 and AB Aur is 0.1. MWC275 and AB Aur have Br emission equivalent widths of 6Å (Garcia Lopez et al. 2006). The equivalent widths are in principle sufficient to explain the color excess with free-free emission based on the observed correlation between color excess and Br equivalent width for Be stars (Howells et al. 2001). Thus free-free emission is also a good candidate for NIR emission inside the dust evaporation front.
At first thought, presence of binary companions or source variability would also seem good explanations for the excess K-band emission and the lack of visibility bounce at long baselines. However, the presence of a binary companion within 0.5 AU of MWC275 that contributes 50% of the total near-IR emission will cause changes of 0.5 in the absolute visibility of the system at any given baseline over the multiple CHARA observation epochs. This variation is not seen in the data (see Fig. §2). Furthermore, Monnier et al. (2006) obtained NIR visibility and closure-phase data on MWC275 and found no evidence for a binary companion ruling out binarity as an explanation for the observations. A comparison between the Keck Interferometer and CHARA data (taken in different observation epochs) in Fig. §2 shows that MWC275 visibilities are time variable at the 20% level, suggesting that variability could complicate our analysis. However, the data from the S2W1 CHARA telescope pair (Fig. §2) were obtained on a single night and show a similar visibility-baseline trend as the rest of the data, disfavoring variability as an explanation for the observed trends. Thus, our conclusion on the presence of smooth gas emission inside the dust destruction radius is robust.
5 Discussion
In this work, we have conclusively shown the presence of strong NIR emission between the magnetospheric co-rotation radius and the dust sublimation radius in Herbig Ae stars MWC275 and AB Aur. The underlying mechanism for this emission is not known requiring high resolution NIR spectroscopy and self-consistent modeling of the gas-dust transition region to identify the gas species and the physical processes responsible for the emission.
The detection of continuum gas emission within the dust destruction radius through long-baseline interferometry is of special importance to understanding the star-disk connection. Accretion models for YSOs have tended to focus on two separate physical scales (i) the process of mass and angular momentum transport in the outer disk and (ii) gas accretion from a few stellar radii on to the stellar photosphere. Milli-meter interferometry and direct imaging in the mid-IR have allowed observational access to the outer disk while high-resolution optical-spectroscopy can probe the circumstellar environment around YSOs on scales of a few stellar radii. Our near-IR interferometry results on MWC275 and AB Aur provides exciting prospects for connecting the two scales and determining the structure of the gas flow from a few tenths of an AU down to the stellar surface. In the following paragraph, we describe NIR interferometry as a tool in probing accretion physics inside the dust rim.
In the regime where in the inner gas disk is optically thin, the Shakura-Sunyaev viscosity parameter for the gas disk can be constrained using a combination of NIR interferometry and optical spectroscopy. NIR interferometry in multiple wavelength bands can constrain the inner gas-disk surface density and temperature profiles. The surface density of the disk is related to the mass accretion rate and the viscosity parameter in quasi-steady-state disks (Shakura & Sunyaev 1973). Thus, simultaneous measurements of mass in-fall rates (through modeling of optical-emission lines and optical continuum excess above photospheric emission (Calvet & Gullbring 1998; Muzerolle et al. 2001) ) and the gas surface density profiles will directly constrain the viscosity parameter ‘’ in the inner disk. This is key to understanding angular momentum transport in circumstellar disks.
References
- Akeson et al. (2005) Akeson, R. L., Walker, C. H., Wood, K., Eisner, J. A., Scire, E., Penprase, B., Ciardi, D. R., van Belle, G. T., Whitney, B. & Bjorkman, J. E. 2005a, ApJ, 622, 440
- Calvet & Gullbring (1998) Calvet, N. & Gullbring, E. 1998, ApJ, 509, 802
- Carr et al. (2004) Carr, J. S., Tokunaga, A. T. & Najita, J. 2004, ApJ, 603, 213
- Dullemond et al. (2001) Dullemond, C. P., Dominik, C. & Natta, A. 2001, ApJ, 560, 957
- Eisner et al. (2004) Eisner, J. A., Lane, B. F., Hillenbrand, L. A., Akeson, R. L. & Sargent, A. I. 2004, ApJ, 613, 1049
- Eisner (2007) Eisner, J. A. 2007, Nature, 447, 562
- Eisner et al. (2007) Eisner, J. A., Chiang, E. I., Lane, B. F. & Akeson, R. L. 2007, ApJ, 657, 347
- Ferguson et al. (2005) Ferguson, J. W., Alexander, D. R., Allard, F., Barman, T., Bodnarik, J. G., Hauschildt, P. H., Heffener-Wong, A. & Tamanai, A. 2005, ApJ, 623, 585
- Isella et al. (2006) Isella, A., Testi, L. & Natta, A. 2006, A&A, 451, 951
- Isella & Natta (2005) Isella, A. & Natta, A. 2005, A&A, 438, 899
- Kraus et al. (2007) Kraus, A., Preibisch, T. & Ohnaka, K. 2007, A&A, in press
- Garcia Lopez et al. (2006) Garcia Lopez, R., Natta, A., Testi, L. & Habart, E. 2006, A&A, 459, 837
- Howells et al. (2001) Howells, Lee, Steele, I. A., Porter, J. M. & Etherton, J. 2001, A&A, 369, 99
- Merand et al. (2005) Merand, A., Borde, P. & Coude Du Foresto, V. 2004, A&A, 433, 1155
- Millan-Gabet et al. (1999) Millan-Gabet, R., Schloerb, F. P., Traub, W. A., Malbet, F., Berger, J. P. & Bregman, J. D. 1999, ApJ, 513, L131
- Millan-Gabet et al. (2007) Millan-Gabet, R., Malbet, F., Akeson, R., Leinert, C., Monnier, J. D. & Waters, R. 2007, Protostars and Planets V, 539
- Monnier & Millan-Gabet (2002) Monnier, J. D. & Millan-Gabet, R. 2002, ApJ, 579, 694
- Monnier et al. (2005) Monnier, J. D., Millan-Gabet, R., Billmeier, R., Akeson, R. L., Wallace, D., Berger, J. P. & 28 coauthors, 2005, ApJ, 624, 832
- Monnier et al. (2006) Monnier, J. D., Berger, J. P., Millan-Gabet, R., Traub, W. A., Schloerb, F. P., Pedretti, E. & 10 coauthors 2006, ApJ, 647, 444
- Muzerolle et al. (2001) Muzerolle, J., Calvet, N. & Hartmann, L. 2001, ApJ, 550, 944
- Muzerolle et al. (2004) Muzerolle, J., D’Alessio, P., Calvet, N. & Hartmann, L. 2004, ApJ, 617, 406
- Natta et al. (2001) Natta, A., Prusti, T., Neri, R., Wooden, D., Grinin, V. P. & Mannings, V. 2001, A&A, 371, 186
- Pollack et al. (1994) Pollack, J. B., Hollenbach, D., Beckwith, S., Simonelli, P. D., Roush,
- Shakura & Sunyaev (1973) Shakura, N. I. & Sunyaev, R. A. 1973, A&A, 24, 337
- Sitko et al. (2007) Sitko, S. L., Carpenter, W. J., Kimes, R. L., Wilde, J. L., Lynch, D. K., Russel, R. W. & 6 coauthors 2007, ApJ, submitted
- Tannirkulam et al. (2007) Tannirkulam, A., Harries, T. J., & Monnier, J. D. 2007, ApJ, 661, 374
- ten Brummelaar et al. (2005) ten Brummelaar, T. A., McAlister, H. A., Ridgway, Bagnuolo, W. G. Jr., Turner, N. H. & 8 coauthors 2005, ApJ, 628, 453
- Tatulli et al. (2007) Tatulli, E., Isella, A., Testi, L., Marconi, A. & 94 coauthors 2007, A&A, 464, 29
- Tuthill et al. (2001) Tuthill, P. G., Monnier, J. D. & Danchi, W. C. 2001, Nature, 409, 1012
- Vinkovic et al. (2006) Vinkovic, D., Ivezic, Z., Jurkic, T. & Elitzur, M. 2006, ApJ, 636, 348
- Wassell et al. (2006) Wassell, E. J., Grady, C. A., Woodgate, B., Kimble, R. A. & Bruhweiler, F. C. 2006, ApJ, 650, 985
| Star | model | star | dust-rim | gas-disk | rim |
|---|---|---|---|---|---|
| type | emission | emission | emission | inner radius | |
| (%) | (%) | (%) | (AU) | ||
| MWC275 | dust rim only | 25 | 69 | - | 0.19 |
| dust rim+gas | 10 | 29 | 56 | 0.22 | |
| AB Aur | dust rim only | 22 | 73 | - | 0.21 |
| dust rim+gas | 12 | 45 | 38 | 0.25 |
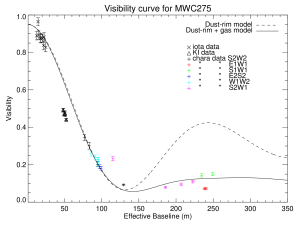
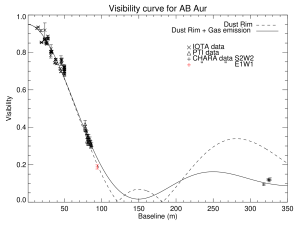
The dotted lines correspond to “Standard” rim models tuned to fit visibility data for each source for baselines shorter than 100m. The solid lines correspond to dust rim+gas models. The model parameters are listed in Table §1.