11email: v.bujarrabal@oan.es 22institutetext: Harvard-Smithsonian Center for Astrophysics, 60 Garden Street, Cambridge, MA 02138, USA
22email: rtm@cfa.harvard.edu 33institutetext: Submillimeter Array, Harvard-Smithsonian Center for Astrophysics, 645 North A’ohoku Place, Hilo, HI 96720, USA
33email: dfong@sma.hawaii.edu
Gomez’s Hamburger (IRAS 18059-3211): A pre main-sequence A-type star
Abstract
Aims. We study the nature of Gomez’s Hamburger (IRAS 18059-3211; GoHam), a nebula that has been proposed to be a post-AGB object. Such a classification is not confirmed; instead, we argue that it will be a key object in the study of disks rotating around young stars.
Methods. We present high resolution SMA maps of CO =2–1 in Gomez’s Hamburger. The data are analyzed by means of a code that simulates the emission of a nebula showing a variety of physical conditions and kinematics.
Results. Our observations clearly show that the CO emitting gas in Gomez’s Hamburger forms a spectacular disk in keplerian rotation. Model calculations undoubtly confirm this result. The central (mainly stellar) mass is found to be high, 4 for a distance of 500 pc. The mass and (relatively low) luminosity of the source are, independent of the assumed distance, very different from those possible in evolved stars. This object is probably transitional between the pre-MS and MS phases, still showing interstellar material around the central star or stellar system.
Key Words.:
Stars: circumstellar matter – stars: AGB and post-AGB – stars: formation – stars: individual: Gomez’s Hamburger1 Introduction
Gomez’s Hamburger (IRAS 18059-3211; hereafter GoHam) is a southern nebula with a very spectacular appearance in the optical (see Ruiz et al. 1987, and HST images in press release number 2002/19): an obscuring lane separates two flat, bright regions, presumably illuminated by a central star that remains hidden by the equatorial disk. The nebula was originally identified on a plate by A. Gómez, in 1985. The central star has been classified as an A0-type star, from spectroscopic analysis of the scattered light (Ruiz et al. 1987). Its spectral energy distribution (SED) shows two maxima, in the optical and FIR (Ruiz et al. 1987). Some emission excess at 2-10 m also appears, probably due to relatively hot dust. Similar features are often detected in pre-MS and post-AGB sources, they have been proposed to be due to reservoirs of material relatively close to the star, i.e. rotating disks (e.g. Chiang & Goldreich 1997; Wood et al. 2002; van Winckel 2003). In our case, the relatively low intensity of the optical maximum is due to strong absorption by grains in the disk, seen almost edge-on, the FIR maxima being due to reprocessed light.
Ruiz et al. (1987) proposed that GoHam is a post-AGB nebula, mainly based on similarities with some of such objects, like the Red Rectangle and M 1–92, and the absence of clear association with interstellar clouds. We also note the absence of conspicuous emission components in the Balmer lines, which are typical of protostars.
We present CO =2–1 high-resolution mapping of GoHam that undoubtly indicates that the nebula is essentially a disk in keplerian rotation. As we will see, the rotation velocity yields a relatively high mass for the central star(s). We will argue that the central stellar mass and luminosity are not compatible with those acceptable for post-AGB sources, but are very similar to those expected in pre-MS A-type stars.
2 Observations
The observations were obtained with the Submillimeter Array (SMA) on the night of 2006 June 6 (UT), with the array in the extended configuration. All eight antennas were operational. The J2000 coordinates used for IRAS 18059-3211 were R.A. = 18:09:13.37, Dec = –32:10:49.5. The receivers were tuned to place the 12CO =2–1 transition at 230.53797 GHz in the upper sideband, and the 13CO 2–1 transition at 220.39868 GHz in the lower sideband. During the track the precipitable water vapor above the array ranged from 1.2 to 2.0 mm. The DSB receiver temperatures ranged from 100 –140 K near source transit, to 160 –190 K at the lower elevation limit of 15 degrees. The correlator was configured to give a spectral resolution of 203.125 kHz (0.26 km s-1) per channel in the regions of the IF containing the CO lines, and a coarser 3.25 MHz (4.23 km s-1) per channel in the remaining regions of the full 2 GHz IF bandwidth. Ganymede was used as a flux calibrator, 3C279 was the bandpass calibrator, and observations of the quasars 1911-201 (2.3 Jy) and 1924-292 (4.4 Jy) were made every 20 minutes, to track changes in the instrument’s complex gain. IRAS 18059-3211 was observed from 08:45 to 15:00 UT, and 4.6 hours of on-source data was acquired. Projected baseline lengths ranged from 12 to 140 k.
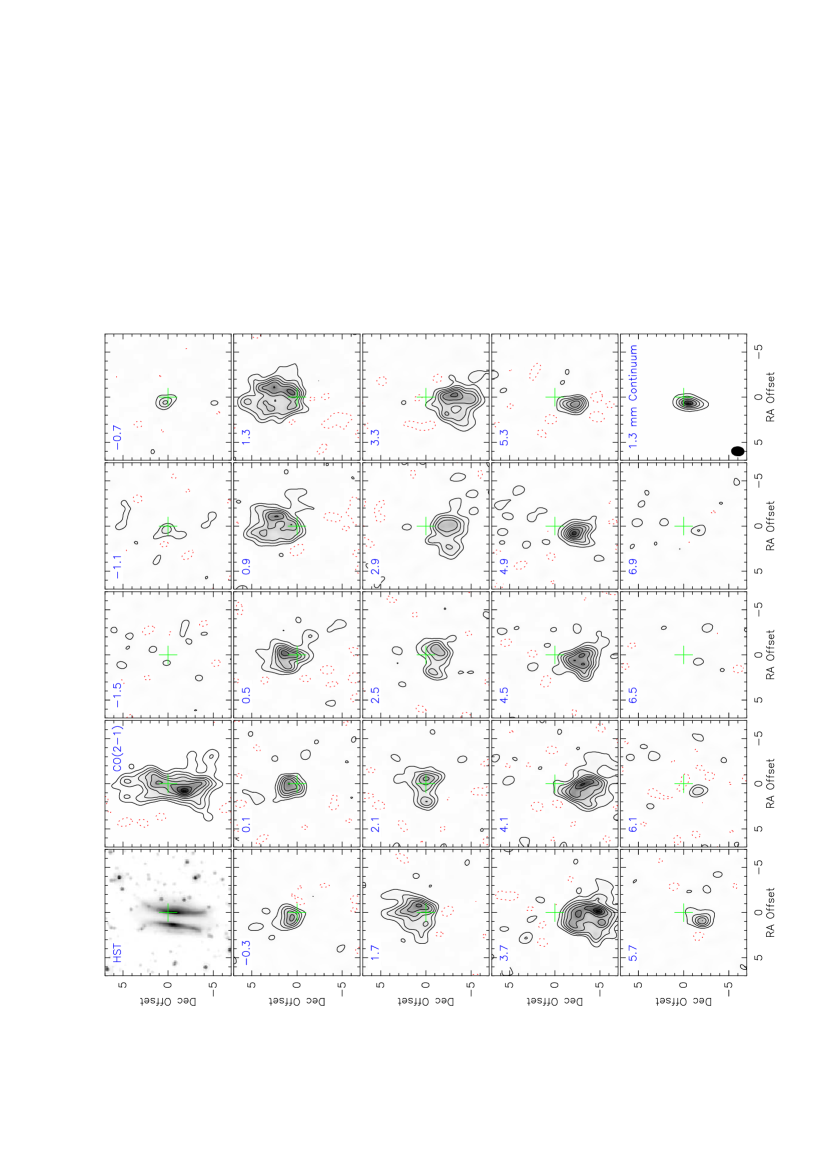
The MIR package was used for calibration. Antenna-based bandpass spectra were derived from the crosscorrelation data, and applied to flatten the spectral response. Next, pseudo-continuum data were derived by vector averaging the spectral channels in the region of the bandpass free of line emission. This pseudo-continuum channel was used to derive the fluxes of the quasars. The interleaved quasar observations were then used to calibrate the IRAS 18059-3211 data. The data were then exported to the AIPS package for mapping. Continuum emission was clearly detected in our source, and it was subtracted from the channels showing line emission before mapping (see Fig. 1). The measured continuum flux at 1.3 mm is 0.3 Jy; its deconvolved image is about 1′′ wide and elongated in the direction of the nebula’s major axis, at a position angle of about –5 degrees (measured from north to east). The J2000 coordinates of the continuum source center are R.A. = 18:09:13.42, Dec = –32:10:50.0.
From checks on the positions of the calibrators, we estimate that the accuracy in the absolute coordinates is 0.′′3.
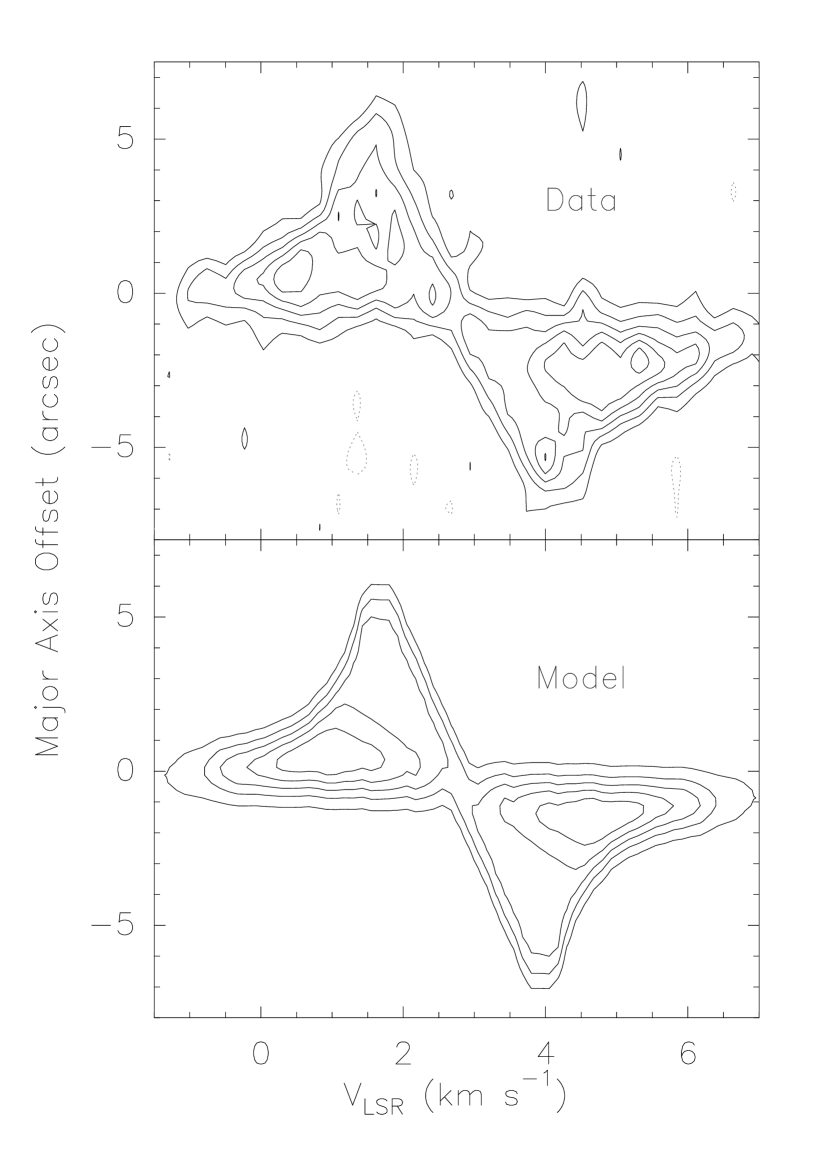
We present here the 12CO =2–1 maps, Figs. 1 and 2. The 1 noise in the channel maps is 0.1 Jy beam-1. The half-maximum size of the clean beam is 1.47x1.09 arcsec, the P.A. of the major axis being –10 degrees. The corresponding conversion factor from flux units to Rayleigh-Jeans–equivalent brightness temperature is 14.3 K/(Jy/beam). In Fig. 3 we show the line profiles of 12CO and 13CO =21 resulting from integration over the emitting region. The 13CO =2–1 observations, as well as 12CO 3–2 and 6–5 data obtained in a recent observing run, are still under analysis.
We also show in Fig. 1, first panel, and image obtained from the HST archive. This image was taken on April 12, 2006; HST project 10603, P.I.: D. Padgett. The NICMOS camera was used, with the F110W filter (wide filter centered on 1.10 microns) and an exposure time of 768 seconds. The position and orientation of the HST image is compatible with our mm-wave maps within the astrometric uncertainties.
3 CO emission model
We have analyzed our data using a model that simulates the emission of the nebula for a variety of physical conditions and kinematics; it was soon found that Gomez’s Hamburger is well modelled by a disk in keplerian rotation whose width increases with the distance to the center. The code and general features of the model are very similar to those described by Bujarrabal et al. (2003, 2005).
In the line emission model, the populations of the CO rotational levels are given by a single excitation temperature, which is assumed to be equal to the kinetic temperature. As discussed in our previous works, these approximations are valid for the typical densities actually found from our model fitting ( 105 cm-3) and the high opacities expected for the 12CO lines (from comparison of the data presented here with our preliminary 13CO maps, see Fig. 3). We assume a shape of the CO cloud and a spatial distribution of the velocity, temperature, density, and CO relative abundance. Given these parameters, our code calculates the brightness for a number of lines of sight solving the full radiative transfer equation. Opacity effects and velocity shifts are accurately taken into account. Such a brightness distribution is convolved with the cleaned telescope beam, and images with the same units as the observed ones are produced.
The continuum emission at = 1.3 mm is treated following Bujarrabal et al. (2005); note that its contribution is not subtracted in the observed velocity-position diagram, Fig. 2. We assume the detected mm-wave continuum to be due to optically thin dust emission, since the measured intensities are compatible with the extrapolation of the FIR dust emission (Ruiz et al. 1987). The free-free emission in young A-type stars (Skinner et al. 1993) is usually much weaker than the level detected in our data; in the Red Rectangle, a post-AGB source that could have similar properties as GoHam, the free-free contribution to the continuum at this frequency is also much lower than that of dust emission (e.g. Men’shchikov et al. 2002). In any case, the treatment of the continuum is the same if there is some significant contribution from optically thin free-free emission. Note that the very probably low optical depth of the dust continuum at this frequency simplifies the treatment and avoids discussions on the dust characteristic temperature. The spatial distribution of the dust emission coefficient is described in the code by a three-dimension gaussian function around the nebula center; the corresponding parameters are estimated from normalization of the resulting total flux and extent with respect to the data (Sect. 2). The effects of the dust continuum emission are however very small and hardly visible in the line maps.
| Parameter | Law | Values | comments |
|---|---|---|---|
| Outer radius | = 4.75 1016 () cm | ||
| Inner radius | = 3.5 1015 () cm | ||
| Disk | linear | = 2.3 1016 () cm | |
| thickness | = 5.4 1015 () cm | ||
| Tangential | = 1.6 km s-1 | ||
| velocity | (keplerian) | central mass: 4 () | |
| Temperature | = 21 K | plus increase in disk edges | |
| = 0.4 | (Sect. 3) | ||
| Gas density | = 2.5 106 () cm-3 | plus decrease in outer edges | |
| = 1 | (Sect. 3) |
| Other parameters | Law | Values | comments |
|---|---|---|---|
| Axis inclination from the plane of the sky | 5∘ | from optical and CO data | |
| Axis inclination in the plane of the sky (PA) | 85∘ | from optical and CO data | |
| Distance | 500 pc | from possible values of the luminosity and mass (Sects. 4 and 5) | |
| CO relative abundance | constant | 10-4 | from various CO data (Sect. 3) |
| LSR systemic velocity | 2.7 km s-1 | from CO data |
The disk shape is defined by its inner and outer radii (, ) and thickness () at these radii.
The macroscopic velocity is simply a keplerian rotation, defined by the tangential velocity at a given distance; the data are not compatible with the presence of significant expansion or infall velocities. The local velocity dispersion is assumed to be composed of the thermal dispersion (given by the kinetic temperature distribution, see below) and turbulent movements. However, including turbulence was not found to be necessary in our case to fit the data, whose low velocity dispersion indicates turbulent velocities 0.1 km s-1.
The total density and temperature of the disk gas are assumed to vary with potential laws. Thus, in our model: = and = , where , , , and are free parameters.
We assume a CO relative abundance (CO) = 10-4, usually found in interstellar condensations, but somewhat smaller than the values typical of young PNe. Note that, due to the assumption of a thermalized level population, changes in the abundance and density are compensated for exactly in the model predictions when the product remains constant.
To account for the increase in intensity observed to come from the edges of the disk (Fig. 1), we also included possible variations of the density and temperature in them. Since the 12CO lines are optically thick and this limb brightening does not appear in our 13CO data, such a phenomenon must be mostly due to a higher temperature and a lower density in the edges (which is in any case expected in this kind of disk). We have successfully fitted the data assuming that the outer 20% of the cone (in the axial direction) shows a temperature increase by a factor 2 and a decrease in density by a factor 10 (with respect to the general potential laws). We note that the brightness increase is less remarkable in the east part of the disk than towards the west due to significant selfabsorption. Some limb brightening is also found in the outer edge of the cone (in the disk plane), then implying variations of the same kind in these regions: our best fit includes an increase of the temperature, by 20%, in the outer very diffuse part of the disk (outer 25%), in which the density already shows a decrease by a factor of 10. We also assumed an increase of the temperature of 50% in the innermost regions, within and . Although we are not comparing here the physical conditions we find from our simplified fitting with disk models (to be done in a forthcoming paper), we note that such an increase of the temperature in disk edges is expected from theoretical results (e.g. Dullemond et al. 2007).
Note that the observed disk emission is not exactly symmetrical in velocity and position with respect to the rotation axis (P.A. 85∘; see Figs. 1, 2); our model assumes axial symmetry and only can reproduce an average of both parts. The emission from the outer, very diffuse edge of the disk (spatial offsets 5′′, shift relative to systemic velocity 1.2 km s-1, see Fig. 2), in particular, presents a noticeable asymmetry between the north and south parts of the disk. The asymmetry found in our maps with respect to disk equator (P.A. –5∘) is due to the slight inclination of the nebula axis with respect to the plane of the sky and well reproduced by our model.
The fitted values of the parameters describing the structure, kinematics and physical conditions in the model nebula are given in Table 1. The parameter values are scaled with the distance; we take = 500 pc as standard value following our final conclusions on the possible values of the stellar mass and total luminosity (Sect. 5). The density ranges between 1.5 107 cm-3 (close to the central star) and 1.5 106 cm-3, in the outer regions (ten times smaller in the very diffuse outermost edge). The temperature ranges between 65 K (close to the star) and 20 K (in the coolest equatorial regions).
We note that some of the fitted parameters are almost directly given by the observational features, their values are therefore quite accurate and not model dependent. The model fitting of course confirms the values that we directly measure from the maps. The velocity variation with the distance to the star is obviously kepler-like and the measurement of the central mass is accurate, see Fig. 2 and further discussion in Sect. 4. The diameter of the disk is also given by the observations, about 13′′, equivalent to 1017 cm at = 500 pc. The total width of the disk (at least its maximum value, at the end of the disk) can also be measured from our maps, we find a maximum width 3′′, 2.3 1016 cm at 500 pc. The data also indicate that the disk width increases more or less linearly with the distance to the center, the result being a flaring or quasi-flaring disk. Although such a thick disk cannot be considered to be exactly ’keplerian’, the variation of the tangential velocity does follow the law.
Since the 12CO =21 line is found to be optically thick, the dependence of its intensity on the density and CO abundance is small, and these parameters cannot be well determined from our data. The values used here have been chosen to be compatible with our preliminary 13CO maps, though no accurate fitting of our observations of both lines is attempted in this paper. In particular, we cannot give here an accurate measurement of the disk total mass. On the other hand, the fact that the line is optically thick allows us to determine the temperature that, regardless of selfabsorption effects, must be similar to the measured brightness temperature.
The inner radius of the CO-emitting disk is also not well determined from our data. We detect CO emission up to 3.5 km s-1 from the systemic velocity. For the assumed velocity law, this means that we detect emission from regions farther than 05. This value is similar to the beam radius, as expected, because much smaller regions are strongly diluted within our spatial resolution and more difficult to detect. On the other hand, we do not see a clear central minimum in our maps, confirming that the inner disk radius cannot be larger than the beam. Regions closer to the center than 05 may also be molecule rich, but they are not well probed by our data.
Our synthetic maps essentially depend on the nebula structure, velocity field and temperature distribution. In this work, we focus on the determination of the rotation velocity and the central (mainly stellar) mass, which involves in fact only one free parameter, at a given point. The distance is widely discussed in Sects. 4 and 5. Accordingly, the model remains very simple. The determination of the physical conditions (density, temperature, CO abundance) will be improved in a forthcoming paper, from fitting of several rotational transitions of 12CO and 13CO and a detailed discussion on the physical meaning of the results and their compatibility with theoretical considerations.
4 The mass and luminosity of Gomez’s Hamburger
Our observations clearly show that the CO emitting region in Gomez’s Hamburger is a disk, strikingly coincident with the equatorial dark lane and bright rims seen in the optical. The CO-rich disk is even slightly larger than the optical image and very probably represents the total nebular component of this source (Fig. 1). The position-velocity diagram along the equatorial direction clearly shows the butterfly-like shape characteristic of keplerian rotation (Fig. 2). Our model of emission from a rotating disk reproduces very closely the CO line observations of GoHam, see Fig. 2, confirming that the Gomez’s Hamburger nebula is a disk in keplerian rotation.
The optical image and the double-maximum SED of GoHam (Sect. 1, Ruiz et al. 1987) strongly support the identification of a disk seen practically edge-on. The energy radiated by our source shows a double maximum in the optical and FIR, with also some excess at about 2-10 m, which is characteristic of a disk rotating around a relatively hot star. Both young and post-AGB stars surrounded by disks of dusty material show SEDs of this kind (e.g. van Winckel 2003; Wood et al. 2002), in which the short- maximum comes from the stellar emission, absorbed and/or scattered by the grains, while the FIR maximum is due to the emission of the disk dust, heated by the stellar radiation.
Our model fits the rotating disk structure for a central mass () 8 , for a distance = 1 kpc; varies proportionally to the assumed distance. It is important to note that this result is very model-independent. Since the disk is seen almost edge-on, corrections to the tangential velocity and distance to the center due to the geometry are negligible. We can directly see from our maps and velocity-position diagram that gas at a distance of 6 arcseconds (equal to 9 1016 cm if = 1 kpc) rotates at 1.1 km s-1. Errors to these figures, directly taken from the maps, are smaller than 10%, including the correction due to projection effects (the correction to the observed velocity for an inclination of 10∘, see Sect. 3, is of less than 2%). These values of the velocity and distance also yield, assuming keplerian rotation, a central stellar mass () = (kpc). The choice of other velocity/position pairs yield the same mass, because, as previously mentioned, the velocity field is very exactly keplerian. Such a mass is very high for a post-AGB star, since the central stars of planetary nebulae are expected to have masses smaller than 1 , see e.g. Pottasch (1984), Blöcker (1995).
On the other hand, the total luminosity of GoHam, integrating all wavelengths, is moderate, 35 for = 1 kpc, since the apparent bolometric luminosity is 1.1 10-9 erg cm-2 s-1 (from careful study of the SED by Ruiz et al. 1987). Ruiz et al. (1987) compared the (apparent) SED of GoHam with those of two well known post-AGB objects, the Red Rectangle and M 1–92 (see their Fig. 4). GoHam is more than ten times weaker at all wavelengths than M 1–92 and about 100 times weaker than the Red Rectangle. M 1–92 has an absolute luminosity of 104 and a distance of about 2.5 kpc; the Red Rectangle has a luminosity 3.5 103 , assuming a distance of 710 pc (e.g. Bujarrabal et al. 2001; Men’shchikov et al. 2002). Both are typical post-AGB stars, and other objects in this evolutionary phase show very similar absolute luminosities. We also note that the mass of the binary system in the center of the Red Rectangle is well known, 1.5 , measured from the (almost) keplerian disk around it.
Accordingly, for GoHam to have a post-AGB luminosity, at least, 3 103 , it should be placed at a surprising distance 10 kpc. This would imply an exceptional central mass 80 , as well as a distance to the galactic plane 1 kpc, particularly unexpected for such a massive object. Even assuming that there is a binary in the center, we should need something like two 40 stars.
If we assume that the stellar component is a binary and most of the mass is in the less evolved star, it should have a mass of almost 80 . Then, the evolved star should have had an initial mass still larger (since it evolved faster), leading to still more surprising conclusions.
These conditions can be somewhat relaxed if we take into account that the stellar short- emission is absorbed by dust before it leaves the nebula. Ruiz et al. (1987) suggest a reddening 0.56; we must take into account that the interstellar extinction measured in the direction of our source is 0.5 mag (Dobashi et al. 2005). In any case we note that a significant absorption in the optical in the direction in the equatorial plane is clearly suggested by the nebula image. This effect would imply a strongly anisotropic emission in the optical and UV, being minimum in the direction of the equator (i.e. toward us). We can easily check that the correction due to the above extinction value is of the order of a factor ten (at short ). Larger correction values cannot be obtained for reasonable geometrical distributions of the circumstellar dust. Taking into account that the total emission from the stellar component of the actually observed SED is about 10 times smaller than the dust emission component, we conclude that the correction to the total luminosity due to extinction would increase it by a about factor two, up to 70 at = 1 kpc. The ’post-AGB distance’ estimated for this value of the luminosity would be 7 kpc, and the central mass should be close to 60 , still far too large. The correction of the extinction effects is uncertain, but in fact can hardly be much larger than this value, since the fraction of the total stellar light absorbed by the dust lane and reemitted in the FIR cannot be negligible. For the disk aperture deduced from our model fitting, about 1/3 of the total stellar light is intercepted by the dust lane. Therefore, the total luminosity would be at most three times larger than the FIR luminosity (about 100 , at 1 kpc), corresponding to the extreme case of negligible contribution of direct and scattered stellar light to the detected fluxes. Even in this case, the effects on the mass are very moderate, and a too large central stellar mass of 45 would be required. A similar correction is found in the models developed by Men’shchikov et al. (2002) for the Red Rectangle, a post-AGB star showing a massive rotating disk that is seen almost edge-on. We note that in other post-AGB stars showing rotating disks, the extinction due to dust is always moderate and the effects of the viewing angle on the luminosity determination are expected to be almost negligible (e.g. van Winckel 2003).
Even if we are now checking if GoHam can be a post-AGB object, we will also consider the effects of the viewing angle on the luminosity determination predicted by models of disks around pre-main-sequence stars. Moderate effects not exceeding changes by a factor two in the total luminosity are found by fitting of the SED using the models for young stellar objects by Robitaille et al. (2007). Wood et al. (2002) published a grid of calculations for different disk models. In extreme cases, these calculations yield a correction to the total luminosity of about a factor 10. Even adopting such a large correction, we would derive a too high value of the central stellar mass, 25 . We recall that these models are not well adapted to our object, mainly if we assume by the moment that it is in the post-AGB phase. Finally we note that the reasons why even very large corrections to the luminosity estimate cannot yield mass values comparable to that of an evolved star are: a) the luminosity depends on , while the mass derived from the velocity pattern varies like , so large variations of the luminosity yield much smaller variations of the mass, and b) the mass of post-AGB stars are expected to be significantly smaller than 1 , typically 0.5 , really very far from the values we derive.
Another option is to assume that the central mass is not stellar, but corresponds to a very massive and compact nebular component. Young planetary nebulae are much less massive, at most 1 , and not so compact (see Bujarrabal et al. 2001). There are two yellow hypergiants, IRC+10420 and AFGL 2343, surrounded by nebulae with about 5 (Castro-Carrizo et al. 2007), but these nebulae are spherical and very extended, both objects are placed at less than 500 pc from the galactic plane, and both have luminosities 5 105 .
We note, moreover, that at a distance of 10 kpc, the rotating disk would be a monster, with a total radius of 1018 cm and a total nebular mass larger than 10 , nothing comparable to known disks rotating around post-AGB stars (see Bujarrabal et al. 2005, 2007; van Winckel 2003).
5 Gomez’s Hamburger: A rotating nebula around a young pre-MS star
We have seen that it seems impossible to reconcile our knowledge on the mass and luminosity of Gomez’s Hamburger (GoHam) with the assumption that it is a post-AGB object. The discrepancy is so big that even the highest corrections to the total luminosity and distance are far from yielding an acceptable result.
Young stars may also be surrounded by CO-rich rotating disks (e.g. Dutrey et al. 2007). GoHam presents properties that, in fact, seem closer to those of rotating disks around pre-MS A-type stars than to those of post-AGB nebulae. The CO line profile (Fig. 3) is relatively symmetric and shows two peaks separated by about 2 km s-1. This structure is very similar to that found in AeBe stars (Dent et al. 2005; Raman et al. 2006, etc), particularly in stars isolated from interstellar clouds. However, post-AGB nebulae show in general very wide profiles with high-velocity wings (e.g. Bujarrabal et al. 2001), due to outflowing gas. Even in the Red Rectangle, the only post-AGB object in which a keplerian disk has been well identified, and in 89 Her, the best post-AGB candidate to harbor such a disk after the Red Rectangle, the CO profiles are different, showing a narrow central peak plus wide wings. In these cases, the wings are due to expanding outer gas in the nebulae. We recall that no trace of expanding gas has been found in GoHam.
We also note that the beautiful optical image of Gomez’s Hamburger (from which its name comes) shows a flat, three-component structure remarkably similar to optical images of disks around young stars (Grosso et al. 2003; Perrin et al. 2006; Watson et al. 2007, etc). The optical image of our source is however very different from the extended, prolate images of post-AGB nebula, including that of the Red Rectangle, e.g. Cohen et al. (2004).
If we assume that the star is a young pre-MS A-type star, some conflict still persists between the expected values of the stellar mass and luminosity and those derived from observations, but it is certainly much less severe. For a distance of 1 kpc, we have derived a central stellar mass 8 and a total luminosity of about 35 , or 70 for a strong extinction in the line of sight. If we assume that there is a binary stellar system in the center, a pre-MS primary with about 4 and 10000 K of surface temperature (value derived from spectroscopic and continuum data by Ruiz et al. 1987) should have a luminosity of about 140 , from comparison with our knowledge on similar young objects (see compilation of data on other pre-MS sources and evolutionary track calculations in, e.g., Piétu et al. 2003; van den Ancker et al. 1997).
Measured and expected values of the mass and luminosity are closer if we assume a shorter distance. For = 500 pc, a mass of the primary of about 2 is derived from our CO data (assuming a binary system). For such a distance, the total luminosity of GoHam derived from its SED is 18 . On the other hand, an A-type pre-MS star with 2 is expected to show luminosities 15 (Piétu et al. 2003; van den Ancker et al. 1997), compatible with the measured value. We note that, even in the pre-MS scenario, it is in principle necessary to assume that there is a binary system in the center of GoHam to be fully in agreement with theoretical evolutionary tracks. Otherwise, we should have to assume a shorter distance leading to luminosities under 10 , and young stars with such a low luminosity are not expected to reach a surface temperature of 10000 K.
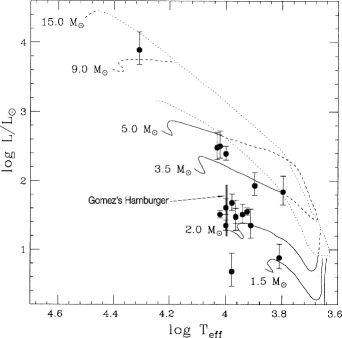
The stellar mass requirement is somewhat relaxed if we take into account that the central nebular mass is not negligible. From our continuum measurement, which is probably due to dust emission (Sects. 2, 3), we can infer the total mass for the innermost region (within 1′′). From the simple formulation described by Natta et al. (2000, see details on the assumed dust properties in that paper), we derive a mass of about . This may particularly affect the mass of the companion, and our stellar system would be formed by a A0-type star with 2 plus a cooler companion (probably a T Tauri star) with about 1 , always for a distance of 500 pc. We note that in the case of extreme absorption in the line of sight (expected for some heavy disks around pre-MS stars, Sect. 4), which yields a total luminosity of about 90 at 500 pc, only one central star with about 3 could explain both the total luminosity and the rotation curve of GoHam. The location of GoHam in the H-R diagram, assuming that it is a young star and taking into account these uncertainties in the luminosity, is shown in Fig. 4; we also represent well studied AeBe stars and evolutionary tracks from van den Ancker et al. (1998).

As noted by Ruiz et al. (1987), Gomez’s Hamburger is not associated with a conspicuous interstellar cloud. But it is within a region of the sky with a noticeable extinction of about 0.5 mag (Dobashi et al. 2005). We also note that many young A-type stars are not clearly associated with clouds (e.g. Dent et al. 2005), particularly in the case of low-luminosity stars, for which the pre-MS evolution is thought to be relatively slower. The low luminosity, the absence of conspicuous emission in Balmer lines, and the loose relation with interstellar clouds strongly suggest that our source is a relatively evolved star, perhaps close to entering the main sequence.
We do not think that the central star of GoHam is a young main sequence star, similar to the well known debris-disk objects. The absence of emission in the Balmer lines would support this possibility (although there is a population of A-type stars assumed to be very young that do not show such emission features, see e.g. The et al. 1994; Manoj et al. 2006). But the disks around young MS stars are thought to disappear relatively quickly (i.e. in 107 yr) and the debris disks are not massive, yielding a moderate FIR excess and being very rarely detected in CO emission (e.g. Thi et al. 2001; Dent et al. 2005).
In summary, we conclude that GoHam is very likely a young star at a distance of about 500 pc, still showing signs of interstellar material around it. GoHam is probably a transitional object between the pre-MS and MS phases, similar to stars like HD 141569, still surrounded by relatively massive circumstellar disks (e.g. Merín et al. 2004; Augereau et al. 1999). In any case, the gas disk orbiting the central star(s) of GoHam is exceptional: it is very massive and extended, and its study is favored by its observing angle (the disk is seen almost edge-on) and the lack of contamination due to surrounding interstellar clouds. We are accordingly convinced that GoHam will represent a milestone in the study of disks rotating around young stars.
Acknowledgements.
We are grateful to Mario Tafalla and Asunción Fuente for valuable discussions at several phases of this work. We would also like to thank the anonymous referees of this paper for their helpful criticisms. V.B. acknowledges support from the Spanish Ministry of Education & Science and European FEDER funds, under grants AYA2003-7584 and ESP2003-04957. The Submillimeter Array is a joint project between the Smithsonian Astrophysical Observatory and the Academia Sinica Institute of Astronomy and Astrophysics and is funded by the Smithsonian Institution and the Academia Sinica. Some of the data presented in this paper were obtained from the Multimission Archive at the Space Telescope Science Institute (MAST). STScI is operated by the Association of Universities for Research in Astronomy, Inc., under NASA contract NAS5-26555. Support for MAST for non-HST data is provided by the NASA Office of Space Science via grant NAG5-7584 and by other grants and contracts.References
- Augereau et al. (1999) Augereau, J. C., Lagrange, A. M., Mouillet, D., & Ménard, F. 1999, A&A, 350, L51
- Blöcker (1995) Blöcker, T. 1995, A&A, 299, 755
- Bujarrabal et al. (2005) Bujarrabal, V., Castro-Carrizo, A., Alcolea, J., & Neri, R. 2005, A&A, 441, 1031
- Bujarrabal et al. (2001) Bujarrabal, V., Castro-Carrizo, A., Alcolea, J., & Sánchez Contreras, C. 2001, A&A, 377, 868
- Bujarrabal et al. (2003) Bujarrabal, V., Neri, R., Alcolea, J., & Kahane, C. 2003, A&A, 409, 573
- Bujarrabal et al. (2007) Bujarrabal, V., van Winckel, H., Neri, R., et al. 2007, A&A, 468, L45
- Castro-Carrizo et al. (2007) Castro-Carrizo, A., Quintana-Lacaci, G., Bujarrabal, V., Neri, R., & Alcolea, J. 2007, A&A, 465, 457
- Chiang & Goldreich (1997) Chiang, E. I. & Goldreich, P. 1997, ApJ, 490, 368
- Cohen et al. (2004) Cohen, M., Van Winckel, H., Bond, H. E., & Gull, T. R. 2004, AJ, 127, 2362
- Dent et al. (2005) Dent, W. R. F., Greaves, J. S., & Coulson, I. M. 2005, MNRAS, 359, 663
- Dobashi et al. (2005) Dobashi, K., Uehara, H., Kandori, R., et al. 2005, PASJ, 57, 1
- Dullemond et al. (2007) Dullemond, C. P., Hollenbach, D., Kamp, I., & D’Alessio, P. 2007, in Protostars and Planets V, ed. B. Reipurth, D. Jewitt, & K. Keil, 555–572
- Dutrey et al. (2007) Dutrey, A., Guilloteau, S., & Ho, P. 2007, in Protostars and Planets V, ed. B. Reipurth, D. Jewitt, & K. Keil, 495–506
- Grosso et al. (2003) Grosso, N., Alves, J., Wood, K., et al. 2003, ApJ, 586, 296
- Manoj et al. (2006) Manoj, P., Bhatt, H. C., Maheswar, G., & Muneer, S. 2006, ApJ, 653, 657
- Men’shchikov et al. (2002) Men’shchikov, A. B., Schertl, D., Tuthill, P. G., Weigelt, G., & Yungelson, L. R. 2002, A&A, 393, 867
- Merín et al. (2004) Merín, B., Montesinos, B., Eiroa, C., et al. 2004, A&A, 419, 301
- Natta et al. (2000) Natta, A., Grinin, V., & Mannings, V. 2000, in Protostars and Planets IV, ed. V. Mannings, A. Boss, & S. Russell, 559–587
- Perrin et al. (2006) Perrin, M. D., Duchêne, G., Kalas, P., & Graham, J. R. 2006, ApJ, 645, 1272
- Piétu et al. (2003) Piétu, V., Dutrey, A., & Kahane, C. 2003, A&A, 398, 565
- Pottasch (1984) Pottasch, S. R. 1984, Planetary nebulae - A study of late stages of stellar evolution (Kluwer Academic Publishers, Astrophysics and Space Science Library. Vol. 107.)
- Raman et al. (2006) Raman, A., Lisanti, M., Wilner, D. J., Qi, C., & Hogerheijde, M. 2006, AJ, 131, 2290
- Robitaille et al. (2007) Robitaille, T. P., Whitney, B. A., Indebetouw, R., & Wood, K. 2007, ApJS, 169, 328
- Ruiz et al. (1987) Ruiz, M. T., Blanco, V., Maza, J., et al. 1987, ApJ, 316, L21
- Skinner et al. (1993) Skinner, S. L., Brown, A., & Stewart, R. T. 1993, ApJS, 87, 217
- The et al. (1994) The, P. S., de Winter, D., & Perez, M. R. 1994, A&AS, 104, 315
- Thi et al. (2001) Thi, W. F., van Dishoeck, E. F., Blake, G. A., et al. 2001, ApJ, 561, 1074
- van den Ancker et al. (1998) van den Ancker, M. E., de Winter, D., & Tjin A Djie, H. R. E. 1998, A&A, 330, 145
- van den Ancker et al. (1997) van den Ancker, M. E., The, P. S., Tjin A Djie, H. R. E., et al. 1997, A&A, 324, L33
- van Winckel (2003) van Winckel, H. 2003, ARA&A, 41, 391
- Watson et al. (2007) Watson, A. M., Stapelfeldt, K. R., Wood, K., & Ménard, F. 2007, in Protostars and Planets V, ed. B. Reipurth, D. Jewitt, & K. Keil, 523–538
- Wood et al. (2002) Wood, K., Lada, C. J., Bjorkman, J. E., et al. 2002, ApJ, 567, 1183