The unusual thickness dependence of superconductivity in -MoGe thin films
Abstract
Thin films of -MoGe show progressively reduced ’s as the thickness is decreased below 30 nm and the sheet resistance exceeds 100 . We have performed far-infrared transmission and reflection measurements for a set of -MoGe films to characterize this weakened superconducting state. Our results show the presence of an energy gap with ratio in all films studied, slightly higher than the BCS value, even though the transition temperatures decrease significantly as film thickness is reduced. The material properties follow BCS-Eliashberg theory with a large residual scattering rate except that the coherence peak seen in the optical scattering rate is found to be strongly smeared out in the thinner superconducting samples. A peak in the optical mass renormalization at is predicted and observed for the first time.
pacs:
74.78.-w, 74.81.Bd, 78.30.-j, 78.20.-eDisorder and reduced dimensionality affect the physical properties of metallic systems in a number of ways. Anomalous diffusion leads to localization of electrons and a related enhancement of the Coulomb interaction via reduced screeninganderson79 ; altshuler80 , seen as an increase in , the renormalized Coulomb interaction parameter. In a system of lower dimensions, the coupling to disorder increases, and pronounced effects are expected. Disorder-driven localization and the related enhancement of the Coulomb interaction inherently compete with the attractive interaction in superconducting metalsmaekawa81 ; anderson83 , described by the electron-phonon spectral density carbotte . This competition reduces the transition temperature. Of particular interest are two-dimensional (2D) superconductors in which the degree of disorder can be adjusted by varying the appropriate parameters. In an ideal 2D system, the relevant parameter is normally considered to be the sheet resistance, . The sheet resistance is determined by two factors: the (possibly thickness dependent) conductivity and the film thickness .
Amorphous MoGe (-MoGe) thin films are thought to be a model system for studying the interplay between superconductivity and disorder. Several transport experiments have revealed a sharp reduction in the superconducting transition temperature with increasing , even in the weakly localized regimegraybeal84 ; graybeal85 ; strongin ; raffy . The suppression of has been attributed to localization and an increase in the Coulomb interactionmaekawa81 . In this Letter, we explore the suppression in -MoGe thin films with different thickness via temperature-dependent far-infrared transmittance and reflectance. A strong suppression of with increasing is observed. The superconducting energy gap is also reduced, but the ratio of gap energy to transition temperature and the normal-state conductivity, both of which could be dependent on the disorder-driven Coulomb interaction, are not affected at all.
Our films were prepared by co-magnetron sputtering from elemental targets onto rapidly rotating (3 rev/sec or 1Å deposited/rev) single-crystal r-cut sapphire substrates (1 mm thick). A 75Å -Ge underlayer was first laid down on the substrates to ensure smoothness of the subsequently deposited MoGe films. For films prepared in similar fashion, no sign of crystalline inclusions were observed by x-ray and transmission electron microscopy. This procedure is known to yield uniform and homogeneous amorphous films of near ideal stoichiometrygraybeal84 ; graybeal85 . A thickness monitor gave the film thickness; the remaining parameters of our films, in Table 1, were all determined from optical measurements, described below.
| Film | (nm) | (K) | (cm | 111In units of /cm3 | ||
|---|---|---|---|---|---|---|
| A | 4.3 | 505 | - | - | - | |
| B | 8.3 | 4.5 | 260 | 12 | 3.7 | 1.20 |
| C | 16.5 | 6.1 | 131 | 16 | 3.9 | 1.49 |
| D | 33 | 6.9 | 69 | 18 | 3.8 | 1.66 |
Far-infrared measurements were performed at beamlines U10A and U12IR of the National Synchrotron Light Source at Brookhaven National Laboratory. U12IR, equipped with a Sciencetech SPS200 Martin-Puplett interferometer, was used for frequencies between 5 and 50 cm-1. A Bruker IFS-66v/S rapid scan Fourier-transform interferometer at U10A was used over 20–100 cm-1. A bolometer operating at 1.7 K provided excellent sensitivity; its window is responsible for the high-frequency cutoff of 100 cm-1. The films were in an Oxford Instruments Optistat bath cryostat, which enabled sample temperatures of 1.7–20 K. Transmittance and reflectance of four films were taken at various temperatures below . The normal-state transmittance and reflectance were taken at 10 K.
For a metal film of thickness , the wavelength of the far-infrared radiation, and , the skin depth (normal state) or penetration depth (superconducting state), the transmittance across the film into the substrate and the single-bounce reflectance from the film are both determined by the film’s complex conductivity according topalmertinkham ; gao96prb
| (1) |
| (2) |
where is the refractive index of the substrate and is the impedance of free space ( in cgs; 377 in mks). Although Eqs. 1 and 2 describe the physics of the thin film on a thick substrate, the transmittance and reflectance are influenced by multiple internal reflections within the substrate and the (weak) substrate absorption. After accounting for these effectsgao96prb , measurements of and at each frequency determine and . Beginning with Palmer and Tinkhampalmertinkham , this approach has been used a number of times in the past to obtain the optical properties of superconducting thin films.
We used the broadband far-infrared transmittance to determine the transition temperature. The normal-state transmission is temperature independent (on account of the dominant residual scattering). When, as the sample temperature is decreased slowly, superconductivity occurs, the broadband transmission increases. We call that temperature at which a measurable transmission increase first occurs. Finally, the normal-state infrared transmission, via Eq. (1), gives . (The frequency-independent transmission tells us that the normal-state .)
Figure 1 shows and at several temperatures for three films; the thinnest film did not superconduct at the lowest achievable temperature in our apparatus. The shape of the transmission curve is determined by a competition between and in Eq. (1). At low frequency the ratio goes to zero as due to the kinetic inductance of the superfluid, which yields while at the same time . The frequency of the maximum of occurs very close to the superconducting gap frequency because rises toward the normal-state value above the gap. At high frequencies .
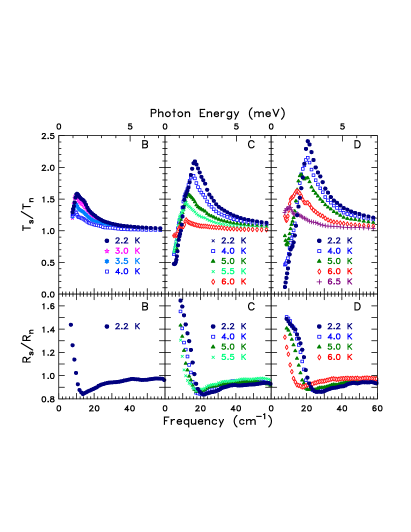
The data in Fig. 1 clearly show that the gap shrinks as temperature increases toward . At a given reduced temperature , the gap shifts to lower energy as the film becomes thinner. The suppression of with decreasing thickness (increasing ) is confirmed as well. Fits to these data using the dirty-limit, finite-temperature Mattis-Bardeen (MB)mattis conductivity expressions were good, consistent with the signal-to-noise ratio in the data, giving , slightly higher than the BCS weak coupling limit of 3.5. Changes in with thickness are much smaller than the reduction and not monotonic. (See Table 1 for the fit results.)
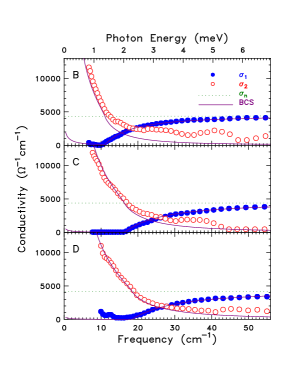
Figure 2 shows the 2.2 K results for the real and imaginary parts of the optical conductivity, and , for each film. The Mattis-Bardeen conductivities are also shown. The gap of in the absorption spectrum is evident. All three films have approximately the same normal state conductivity, cm-1 obtained from transmittance measurement of film in the normal state; the superconducting-state approaches this value at high frequencies. A similar value (4080 cm-1) is found by transport measurements. Thus, we conclude that the normal-state conductivity (or resistivity) is independent of the thickness of the film.
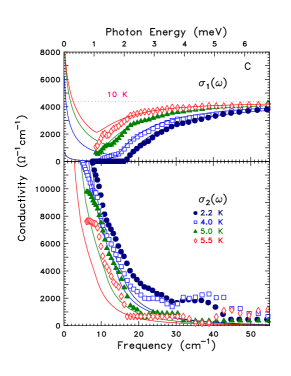
As the data is clearly in the dirty limit, the fitting with the MB expressions is quite adequate for obtaining the value of . However, in order to elucidate further features of the data, discuss changes in , and make predictions, we will now move to more sophisticated calculations using BCS-Eliashberg theory. Figure 3 shows the results for the real and imaginary parts of the optical conductivity, and , for film C. The lines are results of numerical calculations for the conductivity based on the Eliashberg equations and the Kubo formula for the current-current correlation functionmarsiglio . The electron-phonon spectral function was taken from that obtained through inversion of tunneling data on amorphous Mokimli and its mass enhancement parameter is fixed at 0.9. The Coulomb repulsion was adjusted to obtain the measured value of . Other parameters are the impurity scattering rate eV and the plasma energy eV. We will see later how these were obtained from the conductivity data itself. The agreement with the data for is best at the lowest temperature considered, with small deviations for near . This is true for all three films. The theory for agrees with the low-frequency behavior but tends to be below the experiment, especially at higher frequencies. The fit is less good with increasing , although the qualitative behavior is given correctly.
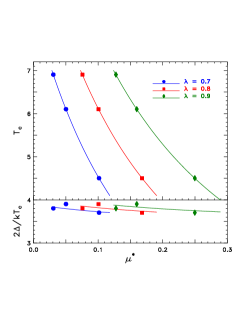
As changing the thickness of the sample could change both and the electron-phonon interaction, there is some choice in fitting the data with Eliashberg theory. In Fig. 4, we show results for and the gap ratio as a function of for three values of . For fixed , the points on the curve are from the experimental data for the MoGe films, illustrating the needed to obtain the . With and now fixed, the experimental points for the gap ratio can be compared to the prediction and there is good agreement. It is clear from this figure that keeping the ratio at 3.8 can be achieved through a change in as suggested inanderson79 ; altshuler80 ; maekawa81 ; anderson83 but one cannot rule out additional small changes in . In fact, Höhn and Mitrovićhohn in their Eliashberg analysis of tunneling data on disordered Pb films found evidence for a change in both these parameters with changing , where is the Fermi energy. Here such differences will not matter as we are in an impurity-dominated regime and the optics is not sensitive to the or value as we will explain. A of order 1 is needed, however, to get the measured value of the gap to . For definiteness, we only change leaving fixed.
To proceed with the analysis, we introduce the optical self-energy and use the extended Drude model, where the conductivity is written . The real part of gives the optical mass renormalization with and its imaginary part is related to the optical scattering rate according to . These quantities are shown in Fig. 5 for the thickest and thinnest superconducting samples at . To obtain , we had to use an impurity scattering rate of 3.5 eV. For cm/sec, this rate corresponds to a mean free path of nm. This value, while small, is consistent with other estimates and is much less than the thickness of the filmsgraybeal84 . Hence surface scattering is not important, , and the normal-state conductivity does not depend on sheet resistance.
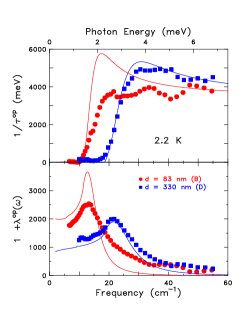
It is important to understand that the peaks in are the optical equivalent of density of states coherence peaks. The calculation for the thickest film fits the data well but for the thinner film the peak is very much attenuated, perhaps indicating a new effect outside standard Eliashberg theory. In their tunneling study of the metal-insulator transition in aluminum films, Dynes and coworkersdynes found a similar effect, namely, a broadening of the density of states coherence peak with increased sheet resistance. The lower panel of Fig. 5 gives the optical effective mass in the superconducting state. For both samples as , this quantity is very large, of the order of 1000, which is comparable to heavy fermion masses, although its origin is quite different. These values reflect directly the large impurity scattering and are related to the decrease in superfluid density with decreasing . In an Eliashberg superconductor, the superfluid density () at in the clean-limit case is given by , where is the electron density. In the dirty limit where , it is instead given by with dropping outmarsiglio . For fixed , this gives immediately a relation between the superfluid density , , and uemura ; homes ; argument The superfluid density so estimated is shown in Table 1; its variation is due entirely to the change in . We note also the large peak at in , predicted by theory and seen in the data.
In summary, the observed strong suppression of with increasing while the ratio remains constant at the intermediate value of 3.8 can be easily accounted for by a small decrease in , an increase in or a combination of both. The large residual scattering rate of our MoGe films makes their optical response indistinguishable from BCS; yet, because of Anderson’s theorem, remains bigger than 3.54. In such dirty samples a large value of the optical effective mass is predicted as well as a peak at , with a rapid decrease as is increased. Both effects are observed, the peak for the first time. Moreover, the optical scattering rate shows the expected coherence peak in the thickest film considered but is strongly suppressed in the thinnest superconducting one. This effect cannot be understood within BCS-Eliashberg theory and may indicate new physics.
Research is supported by the U.S. Department of Energy through Contract DE-FG02-02ER45984 at the University of Florida, DE-AC02-98CH10886 at the Brookhaven National Laboratory, NSERC of Canada and the Canadian Institute for Advanced Research.
References
- (1) P. W. Anderson, E. Abrahams, and T. V. Ramakrishnan, Phys. Rev. Lett. 43, 718 (1979).
- (2) B. L. Altshuler, A. G. Aronov, and P. A. Lee, Phys. Rev. Lett. 44, 1288 (1980).
- (3) S. Maekawa and H. Fukuyama, J. Phys. Soc. Jpn. 51, 1380 (1981).
- (4) P. W. Anderson, K. A. Muttalib, and T. V. Ramakrishnan, Phys. Rev. B 28, 117 (1983).
- (5) J. P. Carbotte, Rev. Mod. Phys. 62, 1027 (1990).
- (6) J. M. Graybeal and M. R. Beasley, Phys. Rev. B 29, 4167 (1984).
- (7) J. M. Graybeal, Physica, 135B, 113 (1985).
- (8) M. Strongin, R. S. Thompson, O. F. Kammerer, and J. F. Crow, Phys. Rev. B 1, 1078 (1970).
- (9) H. Raffy, R. B. Laibowitz, P. Chaudhari, and S. Maekawa, Phys. Rev. B 28, 6607 (1983).
- (10) L. H. Palmer and M. Tinkham, Phys. Rev. 165, 588 (1968).
- (11) F. Gao, G. L. Carr, C. D. Porter, D. B. Tanner, G. P. Williams, C. J. Hirschmugl, B. Dutta, X. D. Wu, and S. Etemad Phys. Rev. B 54, 700 (1996).
- (12) D. C. Mattis and J. Bardeen, Phys. Rev. 111, 412 (1958).
- (13) F. Marsiglio and J. P. Carbotte in Physics of Conventional and High Superconductors, ed. H. H. Bennemann and J. B. Ketterson (Springer-verlag, Berlin, 2002) Vol. 1, p. 233.
- (14) D. B. Kimhi and T. H. Geballe, Phys. Rev. Lett. 45, 1039 (1980).
- (15) T. Höhn and B. Mitrović, Z. Phys. B 93, 173 (1994).
- (16) R. C. Dynes, J. P. Garno, G. B. Hertel and T. P. Orlando, Phys. Rev. Lett. 53, 2437 (1984).
- (17) Y.J. Uemura, L.P. Le, G.M. Luke, B.J. Sternlieb, W.D. Wu, J.H. Brewer, T.M. Riseman, C.L. Seaman, M.B. Maple, M. Ishikawa, D.G. Hinks, J.D. Jorgensen, G. Saito, and H. Yamochi, Phys. Rev. Lett. 66, 2665 (1991).
- (18) C. C. Homes, S. V. Dordevic, M. Strongin, D. A. Bonn, Ruixing Liang, W. N. Hardy, Seiki Komiya, Yoichi Ando, G. Yu, N. Kaneko, X. Zhao, M. Greven, D. N. Basov, and T. Timusk, Nature 430, 539 (2004).
- (19) The “missing area” in gives the weight of the delta function and, consequently, the superfluid density: . If is constant, then .