11email: cnoel@ulb.ac.be 22institutetext: Département de Mécanique, Université catholique de Louvain, 1348 Louvain-la-Neuve, Belgium
A new reduced network to simulate detonations in superbursts from mixed H/He accretors
Abstract
Aims. We construct a new reduced nuclear reaction network able to reproduce the energy production due to the photo-disintegration of heavy elements such as Ru, which are believed to occur during superbursts in mixed H/He accreting systems. We use this network to simulate a detonation propagation, inside a mixture of C/Ru.
Methods. As our reference, we use a full nuclear reaction network, including 14758 reactions on 1381 nuclides.Until the reduced and full networks converge to a good level of accuracy in the energy production rate, we iterate between the hydrodynamical simulation, with a given reduced network, and the readjustment of a new reduced network, on the basis of previously derived hydrodynamical profiles.
Results. We obtain the thermodynamic state of the material after the passage of the detonation, and the final products of the combustion. Interestingly, we find that all reaction lengths can be resolved in the same simulation. This will enable C/Ru detonations to be more easily studied in future multi-dimensional simulations, than pure carbon ones. We underline the dependence of the combustion products on the initial mass fraction of Ru. In some cases, a large fraction of heavy nuclei, such as Mo, remains after the passage of the detonation front. In other cases, the ashes are principally composed of iron group elements.
Key Words.:
Hydrodynamics – Nuclear reactions, nucleosynthesis, abundances – Shock waves – Stars: neutron – X-rays: bursts1 Introduction
Superbursts have been discovered by long-term monitoring of the X-ray sky, using instruments such as RXTE and BeppoSAX. Compared to normal type I X-ray bursts, superbursts are 1000 times more energetics, with integrated burst-energies of approximately ergs; they last 1000 times longer, from hours to half a day; and they reoccur every one to a few years. They are rare: only 13 events have been identified from 8 sources (for reviews see Kuulkers Kuulkers2004 (2004), Cumming Cumming2005 (2005), and references therein). They exhibit similarities with normal type I X-ray bursts, such as a rapid rise in the light curve, a quasi-exponential decay, and a hardening of the spectrum during the rise followed by a softening during the decay. These attributes are well represented by a blackbody model, which has an effective temperature that grows during the rise, and decreases during the decay phase (Kuulkers Kuulkers2004 (2004)). This suggests that superbursts, like normal type I bursts, are thermonuclear in origin (Cornelisse et al. Cornelisse2000 (2000)). The current view is that superbursts are due to thermally unstable ignition of 12C at densities of about - g cm-3 (Cumming cumming2001 (2001), Strohmayer & Brown strohmayer2002 (2002), Cumming Cumming2005 (2005)).
Most superbursts have been observed in systems that accrete a mixture of H and He (Kuulkers Kuulkers2004 (2004)). In these H/He accretors, the 12C mass fraction that remains after the combustion of H and He, via the rp-process (Wallace & Woosley Wallace1981 (1981)), is unknown (Schatz et al. Schatz2001 (2001), 2003b , Woosley et al. Woosley2004 (2004)). Cumming & Bildsten (cumming2001 (2001)) showed that a 12C mass fraction of was sufficient for an unstable ignition; however, fits to the observed lightcurves suggest that the actual abundance is much larger (Cumming et al. cumming2006 (2006)).
Schatz et al. (Schatz2003 (2003)) showed that, at the high temperatures reached in superbursts (K), the photodisintegration of the heavy rp-process ashes influences the energetics of the detonation. More details about this interesting mechanism are provided below.
To calculate energy production, a simplified nuclear reaction network is, in general, used in astrophysical hydrodynamics simulations (e.g. Noël et al. Noel2007 (2007)). In this study, we extend such a network to include a contribution by rp-process ashes. However, full nuclear reaction networks are intractable in hydrodynamical simulations, where some calls to the nuclear reaction network, are required. This would be too time-consuming, in particular in multi-dimensional simulations that will be considered in a future work. For this reason, we constructed a reduced nuclear reaction network. This network and the detonation profiles are described in Sect. 2. Our results are discussed in Sect. 3.
2 Nuclear reaction network extension
In a mixed H/He accreting system, the detonation that leads to the superburst, is expected to propagate into the ashes of the rp-process, which occurred in the upper atmosphere. For simplicity, as in Cumming & Bildsten (cumming2001 (2001)), we represent the ashes using a fiducial heavy nucleus, 96Ru 111Choosing only 96Ru implies naïvely that the electron captures in the high-density environment have not occured yet and that only 96Ru is produced during the combustion phases preceding the superburst. Future detailled hydrodynamical simulation in X-ray burst may provide us with better initial conditions for the superburst.. We simulate the propagation of a detonation, in a mixture of 12C and 96Ru, with mass fractions , using the hydrodynamical algorithm described in Noël et al. (Noel2007 (2007)). This algorithm solves the adiabatic Euler’s equations for compressible, non-viscous gas-dynamics with source terms. It is a finite-volume method in the spirit of the original MUSCL scheme of van Leer (vanLeer1979 (1979)). The algorithm is of second-order in the smooth part of the flow, and avoids dimensional splitting. Parallelization, which is required to solve computationally, the problem in hand, is based on the mpi library, as described in Deledicque & Papalexandris (deledicque2005 (2006)). The equation of state accounts for partially degenerate and partially relativistic electrons and positrons. The ions are treated as a Maxwell-Boltzmann gas, and the radiation, considered to be at local thermodynamic equilibrium with the matter, follows the Planck law. Coulomb corrections to the equation of state are not included. In our simulations, these corrections would change the thermodynamic quantities of our ideal plasma by less than (Fryxell et al. Fryxell2000 (2000)), but will be included in future work.
It remains untractable at the present time to perform the hydrodynamical simulation with an extented network, so that a reduced network needs to be constructed. For this purpose, we first extend the reduced network of thirteen species from 12C to 56Ni used in Noël et al. (Noel2007 (2007)), with the -chain between 64Ni and 96Ru. We adopt the nuclear data from the Brussels nuclear reaction rate library (BRUSLIB), based on published compilations of experimental reaction rates, and on the determination of reaction rates using the statistical Hauser-Feshbach model (Aikawa et al. Aikawa2005 (2005), Arnould & Goriely Arnould2006 (2006)). The photodisintegration rates are calculated using the reciprocity theorem (Eq. (4) of Arnould & Goriely Arnould2006 (2006)). The resulting network is referred to as net0.
| Left | Right | |
|---|---|---|
| (g cm-3) | ||
| (K) | ||
| (cm s-1) | 0 |
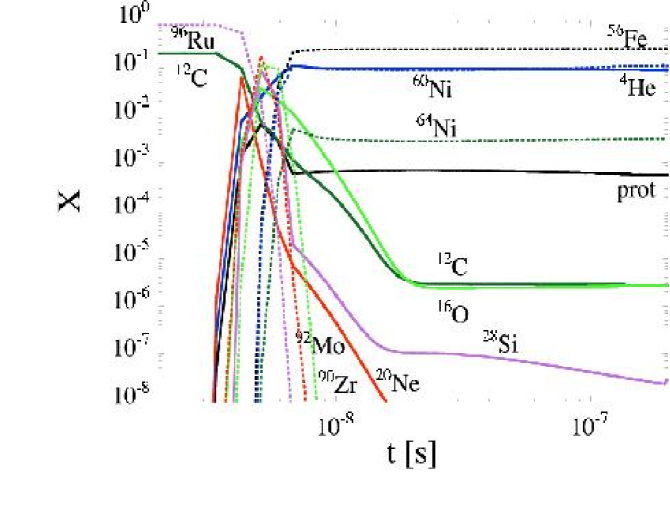
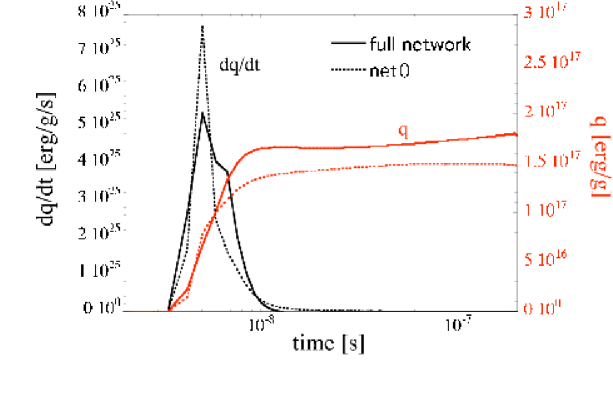
Using net0, we simulate a detonation, propagating in a mixture , . The ignition conditions are the same as used for pure in Noël et al. (Noel2007 (2007)) (see Table 1). The length of the domain is 1000 cm, the initial discontinuity is placed at x = 100 cm, where x is the distance from the left boundary of the domain, and the resolution is 1 cm (1000 numerical cells). We adopt a mixture and , at the left of the discontinuity. The nuclear energy generation, temperature, density and pressure profiles, at time s are presented in Fig. 1, in terms of the distance to the shock. The detonation velocity is cm s-1. Using the thermodynamic profiles presented in Fig. 1, we perform a full network calculation, including 14758 reactions on 1381 nuclides lying between the proton and neutron drip lines and with charge numbers Z50. Rates are taken from experiments, whenever available, and otherwise from the BRUSLIB library. The derived nuclear mass fractions, for some species are presented in Fig. 2. In Fig. 3 we compare the energy production rates of the reduced network net0, and of the full network. In this case the reduced network has reproduced the total energy production as well as the energy rate, of the full network. This favorable situation may not however, be possible, for detonations propagating in a mixture composed of a lower amount of 12C.

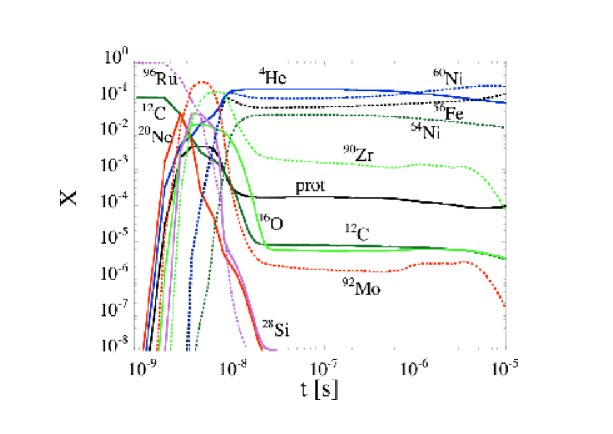
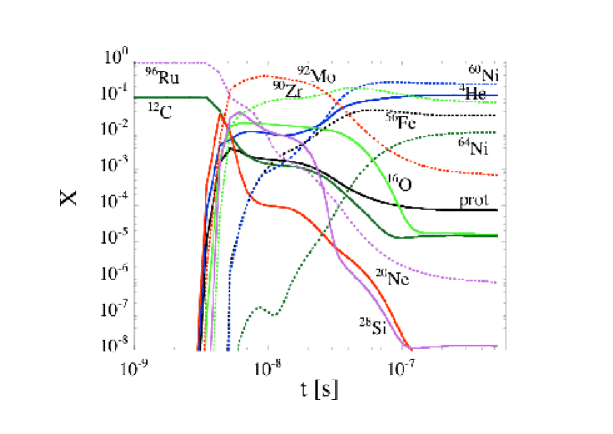
In a second step, we simulate a detonation propagating in a mixture , . The ignition conditions are similar to those used above. The nuclear energy generation, temperature, density, and pressure profiles, at time s are presented in Fig. 4 in terms of the distance to the shock. The detonation velocity is cm s-1. Using the thermodynamic profiles of Fig. 4, a full-reaction network calculation is performed. The derived nuclear mass fractions, for some species, are presented in Fig. 5.

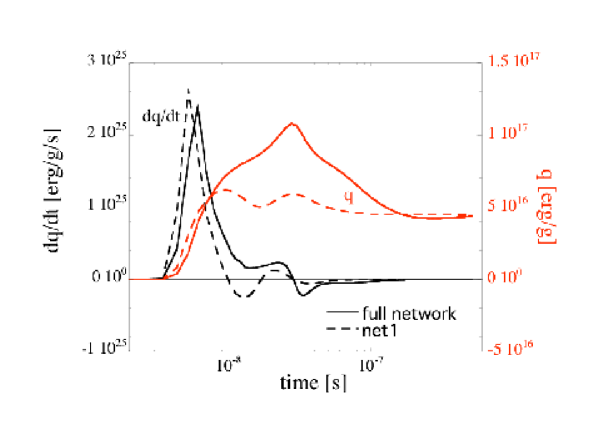
We compare the energy production rates, of the reduced network net0, and of the full network (Fig. 6). We see that this case is characterized by an endothermic phase, due to the enhanced initial abundance of 96Ru, and the significant contribution of the photodesintegration reactions, to the total energy balance, at an early stage. This phase of the energy generation profile obtained using the full network, is not reproduced by the reduced network net0. We therefore construct a more sophisticated reduced network, called net1. Let us describe the methodology used in its construction. In the reduced networks, only the capture or emission of -particles are taken into account. However, neutrons and protons can be produced significantly by photo-reactions, and be recaptured. In particular, the nucleus (Z-2,N-2), where Z is the charge number, and N the number of neutrons, can be produced by the photodesintegration of the nucleus (Z,N), following six additional paths, complementing the one; these include the emission of two neutrons and two protons. The characteristic timescale, for each of the seven possible paths is given by
| (1) | |||||
so that the total photo-reaction rate of (Z,N), leading to (Z-2,N-2), can be approximated by the effective rate
| (2) |
The reverse -capture rate can then be calculated using the detailed balance equation (Eq. (4) of Arnould & Goriely Arnould2006 (2006)). While , describing -photoemission, is the only path included in the net0 approximation, the neutron and/or proton photoemission could potentially dominate in the case of light (Z40) species, depending on the nuclei involved. In the neutron-deficient region (especially along the neutron-shell closures), the proton-photoemission is dominant, while close to the stability line the neutron-photoemission usually dominates. Any of these seven paths, however, can be impeded to a more or less large extent by the reverse nucleon captures that would modify the relative significance of a given path. This modification depends on the thermodynamic and composition conditions, as well as on the nuclear cross sections. To determine which paths are important, we use the following method. We first calculate the detonation profiles using net0. On the basis of the temperature and density profiles (for instance those of Fig. 4 for , ), the full reaction network is solved. This calculation allows to determine the dominant paths and to construct a reduced network with new effective reaction rates but the same reduced number of nuclei which is introduced in the hydrodynamical algorithm. We perform the detonation simulation using this new reduced network, and the resulting thermodynamical profiles are used again in a full network calculation. We iterate between a hydrodynamical simulation with a given reduced network, and the readjustment of a new reduced network, on the basis of the previously-derived hydrodynamical profiles, until the reduced and full networks converge to achieve high accuracy in the energy production rate. Note that no strict mathematical criteria have been used to estimate the quality of the newly-developed reaction network. In contrast, we estimate that the new network must fulfill two major conditions: it must reproduce the right order of magnitude (roughly within a factor of two) of the total amount of energy produced, and the possible appearance of endothermic phases. Indeed any endothermic phase can play a role of first importance on the detonation properties. In particular pathological detonations may occur (Fickett & Davis Fickett1979 (1979), Khoklov Khoklov1989 (1989), Sharpe Sharpe1999 (1999)).
In contrast to the reduced network used in Noël et al. (Noel2007 (2007)), which provided an energy source typical of explosive helium and carbon burning in the absence of hydrogen (Gamezo et al. Gamezo1999 (1999)), our reduced network depends on the detonation profiles, and initial composition. For each new detonation simulation, we construct the adapted reduced network using the iteration procedure described above.
Convergence is achieved in the case of , , with the following reduced network, called net1, in which the equivalent reaction rate, adopted for each photodisintegration from 92Mo to 64Ni, and from 56Ni to 16O is
| (3) |
and for 96Ru, . The inverse -capture rates are calculated using Eq. (4) of Arnould & Goriely (Arnould2006 (2006)), and the five remaining rates for 12C(12C,)20Ne, 12C(16O,)24Mg, 16O(16O,)28Si, 4He12C, and 12C4He, are similar to those used in net0.
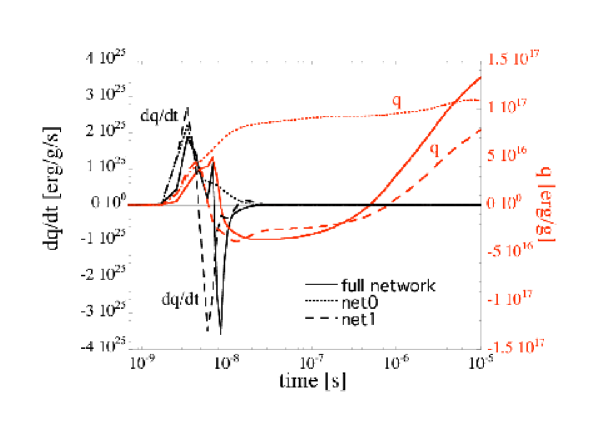
Figure 6 compares the energy production calculated using net0, net1, and the full network. Using the profiles obtained with net0 (Fig. 4), we perform a full network calculation, and compute the energy production rate. The same profiles are used for the reduced network net0, and the energy production rates are compared. We see that the endothermic part of the profile is not reproduced by the reduced network net0. A revised reduced network is therefore developed, net1, which simulates more accurately, the full network energy production rate. However, new detonation profiles, using the hydrodynamical algorithm have to be calculated with this new network. They are shown in Fig. 7, at time s. The domain length is of 2000 cm, and the resolution is of 1 cm. The initial discontinuity is positioned at x = 200 cm. The detonation velocity is cm s-1.

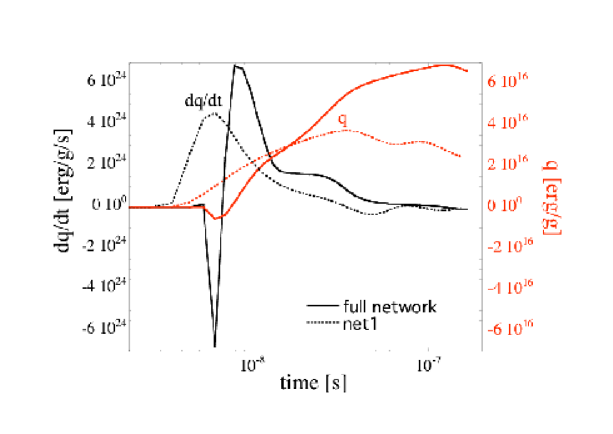
Using these new thermodynamic profiles (Fig. 7), network calculations of the energy production are made for the full network, and the reduced network net1, which are compared in Fig. 8. One sees that the reduced network reproduces satisfactorily the energy production given by the full network. We can therefore consider net1 as a suitable reduced network for the simulation of a detonation for a mixture , , and the initial conditions shown in Table 1. Adopting the thermodynamic profiles shown in Fig. 7, a final calculation is performed using the full network. The derived nuclear mass fractions for some species, are presented in Fig. 9. A comparaison between Fig. 5 and Fig. 9, reveals the sensitivity of the final composition to the choice of nuclear reaction network. For instance, net0 produces much less 90Zr and 92Mo than net1, at the end of the reaction zone.
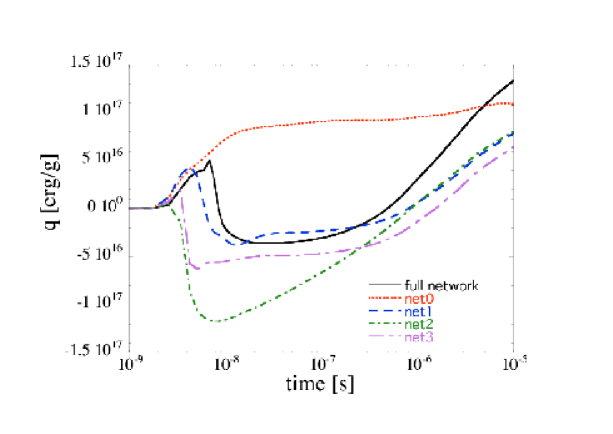
Far more than two reduced networks were tested in the iteration procedure. Figure 10 displays the total energy obtained, using five different reduced networks, for the thermodynamic profiles of Fig. 4. It is clear that net1 reproduces most closely the global energy obtained by the full network simulation.
Note that net1 includes photoneutron and photoproton paths that are found to reproduce globally all possible paths, when including neutrons and protons in the network. Both paths (path 1 and path 6 in Eq. 2) are required to simulate the bottlenecks which are related to the neutron (N=20, 28, 50), or proton (Z=20, 28) magic numbers, which are crossed by the photonuclear flow. All nuclei included in the reduced network are even-even, such that if a first reaction is possible, the resultant (Z,N-1) nucleus will certainly photo-emit a neutron. The same holds for proton emission. The equivalent rate in Eq. 3, simulates the possible inclusion of neutrons and protons in the network. The inverse effective -captures rate, that we deduced from detailed balance expressions, similarly enable to simulate the possible neutron and proton captures, without having to include neutrons and protons explicitely in the network. Finally note that for 96Ru, we do not take the (,n) and (,p) contributions from Eq. 3, into account to counterbalance the neutron and proton captures by 96Ru, at early time when the matter is almost entirely made of 96Ru.
We emphasize that the reduced network considered for the detonation of the mixture of , cannot be generalized automatically to cases characterized by different initial conditions. The construction of the reduced network does not only depend on the temperature and density time evolution, but also on the specific initial composition. Different initial mass fractions of the existing species, or a different elemental or isotopic composition, would require the construction of a new network, with new optimum effective reaction rates. As an example, we present a second case study, in which , , as considered by Cumming & Bildsten (cumming2001 (2001)). The detonation profiles, in this case, are shown in Fig. 11, using net1. The domain length is 1000 cm, the resolution is 1 cm, the initial discontinuity is placed at x = 100 cm, and the detonation velocity is cm s-1. We see in Fig. 12 that net1 does not reproduce the endothermic phase. A more suited network needs to be defined, for example, by considering a linear superposition of photorates, as in Eq. 2, that is different for each nucleus included in the network. Wheter such a scheme should be developed depends on the outcome of realistic modelling, of the initial composition of superbursts, in heavy elements.

3 Conclusion
We have shown that a simple extension of an -chain, might not be sufficiently accurate to reproduce the energy production rate of a detonation in a mixture that contains too much heavy elements. We have developed a new methodology to construct a reduced network, with adapted effective reaction rates, based on an iteration procedure between hydrodynamical simulations, with a chosen reduced network, and a comparison with full network calculations. In particular, we have constructed a new reduced network that reproduces satisfactorily, the energy generation rate of a reference network, including all reactions on all nuclides, probably involved in the specific case of the propagation of a detonation at K, and g cm-3, in a mixture , . Adopting such a reduced network, we have simulated detonation profiles. These profiles are used in a full network simulation to compute the associated nucleosynthesis. One sees that the presence of 96Ru decreases the total energy of the detonation, due to an endothermic phase at early stages. For this reason, the propagation velocity of the detonation decreases. For , , essentially only iron-group elements remain at the end of the reaction zone, with some addition of N=50 elements, such as 90Zr. This fact can influence the neutron star crust composition and properties, such as its conductivity, or its neutrino emissivity, as well as the ignition conditions for the superbursts (Weinberg & Bildsten Weinberg2007 (2007), Gupta et al. Gupta2007 (2007), Haensel & Zdunik Haensel1990 (1990)).
Interestingly, it can be seen that for , the detonation goes through a short endothermic phase (see Figs. 7-12) that cannot be described by net0 (Fig. 4). The photodesintegrations by emission are endothermic reactions, and only the recombination of particles up to Ni compensates for the energy loss. The energy is therefore released by the captures or recombinations of the protons, neutrons and -particles, liberated by the photodesintegrations. Furthermore a comparaison between Fig. 4 and Fig. 7 reveals that the temperature reached during the detonation is lower using net1, than net0, which influences the nucleosynthesis.
Computationally mixed C/Ru detonations are relatively easy to handle since the length-scales on which the different elements burn are comparable. This contrasts with the case of pure carbon detonations where a large variety of length-scales is obtained (Noël et al. Noel2007 (2007)), and where multiple simulations at different resolutions are required to fully resolve the detonation. In the C/Ru case, carbon and ruthenium burn on 10 cm, and the total reaction length is 1000 cm. The length-scales span only three orders of magnitude compared to six for pure carbon detonations. This is an encouraging feature for future multi-dimensional calculations.
Acknowledgements.
The numerical simulations presented herein were performed on the parallel computers of the Intensive Computing Storage of UCL and on HYDRA, the Scientific Computer Configuration at the VUB/ULB Computing Centre. We are grateful to M. Arnould for interesting discussions.References
- (1) Aikawa, M., Arnould, M., Goriely, S. et al. 2005, A&A, 441, 1195
- (2) Arnould, M. & Goriely, S. 2006, Nuclear Physics, A, 777, 157
- (3) Brown, E., F. & Bildsten, L. 1998, ApJ, 496, 915
- (4) Cornelisse, R., Heise, J. & Kuulkers, E. 2000, A&A, 357, L21
- (5) Cumming, A. & Bildsten, L. 2001, ApJ, 559, L127
- (6) Cumming, A. 2005, Nuclear Physics A, 758, 439
- (7) Cumming, A, Macbeth, J., Zand, J.J.M.i. & Page, D. 2006, ApJ, 646, 429
- (8) Deledicque, V. & Papalexandris, M.V. 2006, Combustion & Flame, 144, 821
- (9) Fickett, W. & Davis, W. C. 1979, Detonation, (Univ. California Press, Berkeley)
- (10) Fryxell, B.A., Olson, K., Ricker, P. et al. 2000, ApJS,131, 273
- (11) Gamezo, V.N. & Wheeler, J.C. & Khokhlov, A.M. & Oran, E.S. 1999, ApJ, 512, 827
- (12) Gupta, S. Brown, E. F., Schatz, H. et al. 2007, ApJ, 662, 1188
- (13) Haensel, P. & Zdunik, J. L. 1990, A&A, 229, 117
- (14) Khokhlov, A. M. 1989, MNRAS, 239, 785
- (15) Kuulkers. E. 2004, Nuclear Physics B (Proc.Suppl.), 132, 466
- (16) Noël, C. & Busegnies, Y. &. Papalexandris, M. V. et al. 2007, A&A, 470, 653
- (17) Schatz, H., Aprahamian, A., Barnard, V. et al. 2001, Phys. Rev. Lett., 86, 3471
- (18) Schatz, H., Bildsten, L. & Cumming, A. 2003, ApJ, 583, L87
- (19) Schatz, H., Bildsten, L., Cumming, A. & Ouellette, M. 2003b, Nuclear Physics A, 718, 247
- (20) Sharpe, G.J. 1999, MNRAS, 310, 1039
- (21) Strohmayer, T. E. & Brown, E. F. 2002, ApJ, 566, 1045
- (22) van Leer, B. 1979, J. Comp. Phys., 21, 101
- (23) Wallace, R. K. & Woosley, S. E. 1981, ApJS, 45, 389
- (24) Weinberg, N. N. & Bildsten, L. 2007, ArXiv e-prints, 0706.3062
- (25) Woosley, S.E., Heger, A., Cumming, A. et al. 2004, ApJS, 151, 75