The Disk Population of the Chamaeleon I Star-Forming Region11affiliation: Based on observations performed with the Magellan Telescopes at Las Campanas Observatory, Gemini Observatory, and the Spitzer Space Telescope. Gemini Observatory is operated by AURA under a cooperative agreement with the NSF on behalf of the Gemini partnership: the NSF (United States), the Particle Physics and Astronomy Research Council (United Kingdom), the National Research Council (Canada), CONICYT (Chile), the Australian Research Council (Australia), CNPq (Brazil) and CONICET (Argentina). Spitzer is operated by the Jet Propulsion Laboratory (JPL), California Institute of Technology under NASA contract 1407. Support for this work was provided by NASA through contract 1256790 issued by JPL. Support for the IRAC instrument was provided by NASA through contract 960541 issued by JPL.
Abstract
We present a census of circumstellar disks in the Chamaeleon I star-forming region. Using the Infrared Array Camera and the Multiband Imaging Photometer onboard the Spitzer Space Telescope, we have obtained images of Chamaeleon I at 3.6, 4.5, 5.8, 8.0, and 24 µm. To search for new disk-bearing members of the cluster, we have performed spectroscopy on objects that have red colors in these data. Through this work, we have discovered four new members of Chamaeleon I with spectral types of M4, M6, M7.5, and L0. The first three objects are highly embedded () and reside near known protostars, indicating that they may be among the youngest low-mass sources in the cluster ( Myr). The L0 source is the coolest known member of Chamaeleon I. Its luminosity implies a mass of 0.004-0.01 , making it the least massive brown dwarf for which a circumstellar disk has been reliably detected. To characterize the disk population in Chamaeleon I, we have classified the infrared spectral energy distributions of the 203 known members that are encompassed by the Spitzer images. Through these classifications, we find that the disk fraction in Chamaeleon I is roughly constant at % from 0.01 to 0.3 . These data are similar to the disk fraction of IC 348, which is a denser cluster at the same age as Chamaeleon I. However, the disk fraction at is significantly higher in Chamaeleon I than in IC 348 (65% vs. 20%), indicating longer disk lifetimes in Chamaeleon I for this mass range. Thus, low-density star-forming regions like Chamaeleon I may offer more time for planet formation around solar-type stars than denser clusters.
Subject headings:
accretion disks – planetary systems: protoplanetary disks – stars: formation — stars: low-mass, brown dwarfs — stars: pre-main sequence1. Introduction
Low-mass stars and brown dwarfs are important sites for studies of planet formation because most stars in the galaxy are low-mass stars while brown dwarfs offer an opportunity to explore planet formation in an extreme environment. Planet formation around low-mass stars and brown dwarfs can be investigated through observations of their primordial circumstellar disks. These observations are most easily performed at mid-infrared (IR) wavelengths (-20 µm) because this wavelength range provides the best combination of contrast of the disk relative to stellar photosphere, disk brightness, and sensitivity of available telescopes.
Molecular clouds that contain ongoing star formation ( Myr) are the natural laboratories for observations of circumstellar disks. Among these regions, Chamaeleon I is arguably the best site for studying disks around low-mass stars and brown dwarfs. It is one of the nearest star-forming regions to the Sun (-170 pc, Whittet et al., 1997; Wichmann et al., 1998; Bertout et al., 1999), making its low-mass members relatively bright. The cluster is young enough that it retains a significant population of primordial disks, but it is old enough that most of its members are no longer highly obscured by dust (). Because of the relatively low extinction, optical wavelengths are accessible for the spectral classification of the stellar population (Comerón et al., 2004; Luhman, 2004a, references therein) and for measuring diagnostics of accretion (Mohanty et al., 2005; Muzerolle et al., 2005). Optical and near-IR imaging and spectroscopic surveys of Chamaeleon I have produced an extensive census of the stellar and substellar cluster members (Luhman, 2007). In particular, this census is unbiased in terms of disks, which is essential for measuring the prevalence of disks. With known members at masses of 0.01-1 , Chamaeleon I is sufficiently rich for a statistical analysis of disks around low-mass stars and brown dwarfs. This region is also well-suited for observations of disks at mid-IR wavelengths. The stellar population is sparse enough that current mid-IR telescopes can resolve individual members, while compact enough for deep imaging of a large fraction of the cluster in a reasonable amount of time. In addition, the cloud exhibits relatively little nebulosity and extended emission at mid-IR wavelengths, which enables accurate photometry of the faint, low-mass members.
Several studies have searched for evidence of disks in Chamaeleon I through near- and mid-IR photometry. During pointed observations of known members, Glass (1979) and Jayawardhana et al. (2003) obtained photometry in the bands (1.2, 1.6, 2.2, 3.4 µm) for 17 and 15 members with spectral types as late as M4 and M8, respectively. Using a similar set of filters, Gómez & Kenyon (2001) and Kenyon & Gómez (2001) performed wide-field imaging of a 0.5 deg2 field that encompassed a large fraction of the Chamaeleon I cloud. Photometry at wavelengths longward of the -band offers more reliable detections of disks because of the better contrast of cool circumstellar dust relative to warmer stellar photopsheres. To obtain data of this kind for known young stars in Chamaeleon I and to search for new disk-bearing members of the cluster, Baud et al. (1984) observed Chamaeleon I with the Infrared Astronomical Satellite (IRAS) at 12, 25, 60, and 100 µm. They detected 70 sources, half of which are cluster members. A mid-IR survey with better sensitivity and spatial resolution was later conducted with the Infrared Space Observatory (ISO, Nordh et al., 1996; Persi et al., 2000), which provided photometry for 99 known members, including a brown dwarf with a spectral type near M8 (Natta & Testi, 2001; Apai et al., 2002). Mid-IR imaging also has been performed toward smaller areas surrounding the three most prominent reflection nebulae in the Chamaeleon I cloud using IRAS (Assendorp et al., 1990; Prusti et al., 1991) and ISO (Lehtinen et al., 2001).
The Spitzer Space Telescope (Werner et al., 2004) is currently the most advanced telescope operating at mid-IR wavelengths. Because of its high spatial resolution, excellent sensitivity, and large field of view, Spitzer is proficient at identifying disk-bearing members of young clusters (Allen et al., 2004; Gutermuth et al., 2004; Megeath et al., 2004; Muzerolle et al., 2004). This capability has been widely utilized through Spitzer surveys of nearby star-forming regions and young associations ( Myr), including Taurus (Hartmann et al., 2005; Luhman et al., 2006; Guieu et al., 2007), Perseus (Luhman et al., 2005b; Lada et al., 2006; Jørgensen et al., 2006; Muench et al., 2007; Rebull et al., 2007; Gutermuth et al., 2007), Lupus (Allen et al., 2007), Serpens (Harvey et al., 2006, 2007; Winston et al., 2007), Ori (Hernández et al., 2007; Caballero et al., 2007; Zapatero Osorio et al., 2007; Scholz & Jayawardhana, 2007), Ori (Barrado y Navascués et al., 2007), Orion OB1b (Hernández et al., 2006), Cha (Megeath et al., 2005), Chamaeleon II (Young et al., 2005; Allers et al., 2006; Porras et al., 2007), NGC 2362 (Dahm & Hillenbrand, 2007), Upper Sco (Carpenter et al., 2006; Scholz et al., 2007), Tr 37, and NGC 7160 (Sicilia-Aguilar et al., 2006). Extensive Spitzer imaging has been performed in Chamaeleon I as well. Some of these data have been used to examine the properties of the disk population of Chamaeleon I (Luhman et al., 2005b; Damjanov et al., 2007), identify low-mass brown dwarfs with disks (Luhman et al., 2005a, c), and search for outflows (Bally et al., 2006). In this paper, we present a comprehensive census of disks in Chamaeleon I using most of the Spitzer images between 3.6 and 24 µm that have been obtained in this region. We begin by describing the collection and analysis of the Spitzer images (§ 2) and the identification of new disk-bearing members of the cluster with these data (§ 3). We then use the Spitzer photometry of the known members of the cluster to investigate the global properties of the disk population of Chamaeleon I (§ 4).
2. Infrared Images
2.1. Observations
For our census of the disk population in Chamaeleon I, we use images at 3.6, 4.5, 5.8, and 8.0 µm obtained with Spitzer’s Infrared Array Camera (IRAC; Fazio et al., 2004a) and images at 24 µm obtained with the Multiband Imaging Photometer for Spitzer (MIPS; Rieke et al., 2004). The fields of view are and for IRAC and the 24 µm channel of MIPS, respectively. The cameras produce images with FWHM=1.6- from 3.6 to 8.0 µm and FWHM= at 24 µm.
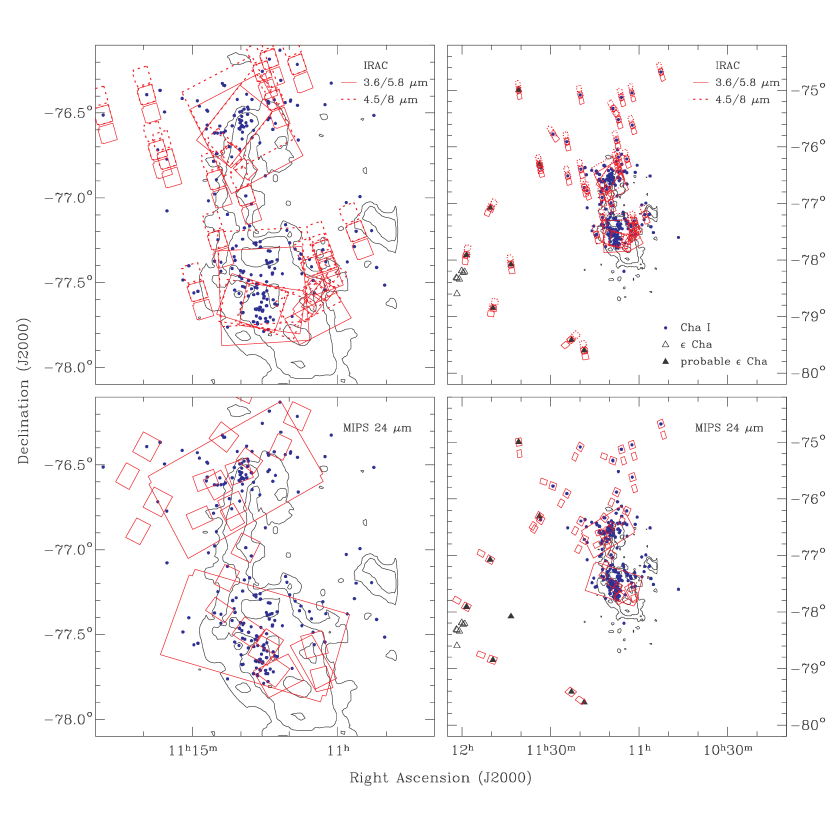
In this paper, we consider all IRAC and MIPS 24 µm observations that have been performed within a radius of from , (J2000) with the exception of the recently executed Legacy program of L. Allen, which has a program identification (PID) of 30574. These data were obtained through IRAC Guaranteed Time Observations (GTO) for PID=6, 36, and 37 (G. Fazio), IRAC and IRS GTO for PID=30540 (G. Fazio, J. Houck), IRS GTO for PID=40302 (J. Houck), Director’s Discretionary Time for PID=248 (S. Mohanty), and Legacy programs for PID=139, 173 (N. Evans), and 148 (M. Meyer). The characteristics of the IRAC and MIPS images are summarized in Tables 1 and 2, respectively. The boundaries of these images are indicated in the maps of Chamaeleon I in Figure 1.
2.2. Data Reduction
Initial processing of the IRAC images was performed with the Spitzer Science Center (SSC) S14.0.0 pipeline. The resulting Basic Calibrated Data (BCD) images were automatically treated for bright source artifacts (jailbar, pulldown, muxbleed, and banding) with customized versions of IDL routines developed by the IRAC instrument team (Hora et al., 2004; Pipher et al., 2004). Mosaicking of the treated BCDs was performed using R. Gutermuth’s WCSmosaic IDL package, which includes the following features: a redundancy-based cosmic ray detection and rejection algorithm; frame-by-frame distortion correction, derotation, and subpixel offsetting in a single transformation (to minimize data smoothing); and on-the-fly background matching. WCSmosaic was built with heavy dependence on the FITS and WCS access and manipulation procedures provided by the IDL Astronomy Users Library (Landsman et al., 1993). We selected a plate scale of pixel-1 for the reduced IRAC mosaics, which is the native scale divided by .
For the processing of the MIPS data, the SSC pipeline versions were S16.0.1 for Astronomical Observation Request (AOR) identifications of 5687040, 5688064, 5688320, and 5688576 and S16.1.0 for all other AORs. The resulting 24 µm images were reduced further with the MOPEX software from the SSC. The plate scale of the final images was pixel-1.
We used the IRAF task STARFIND to identify all point sources in the reduced IRAC and MIPS images. From the initial list of 3.6 µm detections from STARFIND, we rejected sources that were not detected in the 4.5 µm image for areas that were imaged by both channels. Similarly, we rejected STARFIND detections at 4.5 µm that did not have a corresponding detection at 3.6 µm. For the data at 5.8 and 8.0 µm, we retained only the sources that were detected in the 3.6 and 4.5 µm images, respectively. We marked the sources produced by these criteria on the images and removed remaining spurious detections through visual inspection.
We measured aperture photometry for the IRAC and MIPS sources using the IRAF task PHOT. We adopted zero point magnitudes () of 19.670, 18.921, 16.855, 17.394, and 15.119 in the 3.6, 4.5, 5.8, 8.0, and 24 µm bands, where (Reach et al., 2005; Engelbracht et al., 2007). For IRAC, we used an aperture radius of 4 pixels and inner and outer radii of 4 and 5 pixels, respectively, for the sky annulus. For MIPS, we adopted radii of 3, 3, and 4 pixels for the aperture and the inner and outer boundaries of the sky annulus, respectively. Using bright, isolated stars in the IRAC and MIPS images, we measured aperture corrections between our adopted apertures and the larger ones employed by Reach et al. (2005) and Engelbracht et al. (2007). For the MIPS data, we combined our aperture correction with the one estimated by Engelbracht et al. (2007) between their aperture and an infinite one. The total aperture corrections applied to our measurements are 0.18, 0.17, 0.23, 0.48, and 0.8 mag for 3.6, 4.5, 5.8, 8.0, and 24 m, respectively. Smaller apertures (and the appropriate aperture corrections) were used for sources that were near other stars, including the known members Hn 21W and E, the new member 2MASS J110629427724586 and its candidate companion Cha J110627887724543, and the new member 2MASS J110842967743500, which is close to the protostar IRN. Our quoted photometric errors include the Poisson errors in the source and background emission and the 2% and 4% uncertainties in the calibrations of IRAC and MIPS, respectively (Reach et al., 2005; Engelbracht et al., 2007). The errors do not include an additional error of mag due to location-dependent variations in the IRAC calibration.
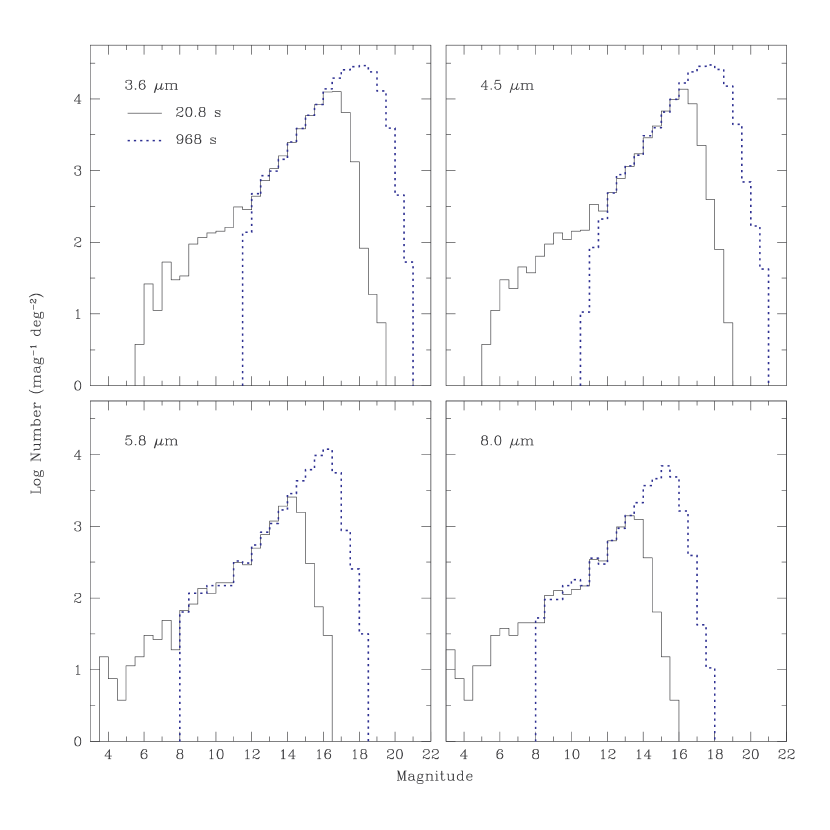
To illustrate the detection and completeness limits of the IRAC data, we consider the two shallow maps (AOR=3960320, 3651328) and two of the three deep maps (AOR=3955968, 12620032) that are centered on the northern and southern subclusters. The total exposure times at a given position in these maps are 20.8 and 968 s, respectively. For each exposure time and filter, we estimate the completeness limit by measuring the magnitude at which the logarithm of the number of sources as a function of magnitude departs from a linear slope and begins to turn over. Based on the distributions of IRAC magnitudes, which are shown in Figure 2, we arrive at completeness limits of 16.25, 16.25, 14.25, and 13.5 for the short exposures and 17.0, 16.75, 16.0, and 15.25 for the long exposures at 3.6, 4.5, 5.8, and 8.0 µm, respectively. The estimates for the short exposures are confirmed by the comparisons of the histograms for the short and long exposures in Figure 2. The improvement in the completeness limits from the short exposures to the long ones is smaller at 3.6 and 4.5 µm than at 5.8 and 8.0 µm because the short exposures at 3.6 and 4.5 µm are already near the depth at which source confusion begins to reduce completeness (Fazio et al., 2004b). Thus, the completeness limits of the longer exposures at 3.6 and 4.5 µm do not scale with and instead are limited by confusion. Our limits at 3.6 and 4.5 µm are similar to those measured by Fazio et al. (2004b) for deeper images of extragalactic fields. The short exposures at 8.0 µm exhibit the brightest completeness limit in our data, corresponding to a mass of 0.015 and a spectral type of M9 for an age of 2 Myr and the distance of Chamaeleon I according to evolutionary models (Chabrier et al., 2000). The fainter completeness limits of the other filters and exposure times are equivalent to masses of 0.003-0.01 for members of Chamaeleon I.
3. New Members of Chamaeleon I
3.1. Selection of Candidate Members
As shown in the maps of Chamaeleon I in Figure 1, most of the star-forming region has been imaged by IRAC and MIPS. Thus, we can use these data to search for new disk-bearing members of the cluster through the presence of mid-IR emission in excess above that expected from stellar photospheres. A color-color diagram constructed from IRAC measurements is an efficient tool for identifying sources of this kind (Allen et al., 2004; Megeath et al., 2004). Because our images encompass a large fraction of the known stellar population of Chamaeleon I, we can use our photometry for these sources to delineate the typical IRAC colors of young stars with disks. In Figure 3, we plot a diagram of versus for all known members that are not saturated and that have photometric uncertainties less than 0.1 mag in all of the IRAC bands, which consists of 153 sources. If an object has multiple measurements available in a given band, we have adopted the average of those measurements. As in other star-forming regions (Hartmann et al., 2005), the known members of Chamaeleon I form two distinct populations in Figure 3, stars clustering tightly near the origin and stars with much redder colors. The former are consistent with stellar photospheres while the latter indicate the presence of hot, optically-thick dust. In surveys for new members of Taurus and Lupus, Luhman et al. (2006) and Allen et al. (2007) used color criteria of and for selecting stars that might have disks. These colors bound the disk population in Chamaeleon I as well. Thus, we have applied these criteria to all sources in our photometric catalog for Chamaeleon I that have errors less than 0.1 mag in all four bands, which are shown in Figure 3. Stars classified as nonmembers in previous studies have been omitted (Luhman, 2004a, 2007). This process produced 350 candidate disk-bearing sources. Although its photometric errors are larger than 0.1 mag, we have also identified 2MASS J110842967743500 as a promising candidate because of its red IRAC colors and its close proximity to the protostar IRN.
We selected 17 candidates for spectroscopy to assess their membership, focusing on sources that are within the two main subclusters of Chamaeleon I and that are bright enough for optical or near-IR spectroscopy. The spectroscopic observations of eight of these candidates were described by Luhman (2007) while the data for the remaining nine candidates are presented in § 3.2. Using these spectra, we classify four candidates as new members and 13 candidates as nonmembers. One of the nonmembers, 2MASS J110812047622124, falls outside of the boundaries of the color-color diagram in Figure 3. Three of the nonmembers, 2MASS J110856517645154, 2MASS J111051857642259, and 2MASS J111053537726389, were identified as candidates because they exhibited excesses in preliminary photometric measurements that were used for selecting candidates for spectroscopy. However, upon further data analysis, we found that those apparent excesses were caused by contamination from cosmic rays, and that the sources do not exhibit excesses in our final photometry. For this reason, these three objects are excluded from Figure 3.
3.2. Spectroscopy of Candidates
3.2.1 Observations
We performed optical and near-IR spectroscopy on nine of the candidate members of Chamaeleon I that were selected in § 3.1 using the Low Dispersion Survey Spectrograph (LDSS-3) on the Magellan II Telescope and the Gemini Near-Infrared Spectrograph (GNIRS) at Gemini South Observatory. The GNIRS observations were conducted through program GS-2005A-C-13. Table 3 summarizes the observing runs and instrument configurations for the spectra. In Table 4, we indicate the night on which each new member was observed. We also observed known late-type members of Chamaeleon I for comparison to the candidates, obtaining LDSS-3 spectra of OTS 44 and Cha J110913637734446 and GNIRS spectra of T50, Hn 12W, Cha H 11, and CHSM 17173. The procedures for the collection and reduction of the LDSS-3 and GNIRS spectra were similar to those described by Luhman (2004c) and Luhman et al. (2004), respectively.
3.2.2 Nonmembers
Our spectroscopic targets are fainter than most of the known members of Chamaeleon I in the IRAC bands, which indicates that they should be low-mass stars or brown dwarfs if they are members of the cluster. Among the 17 candidates observed spectroscopically by Luhman (2007) and in this work, 13 sources do not exhibit the molecular absorption bands that characterize cool, low-mass objects. They also lack the hydrogen emission lines that are often seen in young stars with disks. Therefore, we classify these candidates as nonmembers. The spectral classifications of eight of these nonmembers were presented by Luhman (2004a). The remaining five sources (Cha J110817247631107, Cha J110830297733067, Cha J110840067627085, Cha J110908767626234, Cha J111205467631376) are classified as M0 based on the absence of molecular absorption bands.
3.2.3 New Member in Optical Sample
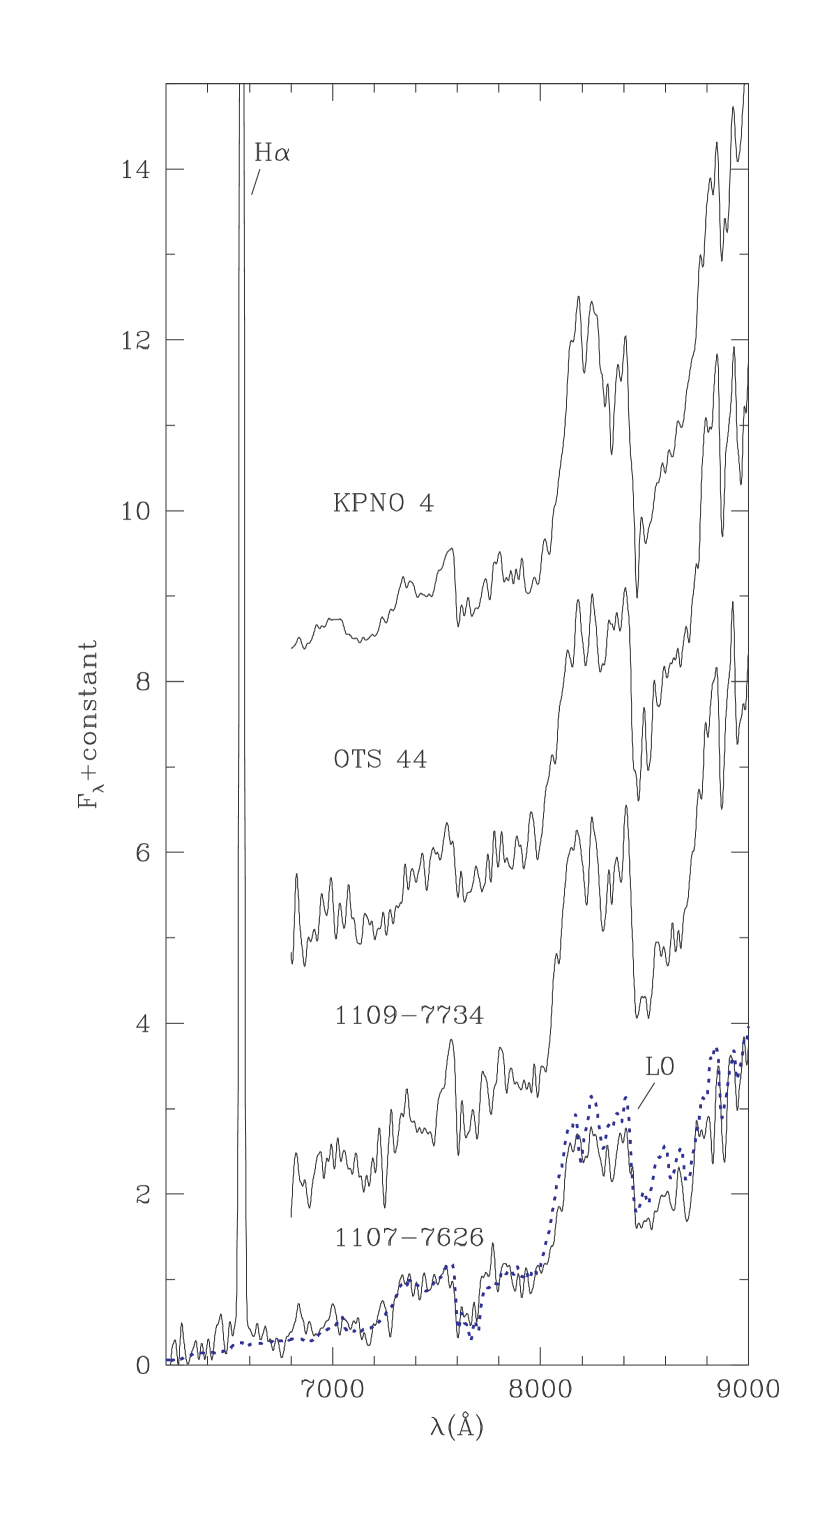
The remaining four candidates do show late-type spectral features and evidence of membership in Chamaeleon I. One of these candidates is in the LDSS-3 sample and the other three objects are in the GNIRS sample. We first discuss the source observed by LDSS-3, Cha J110707687626326 (hereafter Cha 11077626). The optical spectrum of this candidate is shown in Figure 4. The most obvious feature of this spectrum is the strong H emission line. The equivalent width of the line is uncertain because the surrounding continuum is weak and poorly measured, but it appears to have a value of several hundred angstroms. The line is clearly stronger than the emission observed in active late-type field dwarfs (Gizis et al., 2002) and indicates the presence of accretion. The H emission and the mid-IR excess emission together demonstrate the youth of Cha 11077626, and thus we conclude that it is a member of Chamaeleon I.
To measure its spectral type, we have compared Cha 11077626 to optically-classified late-type members of Chamaeleon I and other star-forming regions (Luhman, 2004a, 2007) as well as standard field dwarfs (Kirkpatrick et al., 1999). The results of our classification are illustrated in Figure 4, where we compare Cha 11077626 to the young late-type objects KPNO 4, OTS 44, and Cha J110913637734446 and the L0 field dwarf 2MASS J03454316+2540233 (Kirkpatrick et al., 1999). KPNO 4 and OTS 44 have optical spectral types of M9.5 (Briceño et al., 2002; Luhman, 2007) and Cha J110913637734446 was classified as M9 with IR spectra (Luhman, 2007). We now classify the latter as M9.50.5 based on the similarity to KPNO 4 and OTS 44 in the optical data in Figure 4. Compared to the three young M9.5 objects, Cha 11077626 exhibits weaker TiO and VO absorption, which suggests a later spectral type. Indeed, its spectrum agrees better with the L0 field dwarf, as shown in Figure 4. Because the transition from M to L types is defined by the disappearance of TiO absorption at 7000-7200 Å (Kirkpatrick et al., 1999), we need a spectrum with a higher signal-to-noise ratio at those wavelengths to definitively classify Cha 11077626 as L-type. However, given that its spectrum agrees significantly better with L0 than M9.5, we tentatively classify it as L0.
The comparison of Cha 11077626 to the field dwarf in Figure 4 indicates that it has negligible extinction (). By combining its -band magnitude with a bolometric correction for L0 (Dahn et al., 2002) and a distance modulus of 6.05 (Luhman, 2008), we estimate a bolometric luminosity of . At this luminosity, Cha 11077626 is tied with Cha J110830407731387 (Luhman, 2007) as the least luminous known member of Chamaeleon I.
To estimate the mass of Cha 11077626, we begin by examining its position on the Hertzsprung-Russell (H-R) diagram. To do this, we must convert the spectral type of Cha 11077626 to an effective temperature. In our previous studies of young late-type objects, we have performed conversions of this kind with the temperature scales from Luhman (1999) and Luhman et al. (2003), which spanned M1 to M9. The former scale was designed to produce coevality for the components of the young quadruple system GG Tau (K7-M7.5) on the model isochrones from Baraffe et al. (1998). Luhman et al. (2003) adjusted that scale at M8 and M9 to improve the coevality between the coolest members of Taurus and IC 348 and the members at earlier types. The resulting scale was then extrapolated to M9.25 and M9.5 as cooler objects were discovered in Taurus and Chamaeleon I (Briceño et al., 2002; Luhman et al., 2004; Luhman, 2007). For the purposes of this study, we continue this extrapolation to L0 for Cha 11077626, arriving at a value of 2200 K. Using this temperature and our luminosity estimate, we have placed Cha 11077626 on the H-R diagram in Figure 5. We have included all other known low-mass members of Chamaeleon I (Luhman, 2007) as well as the three new members that we have found with GNIRS (§ 3.2.4). Four of the previously known members have formal spectral types of M9 because they were classified through H2O absorption bands, and the variation of these bands with optical spectral type is unknown for young objects later than M9.5. However, the strengths of the H2O bands in these objects do agree with those of OTS 44 and KPNO 4, which have optical types of M9.5. Thus, it is likely that they have spectral types near M9.5.
The cluster sequence for Chamaeleon I in Figure 5 is parallel to the model isochrones for members earlier than M8, which is expected since the adopted temperature scale was designed to produce coevality for the GG Tau system. However, the sequence does not remain parallel to the isochrones at later types. Most members earlier than M8 appear between the isochrones for 1 and 10 Myr, while the coolest brown dwarfs, including Cha 11077626, are bracketed by 10 and 100 Myr. It is unlikely that these old ages are valid. For instance, the lifetimes of molecular clouds are too short ( Myr, Hartmann, Ballesteros-Paredes, & Bergin, 2001) for the Chamaeleon I clouds to have undergone star formation across such an extended period of time. In addition, objects with ages of 10-100 Myr would have dispersed from the cloud long ago. Instead, the old isochronal ages are probably a reflection of errors in the adopted temperature scale and/or the evolutionary models. If the models are valid, then the temperature scale for young objects at M9-L0 must be much cooler than the adopted one, which is already cooler than the scale measured for field dwarfs (Kirkpatrick, 2005). Significant errors are probably present in both the temperature scale, which is unconstrained at the latest types, and the predicted effective temperatures, which are sensitive to various details of the models, such as the treatment of convection (Baraffe et al., 2002). Compared to effective temperature, bolometric luminosity appears to be less sensitive to model uncertainties, at least for ages of Myr (Baraffe et al., 2002), and is easier to measure. Therefore, we have chosen to estimate the mass of Cha 11077626 from its luminosity. If we assume that it has an age in the range of values exhibited by the stellar members of Chamaeleon I (-6 Myr, Luhman, 2007), then we arrive at a mass of 0.004-0.01 for Cha 11077626 based on the luminosities predicted by Burrows et al. (1997) and Chabrier et al. (2000). Zapatero Osorio et al. (2007) and Scholz & Jayawardhana (2007) have reported detections of disks for brown dwarfs at comparable masses in the Ori cluster using IRAC data. However, because of the very large uncertainties in the 5.8 and 8.0 µm photometry in those studies (0.3-0.5 mag), their detections of excess emission have low significance. Thus, Cha 11077626 is the least massive brown dwarf that has definitive evidence for a circumstellar disk.
3.2.4 New Members in Infrared Sample
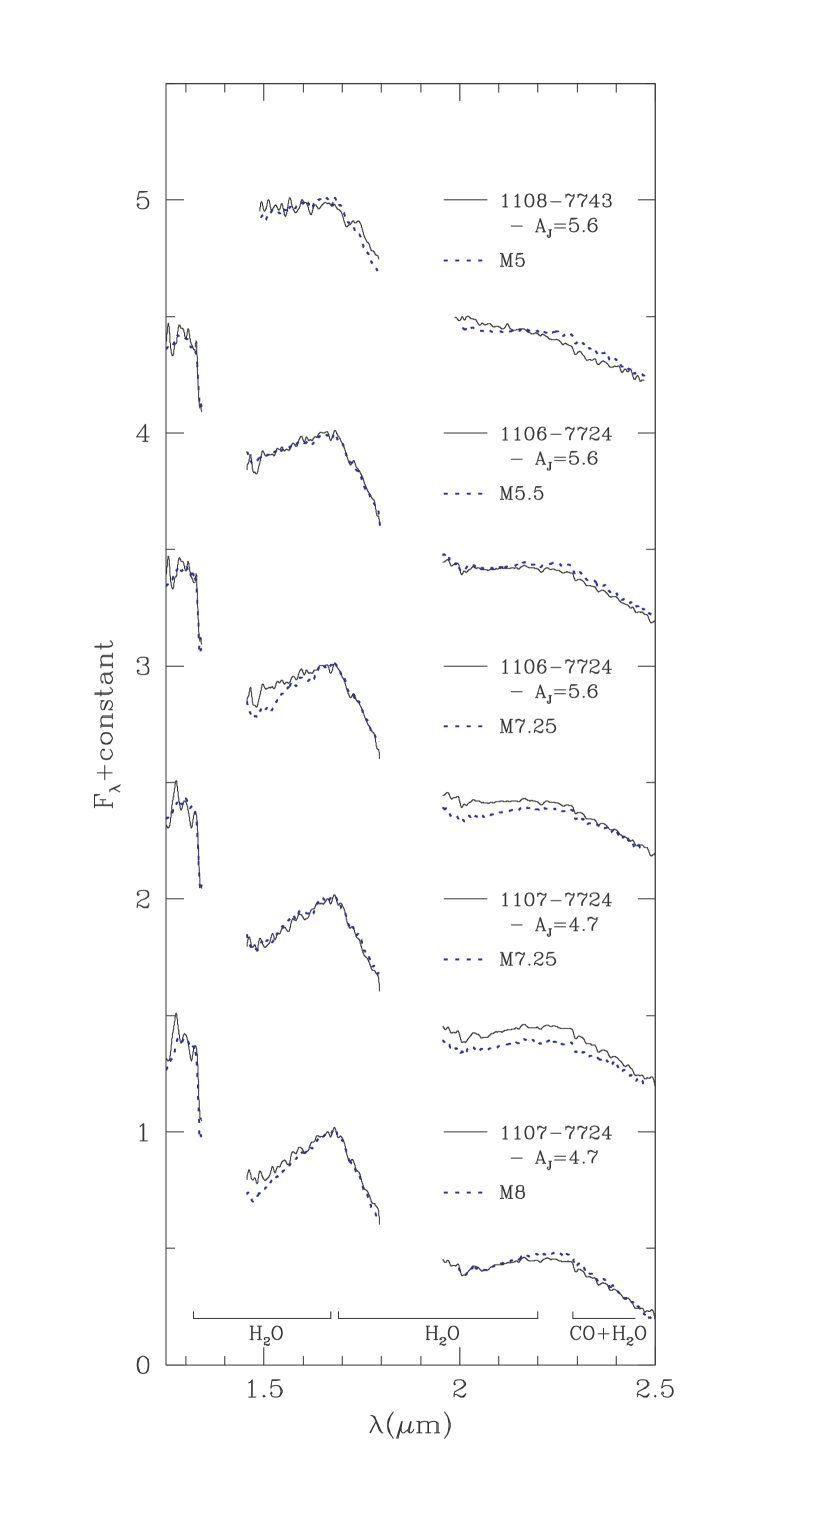
In the GNIRS sample, the three candidates that show evidence of membership in Chamaeleon I are 2MASS J110842967743500, 2MASS J110629427724586, and 2MASS J110703697724307 (hereafter 2M 11087743, 2M 11067724, 2M 11077724). The near-IR spectra of these objects exhibit strong H2O absorption bands, which indicates that they are low-mass stars or brown dwarfs rather than galaxies. High levels of reddening in their spectra demonstrate that they are not field stars in the foreground of the cluster and they are too bright to be background field dwarfs. We also detect emission in H2 1-0 S(1) at 2.12 µm in 2M 11087743, which is a signature of very young stars. Finally, the spectral features that are sensitive to surface gravity in our data, such as the shape of the - and -band continua (Lucas et al., 2001; Luhman et al., 2004; Kirkpatrick et al., 2006), are inconsistent with field dwarfs and giants. Instead, the spectra of 2M 11087743, 2M 11067724, and 2M 11077724 agree well with known cluster members observed with GNIRS in terms of the gravity-sensitive features. Based on these properties and the presence of mid-IR excess emission, we classify these sources as members of Chamaeleon I.
To measure the spectral types of 2M 11087743, 2M 11067724, and 2M 11077724, we have compared their H2O and atomic absorption features to those of the optically-classified members of Chamaeleon I that we observed with GNIRS. To facilitate this comparison, we dereddened the spectra of the new members to give them the same slopes as the known members. We also smoothed the spectra to a low resolution when comparing the broad H2O absorption bands. The dereddened, smoothed versions of the spectra are shown in Figure 6. Each object is compared to the young standards that provide the closest match to the strength of the H2O absorption. Through this comparison and a similar analysis of the atomic absorption lines, we classify 2M 11087743, 2M 11067724, and 2M 11077724 as M41, M61, and M7.51, respectively. These spectral types correspond to masses of , 0.1, and 0.04 , respectively, according to the theoretical evolution models of Baraffe et al. (1998) and Chabrier et al. (2000) and the temperature scale of Luhman et al. (2003) for ages of a few Myr.
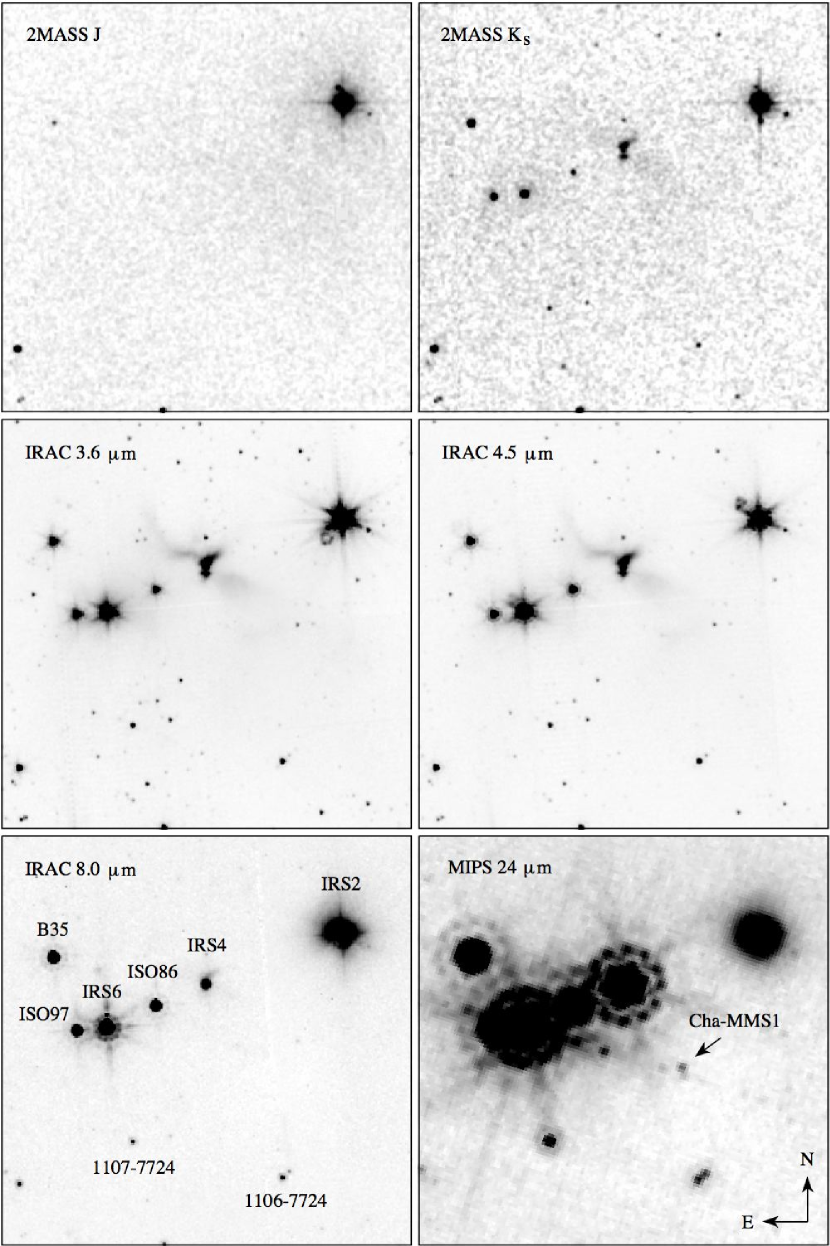
The process of dereddening the near-IR spectra of 2M 11087743, 2M 11067724, and 2M 11077724 to match the young standards, which have little if any extinction (Luhman, 2007), produces extinction estimates of , 5.6, and 4.7, respectively. It is not surprising that these objects are highly obscured given their locations. 2M 11087743 is only from the protostar IRN while the other two sources are within the group of embedded stars near Cederblad 110. Spitzer and 2MASS images of 2M 11067724, 2M 11077724, and the protostars in Cederblad 110 are shown in Figure 7. Based on their high levels of extinction and their close proximity to known protostars, 2M 11087743, 2M 11067724, and 2M 11077724 may be the youngest known low-mass members of the cluster. By combining our extinction estimates for these sources with their and magnitudes, the appropriate bolometric corrections, and the distance of Chamaeleon I, we arrive at luminosities of 0.053, 0.035, and 0.020 , respectively. Because the - and -band spectra for these sources do not show any evidence of continuum veiling, these luminosity estimates should be uncontaminated by disk emission.
The spectral types, extinctions, luminosities, membership evidence, and near-IR photometry for the four new members of Chamaeleon I are provided in Table 4. The IRAC and MIPS photometry for these sources are presented in the tabulation of Spitzer data for all known members of the cluster in § 4.1. The IRAC and MIPS measurements for the 13 nonmembers are listed in Table 5.
3.3. Remaining Candidates
In the previous section, we obtained spectra for a small sample of the candidate disk-bearing members of Chamaeleon I that were identified in § 3.1 with Figure 3. To investigate the nature of the remaining candidates, we compare them to the known cluster members in Spitzer color-magnitude and color-color diagrams in Figure 8. Many of the candidates are as red as the reddest known members, indicating that they are protostellar if they are members. In addition, bona fide members are likely to be brown dwarfs given that nearly all of the candidates are fainter than the stellar members of the cluster, although stars with edge-on disks can also appear very faint. For instance, Cha J110819387731522 has a stellar mass according to its spectral type, but it is the faintest and reddest known member in [3.6] and , respectively, which is explained by the presence of an edge-on disk (Luhman, 2007). However, rather than brown dwarfs or stars with edge-on disks, the vast majority of the candidates are probably galaxies.
We can refine our sample of candidate members and remove some of the galaxy contaminants by applying additional criteria. The initial sample of candidates was defined by colors of and . However, the sources with and within that sample have colors that differ significantly from those of all known members of Chamaeleon I, as shown in Figure 3. These objects can be rejected as likely galaxies. Because galaxy contamination increases with fainter magnitudes, brighter candidates are less likely to be galaxies. The probability of membership is also higher for candidates that are close to known members of Chamaeleon I. By applying these criteria, we have identified the most promising candidate disk-bearing members, which are listed in Table 6. The brightest candidate, 2MASS J110853677521359, is probably a solar-mass star if it is associated with Chamaeleon I. The magnitudes of the remaining candidates are indicative of brown dwarfs. As noted in Table 6, some of the candidates may be class I sources or companions to known members. The new member 2M 11067724 and the candidate Cha J110627887724543 could comprise the youngest low-mass binary system discovered to date.
In addition to revealing new candidate members of Chamaeleon I, our mid-IR measurements provide constraints on the membership of sources that have been previously cited as possible members. In a census of Chamaeleon I, Luhman (2004a) assigned membership to a few objects that lacked spectroscopic classification but that exhibited mid-IR excess emission. One of these objects is ISO 13 (Nordh et al., 1996; Persi et al., 2000). The near-IR counterpart for ISO 13 was not positively identified in previous studies because of uncertainties in the coordinates measured with ISO. Based on a comparison of the photometry from ISO to measurements from IRAC for sources in the vicinity of the ISO coordinates, we conclude that ISO 13 corresponds to 2MASS J110255797724304. For this source, we measure magnitudes of 13.87, 13.68, 12.68, 9.87, and 6.54 at 3.6, 4.5, 5.8, 8.0, and 24 µm, respectively. When we combine these data with photometry from the Two-Micron All-Sky Survey (2MASS, Skrutskie et al., 2006), we find that the colors of ISO 13 are relatively blue at 1-5 µm but become very red at 8 and 24 µm. These colors are inconsistent with those of known members of Chamaeleon I, as illustrated by the position of ISO 13 in the IRAC color-color diagram in Figure 3. Therefore, we remove ISO 13 from our list of members of Chamaeleon I because it is probably a galaxy. Luhman (2004a) included ISO 206 in a list of candidate members based on an apparent excess at 6.7 µm in photometry from ISO. However, mid-IR excess emission is not present in the IRAC data for this source. As a result, there is no longer any reason to consider ISO 206 as a possible member. Finally, Persi et al. (2001) identified three candidate class I brown dwarfs in the vicinity of Cederblad 110 through the presence of near-IR excess emission. In our IRAC data, we find that one of these candidates, NIR72, is a patch of nebulosity rather than a stellar source while the other two objects, NIR84 and NIR89, do not exhibit excess emission, and thus are not class I sources.
3.4. Completeness for Members with Disks
We now use our mid-IR data to examine the completeness of the current census of disk-bearing members of Chamaeleon I. We consider only the areas that have been imaged in all four bands of IRAC, which encompass 170 of the 229 known members of the cluster. Within these areas, 156 members have photometric errors less than 0.1 mag in all IRAC bands, while the remaining 14 known members lack accurate photometry in at least one band because they are saturated, extended, too close to a brighter star, or below the detection limit of all four bands (Cha-MMS1). Thus, the photometric criteria that we used for selecting candidate members with disks in § 3.1 recover all known members with disks in the areas with 4-band coverage with the exception of the brightest stars, faint companions, and the youngest protostars. As a result, our sample of candidates should be complete for disk-bearing members in the same range of magnitudes and extinctions exhibited by the known stellar population. To quantify the completeness limits of this candidate sample, we have plotted the photometric completeness limits at 8 µm for the shortest and longest exposures in the color-magnitude diagram in Figure 8 (§ 2.2). Meanwhile, to evaluate the completeness of the current census of confirmed members with disks, we consider the remaining candidates that lack spectroscopy. As shown in Figure 8, only one candidate is present in the magnitude range of young stars in Chamaeleon I (), which is in Table 6. Thus, the current census is nearly complete for stars with disks in the fields imaged by all four bands of IRAC, which encompass most of the Chamaeleon I cloud (Figure 1). Our survey is not complete for brown dwarfs with disks, as indicated by the large number of candidates lacking spectroscopy in Figure 8. However, based on optical and near-IR surveys, the census of substellar cluster members (both with and without disks) is complete for specific fields and ranges of mass and extinction that are described by Luhman (2007).
4. Global Properties of Disk Population
4.1. Spitzer Photometry for Known Members
We wish to use our mid-IR photometry from Spitzer to investigate the properties of the disk population in Chamaeleon I. To do this, we begin by presenting a tabulation of these measurements for all known members of the cluster. The latest census of Chamaeleon I from Luhman (2007) contained 226 sources. ISO 13 was considered a cluster member in that study, but we now classify it is as a probable galaxy (§ 3.3). The census from Luhman (2007) did not include protostellar sources that have been detected only at far-IR wavelengths and longward, such as Cha-MMS1 (Reipurth et al., 1996). Because this source is detected in our 24 µm data (see Figure 7)111The detection of Cha-MMS1 in the 24 µm data was previously reported by Belloche et al. (2006)., we include it in the list of members considered in this work. Eight young stars from Covino et al. (1997) are within the area in which we have reduced nearly all available IRAC and MIPS data, which has a radius of centered at , (J2000). Three of these stars, RX J1108.87519A and B and RX J1129.27546, have proper motions that are similar to those of known members of Chamaeleon I, while the other five stars are probably members of the Cha association according to their proper motions (see Appendix). We also find that four of the young stars from Luhman (2007) have proper motions that favor membership in Cha rather than Chamaeleon I. Therefore, we deduct ISO 13 and these four stars from the census of Luhman (2007) and add Cha-MMS1, RX J1108.87519A and B, and RX J1129.27546. When we include the four new members that we have discovered (§ 3), we arrive at census of Chamaeleon I that contains 229 sources.
The IRAC images encompass 198 of the 229 known members, all of which are detected in at least one IRAC band, except for the protostar Cha-MMS1 and six objects that are unresolved from brighter stars (ESO H 281, 2MASS J110119267732383B, 2MASS J110720227738111, CHXR 73B, T39B, T33B). The MIPS 24 µm images contain 199 members, 152 of which are detected. Among the MIPS detections, seven stars are saturated and one source, T41, is not measured because it is extended. Thus, we have measured IRAC and MIPS photometry for 191 and 144 known members, respectively. These data are presented in Table 7. Nondetections at 24 µm are indicated for members with IRAC measurements. Sources that lack measurements in both IRAC and MIPS are not included in Table 7, which consist of six unresolved companions (2MASS J110119267732383B, 2MASS J110720227738111, CHXR 73B, T39B, T33B, CHXR 68B), one member not detected by MIPS and outside of IRAC (2MASS J111558277729046), and 19 members outside of both the IRAC and MIPS images. ESO H 281 is unresolved from a brighter background star in 2MASS (Luhman, 2007) but is comparable to the latter at 8 µm and is the dominant source at 24 µm. Thus, we were able to measure photometry for ESO H 281 at 24 µm but not in the IRAC bands.
As mentioned in § 1, previous studies have measured photometry for members of Chamaeleon I from the Spitzer images considered in this work. Luhman et al. (2005a, b, c) reported IRAC photometry for known members with spectral types later than M6. Those measurements are now superseded by the ones in Table 7, which were performed with newer versions of the image processing software described in § 2.2. More recently, Damjanov et al. (2007) measured IRAC photometry for 81 members from the images for AORs 3960320 and 3651328 and MIPS 24 µm photometry for 59 members from the images for AORs 3661312 and 3962112. To compare the IRAC photometry from Damjanov et al. (2007) to our measurements from the same images, we plot the differences of the IRAC magnitudes from the two studies as a function of magnitude in Figure 9. The two sets of photometry differ by more than 0.1 mag in many cases, particularly at fainter levels and at 5.8 µm. Most of these differences are within the errors quoted by Damjanov et al. (2007), but those errors are much larger than the ones that we estimate for our photometry. We find errors of only a few percent for all of our measurements in Figure 9, while the errors from Damjanov et al. (2007) are as large as %. To illustrate the relative accuracies of these measurements without making use of the quoted errors, we compare the IRAC color-color diagrams that are produced by the two studies in Figure 10. Our colors form two distinct groups, a tight cluster near the origin and a broader distribution of significantly redder colors, which are indicative of stellar photospheres and stars with disks, respectively. In comparison, the colors from Damjanov et al. (2007) exhibit a much larger scatter and extend to significantly negative colors, which are unphysical for the spectral types in question. Thus, according to both this comparison and the formal error estimates, our measurements have significantly higher accuracies than those from Damjanov et al. (2007).
4.2. SED Classifications
To classify the IR spectral energy distributions (SEDs) of the members of Chamaeleon I, we use the spectral slope defined as log log (Lada & Wilking, 1984; Adams et al., 1987). This slope is normally measured between µm and 10-20 µm. We have measured photometry at 8 and 24 µm for 182 and 144 members, respectively. At least one of these bands is available for 197 members. At short wavelengths, data at 3.6 µm are available for 164 members. Slopes from 3.6 µm to 8 or 24 µm can be computed for 160 members. Photometry at (2.2 µm) is also useful as a short-wavelength band for spectral slopes since it has been measured for all known members (2MASS; Luhman, 2007). Therefore, to provide a spectral slope for as many members as possible, we have computed slopes between four pairs of bands, 2.2-8, 2.2-24, 3.6-8, and 3.6-24 µm. We have dereddened these slopes using the extinctions from Luhman (2007) and the reddening law from Flaherty et al. (2007), except for 10 members that lack spectral types and extinction estimates. As in § 3.1, we have adopted the average measurement in a given band if an object has been observed at multiple epochs. The resulting values of , , , and are listed in Table 8 for the 196 known members of Chamaeleon I that have photometry at 8 or 24 µm and at shorter wavelengths (i.e., excluding Cha-MMS1).
The distributions of spectral slopes from Table 8 are shown in Figure 11. Like the colors in Figure 3, the slopes form two distinct populations that are well-separated from each other. The narrow group of bluer objects corresponds to stellar photospheres while the broader distribution of redder sources represents stars with disks. We investigate these data in greater detail by plotting the slopes as a function of spectral type in Figure 12. The widths of the photospheric sequences for and increase at later spectral types because of the larger photometric errors at 24 µm for cooler, fainter objects. Most photospheres later than M6 are below the detection limit at 24 µm. Because of the close proximity and low background of Chamaeleon I, this detection limit of M6 for stellar photospheres is significantly cooler than the limits typically achieved in MIPS 24 µm surveys of other star-forming regions. In the two slopes based on 8 µm, the separations between the two populations are smaller than in and , but the photospheric sequences are also tighter because of the higher photometric accuracies at 8 µm relative to 24 µm. The distributions of dereddened slopes in Figure 12 are nearly identical to the distributions of observed values except that the sequences of stellar photospheres are slightly tighter after dereddening.
In Figure 12, and are approximately constant for stellar photospheres with types of B through K, but they change noticeably at later spectral types. As a result, we should not use fixed thresholds in and for identifying stars with disks. Instead, our adopted thresholds are fits to the photospheric sequences that have been offset by 0.3 so that they are significantly greater than the scatter in each sequence. A constant threshold of is sufficient for identifying stars with disks for both and , as shown in Figure 12. Following the standard classification scheme for SEDs of young stars (Lada, 1987; Greene et al., 1994), we classify stars with slopes below the thresholds in Figure 12 as class III while redder stars with , , and are designated as class II, flat-spectrum, and class I, respectively. We cannot classify Cha-MMS1 with our data because it is not detected at wavelengths shorter than 24 µm, but it is probably in the class 0 stage or an earlier, prestellar phase (Reipurth et al., 1996; Lehtinen et al., 2001; Belloche et al., 2006).
The SED classifications produced by , , , and disagree for a small number of sources. The classes from three of the four slopes agree for T14A, C1-2, Ced 110-IRS4, ISO 97, ISO 217, ISO 237, Hn10E, C1-25, and Cha H 1. For each of these stars, we assign the classification from the three slopes that agree. ISO 86 and Ced 110-IRS6 are class I by and and are class II by and . We adopt the latter classification for these stars because of the possibility of variability during the time between the and Spitzer observations. For the same reason, we adopt the classification from over the one from for T29. Because the 8 µm slopes of CHSM 15991 indicate a flat-spectrum class while the 24 µm slopes are only slightly below the flat/II threshold, we adopt the former classification for this star. The SEDs of T11, CHXR 22E, and CHXR 71 are consistent with stellar photospheres at µm but are much redder at 24 µm. SEDs of this kind are indicative of disks with inner holes, which are also known as transitional disks (Calvet et al., 2002, 2005; D’Alessio et al., 2005; Espaillat et al., 2007a, b; Furlan et al., 2007). CHXR 76 may have a transitional disk as well, although the size of the 24 µm excess is small and the star is slightly below the adopted II/III thresholds for and . We classify these four stars as class II rather than class III since they exhibit disk emission at 24 µm. The SEDs of Cha J110819387731522 and ESO H 569 also become more steeply rising at longer wavelengths. For these stars, the data at 8 and 24 µm indicate classes II and I, respectively. Both Cha J110819387731522 and ESO H 569 show evidence of edge-on disks (Luhman, 2007), which is consistent with the distinctive shapes of their SEDs. Thus, we conclude that they are probably edge-on class II systems. Hn 21E and the new member near IRN, 2M J11087743, have different classifications according to and . For these two stars, we assign the classifications from because the 3.6 and 8 µm data were measured with the same apertures and at the same time. Both stars are too close to brighter stars for useful constraints on their 24 µm fluxes. Our final SED classifications are provided in Table 8.
Finally, we examine the SEDs of the seven known members of Chamaeleon I that are within the Spitzer images but have not been classified with the spectral slopes in Figure 12 because they lack photometry at 8 and 24 µm. These measurements are unavailable because the stars are outside of the images, below the detection limits, saturated, or extended, as indicated in Table 7 for T6, T27, T41, CHXR 54, 2MASS J111122497745427, and 2MASS J110806097739406. The seventh member, 2MASS J111558277729046, is outside of the IRAC images and is not detected by MIPS, and thus is not present in Table 7. The absence of a detection at 24 µm is sufficient to demonstrate that this star is class III. To classify the other six objects, we measured spectral slopes from and the available IRAC data and applied thresholds similar to those developed in Figure 12. We find that T6, T27, and 2MASS J111122497745427 are class II and T41, CHXR 54, and 2MASS J110806097739406 are class III.
Table 9 summarizes the SED classifications for the known members of Chamaeleon I that are within the Spitzer images, with the exception of the protostar Cha-MMS1.
4.3. Disk Fraction
We can use our SED classifications to measure the fraction of stars and brown dwarfs in Chamaeleon I that harbor circumstellar disks. For the disk fraction to be meaningful, it must be measured from a sample of cluster members that is unbiased in terms of disks. Although some of the early studies of Chamaeleon I identified members by signatures related to disks, recent surveys at X-ray, optical, and near-IR wavelengths have been sensitive to both class II and class III sources (Feigelson & Lawson, 2004; Stelzer et al., 2004; Luhman, 2007). The resulting census is unbiased in terms of SED class for most of the cloud (Luhman, 2007). The major exception is at high extinctions, where class I and II stars are readily found through mid-IR excesses (such as three of the new members in this work) while their class III counterparts are much more difficult to identify. However, in a cloud like Chamaeleon I that has relatively low extinction (), any members that are highly embedded () are probably very young stars in their parent cores, and thus are likely to have disks. In other words, it is unlikely that Chamaeleon I contains a significant number of heavily obscured class III stars. This conclusion is supported by the X-ray surveys of Feigelson & Lawson (2004) and Stelzer et al. (2004), which were capable of detecting sources of this kind. Therefore, we include all known members of Chamaeleon I in our disk fraction measurement with the exception of the new substellar member Cha 11077626 and the protostar Cha-MMS1. The former is excluded because it was found through its disk emission, but it is not within the detection limits of previous unbiased surveys. As for Cha-MMS1, sources that are less evolved than class I are generally not included in disk fraction measurements.
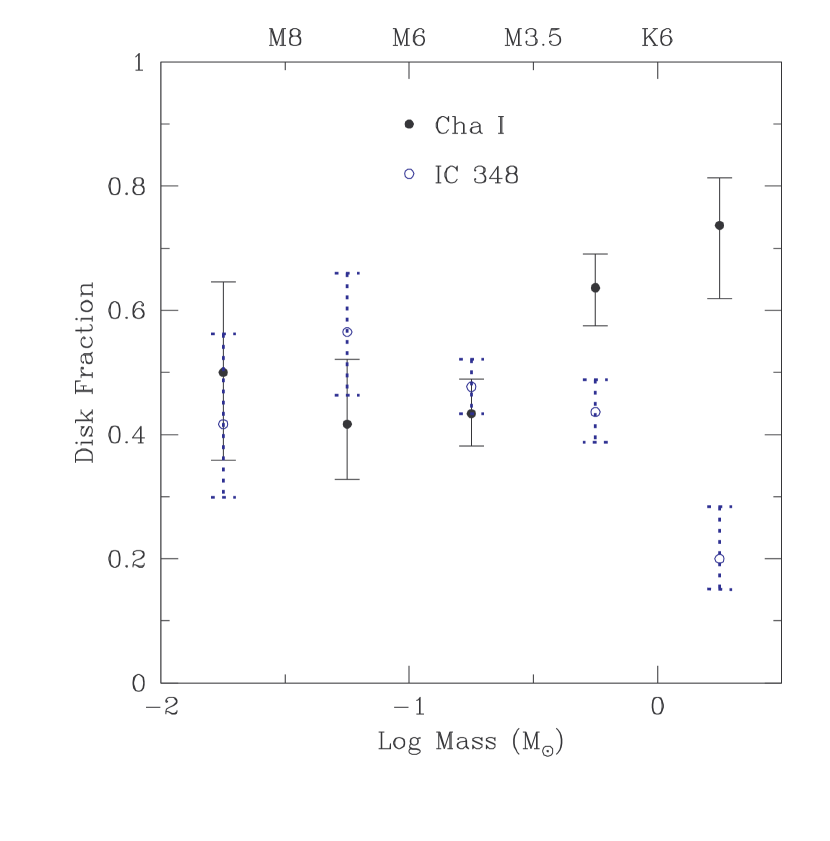
We have computed the fraction of members that are class I or class II as a function of spectral type, which is a good proxy for stellar mass. We selected the boundaries of the spectral type bins to correspond approximately to intervals of 0.5 in the logarithm of mass based on the temperature scale of Luhman et al. (2003) and the evolutionary models of Baraffe et al. (1998) and Chabrier et al. (2000). For members that lack spectral classifications, we estimate masses and spectral types by combining their photometry, the evolutionary models, and an assumed age of 2 Myr, which should be sufficiently accurate for identifying the bins in which they belong. To compare the disk fractions of Chamaeleon I and the young cluster IC 348, we have applied our SED classification criteria to the IRAC data for IC 348 from Lada et al. (2006). The resulting disk fractions as a function of mass for Chamaeleon I and IC 348 are listed in Table 10 and are plotted in Figure 13.
Through an earlier analysis of a subset of the Spitzer images, Luhman et al. (2005b) found that low-mass stars and brown dwarfs in Chamaeleon I exhibit similar disk fractions. We arrive at the same result with our expanded set of images. Other young clusters like IC 348 and Ori also have disk fractions that are roughly unchanged from low-mass stars to brown dwarfs (Luhman et al., 2005b; Hernández et al., 2007; Caballero et al., 2007). As shown in Figure 13, the disk fractions at low masses in Chamaeleon I and IC 348 have similar values. However, the disk fractions of the two clusters diverge significantly above . This difference is particularly striking since similar ages have been reported for the two clusters (Luhman et al., 2003; Luhman, 2007). To compare their ages in detail, we have estimated the ages of members of Chamaeleon I and IC 348 between 0.1 and 1 by combining the temperatures and luminosities from Luhman et al. (2003) and Luhman (2007) with the evolutionary models of Baraffe et al. (1998). The resulting distributions of isochronal ages are indistinguishable, as shown in Figure 14. Thus, the relative disk fractions indicate that the typical lifetime of disks around solar-mass stars is shorter in IC 348 than in Chamaeleon I. The higher stellar density of IC 348 relative to Chamaeleon I is the only obvious potential source of this difference in disk lifetimes. The low-mass stars in IC 348 are segregated toward the outer regions of the cluster where the density is lower (Muench et al., 2003), which might explain why their disk fraction is similar to that of low-mass stars in Chamaeleon I. Several clusters and associations that are slightly older than IC 348 and Chamaeleon I, such as Upper Sco, NGC 2362, and Ori ( Myr), exhibit disk fractions that decrease at higher stellar masses in the same manner observed for IC 348 (Carpenter et al., 2006; Dahm & Hillenbrand, 2007; Hernández et al., 2007), which suggests that more massive stars have shorter disk lifetimes than low-mass stars in most clusters. The solar-mass stars in Chamaeleon I must have unusually long disk lifetimes, or their disks must be on the verge of rapidly dissipating.
4.4. Spatial Distributions of SED Classes
In the previous section, we investigated the dependence of the disk fraction in Chamaeleon I on stellar mass. We now consider the spatial distribution of disk-bearing stars, which may provide additional insight into disk evolution.
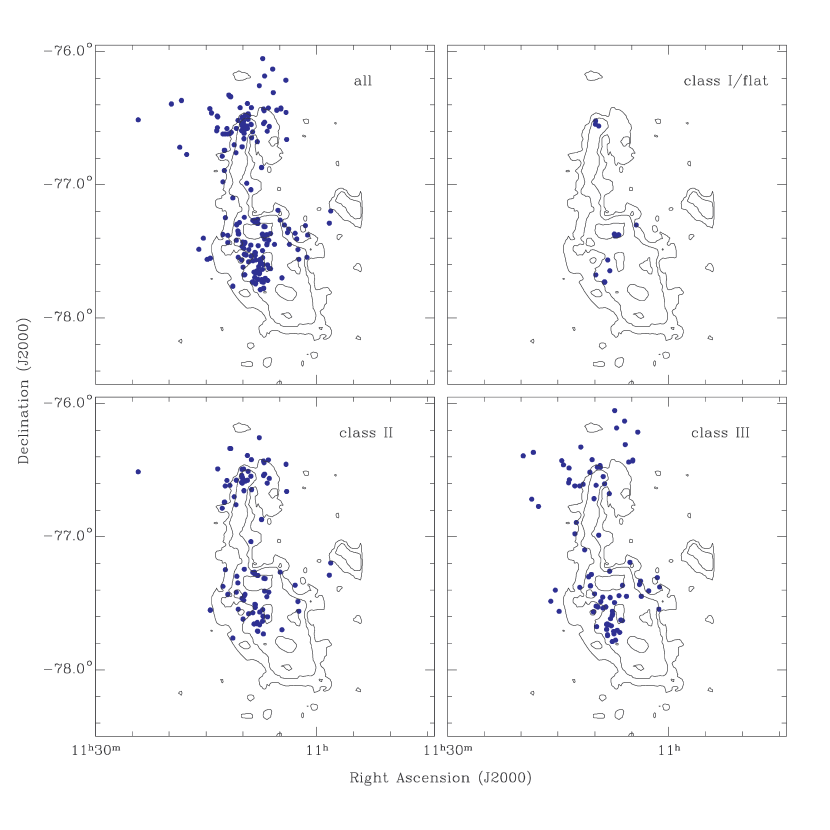
As shown in Table 9, the southern subcluster exhibits a slightly higher disk fraction and contains more class I and flat-spectrum sources than the northern subcluster, which suggests that the southern population is slightly less evolved. A small age difference of this kind is also implied by the H-R diagrams of the two subclusters and the relative levels of extinction (Luhman, 2007). The spatial distributions of the members of Chamaeleon I within the Spitzer images are compared in the maps in Figure 15 according to their SED classes. Because the protostellar population of Chamaeleon I is smaller than ones in younger and richer star-forming regions, the distribution of class I and flat-spectrum sources in Figure 15 is not particularly informative. We simply find that they are highly clustered and are concentrated near dense molecular gas, which are typical properties of class I objects in embedded clusters (Hartmann, 2002; Lada et al., 2000, 2004; Teixeira et al., 2006; Muench et al., 2007; Allen et al., 2007; Gutermuth et al., 2007; Winston et al., 2007).
The large samples of class II and III members are more amenable to a detailed comparison than the class I and flat-spectrum objects. In Figure 15, we find that the distributions of these two classes are indistinguishable in the southern subcluster, but differ significantly in the northern one. In comparison, Damjanov et al. (2007) concluded that stars with disks share the same distribution as diskless stars in both subclusters. They did not detect the difference in the distributions of classes II and III in the northern subcluster because their sample of members was three times smaller and was less complete for class III objects than the one we are considering. The wider class III distribution in the north can be explained as a combination of the segregation of northern low-mass stars to larger radii (Luhman, 2007) and the lower disk fraction of low-mass stars relative to solar-type stars (Figure 13).
4.5. Transitional Disks
As mentioned in § 4.2, transitional disks are characterized by the presence of large inner holes and gaps. These disks are noteworthy because their holes may represent evidence of forming giant planets. A transitional disk is identified through the shape of its SED, which exhibits photospheric colors at shorter IR wavelengths followed by a sudden onset of excess emission from the disk at longer wavelengths. In § 4.2, we classified T11, CHXR 22E, CHXR 71, and possibly CHXR 76 as transitional disks because their spectral slopes showed excess emission at 24 µm but not at µm. The distinctive SEDs of these stars are also illustrated in the color-color diagram in Figure 8, where they have colors of and . The transitional disk for T11 (also known as CS Cha) has already been studied in detail through mid-IR spectroscopy with Spitzer (Espaillat et al., 2007a). Meanwhile, a few other cluster members, such as C7-1 and T35, exhibit excess emission at both 8 and 24 µm, but the excess is smaller at 8 µm. In other words, the spectral slopes ending at 8 µm are bluer than the ones ending at 24 µm. These stars may possess transitional disks, as previously noted by Damjanov et al. (2007). Edge-on disks also produce redder slopes at longer wavelengths, as in Cha J110819387731522 and ESO H 569 (§ 4.2). However, unlike a transitional disk, an edge-on disk makes the star appear much fainter at optical and near-IR wavelengths than unocculted stars at the same spectral type, which is not the case for stars discussed in this section.
4.6. Disk Variability
Our Spitzer survey has produced high-precision mid-IR photometry at multiple epochs for a large fraction of a young stellar population. As a result, we have a rare opportunity to characterize the variability of young stars and brown dwarfs at mid-IR wavelengths.
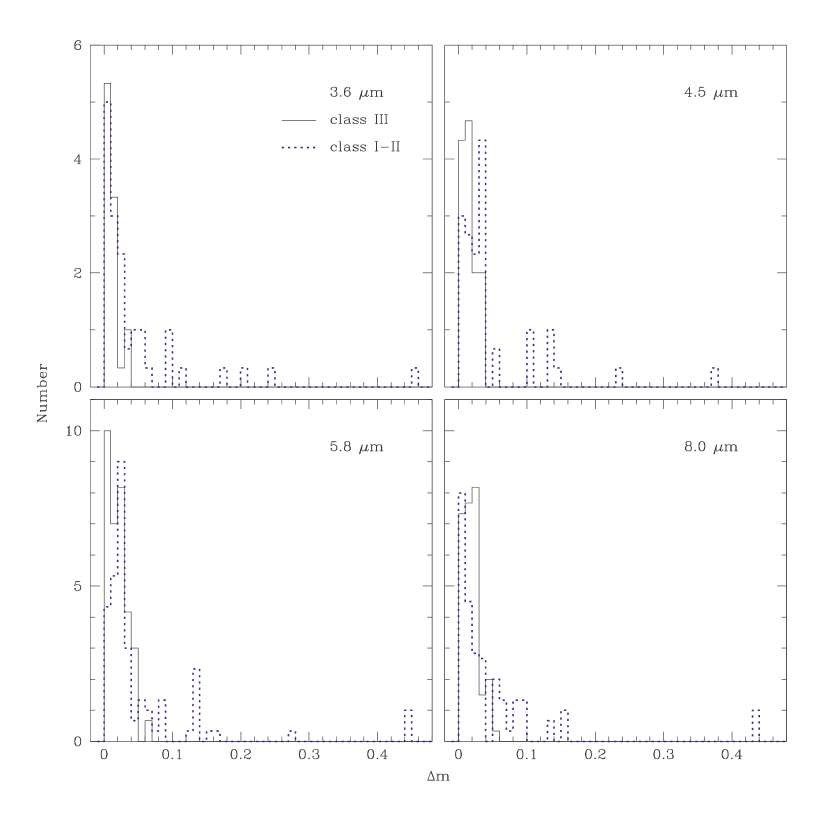
We have measured photometry at multiple epochs for 27, 30, 70, and 61 members at 3.6, 4.5, 5.8, and 8.0 µm, respectively. The errors are less than 0.06 mag for 26, 29, 64, and 54 members, respectively. Fewer members have multiple measurements at shorter wavelengths because the saturation limit is fainter at 3.6 and 4.5 µm. To quantify the variability of these data, we have computed the difference between each magnitude and the average magnitude for a given object and wavelength. We then constructed histograms of these magnitude differences, which are weighted by the inverse of the number of measurements so that all members contribute equally to the distribution. In Figure 16, the resulting histograms are shown separately for each IRAC band and for stars with and without disks. In all four bands, nearly all sources with mag have disks, which indicates that disks are responsible for these large photometric variations, either directly through fluctuations in the disk emission or indirectly through the effect of the disk on the emergent flux from the stellar photosphere. Based on Figure 16, the frequency of large photometric variations appears to be similar among the four IRAC bands. A comparison of this kind between diskless and disk-bearing stars at 24 µm is problematic because of the larger photometric errors, particularly for the fainter class III sources.
5. Conclusions
We have performed a thorough census of the circumstellar disk population of the Chamaeleon I star-forming region using mid-IR images obtained with the Spitzer Space Telescope. After analyzing most of the images that have been collected in Chamaeleon I with IRAC (3.6-8 µm) and MIPS (24 µm) onboard Spitzer, we have searched for new disk-bearing members of the cluster by identifying sources with red colors in these data. Through spectroscopy of a small sample of the resulting candidates, we have confirmed the membership of four objects, which we classify as M4, M6, M7.5, and L0. The first three sources are located in highly embedded areas () near known protostars, indicating that they may be among the youngest low-mass members of the cluster. The L0 source is the coolest known member of Chamaeleon I and has a mass of 0.004-0.01 according to the luminosities predicted by theoretical evolutionary models (Burrows et al., 1997; Chabrier et al., 2000), making it the least massive brown dwarf for which a disk has been reliably detected. With the exception of stars with edge-on disks, our survey demonstrates that the current census of disk-bearing members of Chamaeleon I is complete at stellar masses for areas covered by all four bands of IRAC, which encompass most of the cloud. At faint magnitudes that correspond to substellar cluster members, the Spitzer images detect hundreds of red sources. Most of these objects are probably galaxies, but we have identified a sample of the most promising candidate members, which include possible low-mass companions and protostellar sources.
We have presented a tabulation of IRAC and MIPS photometry for 191 and 144 known members of Chamaeleon I, respectively. We have used these data to classify the SEDs of the 203 members that are encompassed by the IRAC and MIPS images and that are detected by IRAC (i.e., excluding the protostar Cha-MMS1), arriving at 4, 10, 94, and 95 members that are class I, flat spectrum, class II, and class III, respectively. The disk fraction (I+flat+II/I+flat+II+III) is roughly constant at % from 0.01 to 0.3 , which closely resembles measurements in IC 348. The disk fraction in Chamaeleon I increases with higher stellar masses to a value of % at 1-2 , whereas disks in IC 348 are much less common in this mass range (%). Because the two clusters have the same age, this comparison indicates that solar-type stars in Chamaeleon I have longer disk lifetimes than their counterparts in IC 348. The high stellar density of the more massive stars in IC 348 may have contributed to their shorter disk lifetimes. We have also examined the spatial distribution of disk-bearing members of Chamaeleon I. The distributions of classes II and III are similar in the southern subcluster, while the class III sources have a wider distribution in the northern one. We interpret the relative distributions in the north as a reflection of the segregation of low-mass stars to larger radii in the northern subcluster (Luhman, 2007) combined with the lower disk fraction of low-mass stars relative to members at higher masses. Finally, we have identified possible transitional disks around several cluster members, and have used our multi-epoch measurements to demonstrate that stars with disks exhibit greater mid-IR variability than diskless stars.
Appendix A Membership of Young Stars Surrounding the Chamaeleon I Cloud
Frink et al. (1998) demonstrated that the stars in the vicinity of Chamaeleon I consist of two kinematic subgroups: a rich group of young stars associated with the Chamaeleon I cloud, and a more dispersed, older group with larger motion. The latter has been referred to as the Cha group (Mamajek et al., 2000) because it is centered on Cha and the Herbig Ae star HD 104237. The group appears to have an age of Myr and a distance of pc (Feigelson et al., 2003; Luhman, 2004b). Proper motions with accuracies of 5 mas/yr (e.g., UCAC2) are sufficient for distinguishing between the two populations. Therefore, to clarify the membership status of the young stars at distances of -3 from the center of the Chamaeleon I cloud (Covino et al., 1997; Luhman, 2007), we compare their proper motions to those of Chamaeleon I and the Cha group.
The median proper motion for the 61 of the 226 sources in the census of Chamaeleon I from Luhman (2007) that have UCAC2 proper motions (Zacharias et al., 2004) is , +2 mas/yr. The median proper motion of the members of the Cha group proposed by Mamajek et al. (2000) and Zuckerman & Song (2004) is , 7 mas/yr. The uncertainties in these median proper motions are at the level of 1 mas/yr. We first consider the eight young stars from Covino et al. (1997) that are within from Chamaeleon I. The UCAC2 proper motions of RX J1108.87519A and B and RX J1129.27546 are consistent with membership in Chamaeleon I. Mamajek et al. (2000) classified RX J1158.57754A (= DW Cha) as a member of the Cha group, and we assume that its companion (for which a reliable proper motion is not available) is a member of that group as well. RX J1150.47704 was classified as a “Cha-Near” member by Zuckerman & Song (2004, “Cha-Near” is ostensibly the same as the Cha group), and the UCAC2 proper motion corroborates membership in the Cha group. The UCAC2 proper motion for RX J1149.87850 (= DZ Cha) also indicates membership in Cha rather than Chamaeleon I. For the final star from Covino et al. (1997), RX J1123.27924, the proper motion from Ducourant et al. (2006) is inconsistent with both Chamaeleon I and Cha. However, RX J1123.27924 was incorrectly matched to 2MASS J112310527924434 in Ducourant et al. (2006). By examining the finder chart from Alcalá et al. (1995), we find that RX J1123.27924 is instead 2MASS J112255627924438. The UCAC2 proper motion for this star is , 12 mas/yr (errors of 6 mas/yr in each component). Thus, we classify it is a likely member of Cha. We also have examined the proper motions of young stars from Luhman (2007) that are between Cha and the Chamaeleon I cloud. Using proper motions from UCAC2 and from available optical and IR sky surveys, we find that 2MASS J111835727935548, 2MASS J114326697804454, 2MASS J114049677459394, and 2MASS J113349267618399 are more likely to be members of Cha than Chamaeleon I. Other young stars from Luhman (2007) that are between these two populations have the proper motions that indicate membership, are inconclusive, or are unavailable.
References
- Adams et al. (1987) Adams, F. C., Lada, C. J., & Shu, F. H. 1987, ApJ, 213, 788
- Alcalá et al. (1995) Alcalá, J. M., Krautter, J., Schmitt, J. H. M. M., Covino, E., Wichmann, R., & Mundt, R. 1995, A&AS, 114, 109
- Allen et al. (2004) Allen, L. E., et al. 2004, ApJS, 154, 363
- Allen et al. (2007) Allen, L. E., et al. 2007, Protostars and Planets V, B. Reipurth, D. Jewitt, and K. Keil (eds.), University of Arizona Press, Tucson, 361
- Allen et al. (2007) Allen, P. R., Luhman, K. L., Myers, P. C., Megeath, S. T., Allen, L. E., Hartmann, L., & Fazio, G. G. 2007, ApJ, 655, 1095
- Allers et al. (2006) Allers, K. N., Kessler-Silacci, J. E., Cieza, L. A., & Jaffe, D. T. 2006, ApJ, 644, 364
- Apai et al. (2002) Apai, D., Pascucci, I., Henning, Th., Sterzik, M. F., Klein, R., Semenov, D., Günther, E., & Stecklum, B. 2002, ApJ, 573, L115
- Assendorp et al. (1990) Assendorp, R., Wesselius, P. R., Prusti, T., & Whittet, D. C. B. 1990, MNRAS, 247, 624
- Bally et al. (2006) Bally, J., Walawender, J., Luhman, K. L., & Fazio, G. 2006, AJ, 132, 1923
- Baraffe et al. (1998) Baraffe, I., Chabrier, G., Allard, F., & Hauschildt, P. H. 1998, A&A, 337, 403
- Baraffe et al. (2002) Baraffe, I., Chabrier, G., Allard, F., & Hauschildt, P. H. 2002, A&A, 382, 563
- Barrado y Navascués et al. (2007) Barrado y Navascués, D., et al. 2007, ApJ, 664, 481
- Baud et al. (1984) Baud, B., et al. 1984, ApJ, 278, L53
- Belloche et al. (2006) Belloche, A., Parise, B., van der Tak, F. F. S., Schilke, P., Leurini, S., et al. 2006, A&A, 454, L51
- Bertout et al. (1999) Bertout, C., Robichon, N., & Arenou, F. 1999, A&A, 352, 574
- Briceño et al. (2002) Briceño, C., Luhman, K. L., Hartmann, L., Stauffer, J. R., & Kirkpatrick, J. D. 2002, ApJ, 580, 317
- Burgasser et al. (2003) Burgasser, A. J., Kirkpatrick, J. D., Reid, I. N., Brown, M. E., Miskey, C. L., & Gizis, J. E. 2003, ApJ, 586, 512
- Burrows et al. (1997) Burrows, A., et al. 1997, ApJ, 491, 856
- Caballero et al. (2007) Caballero, J. A., et al. 2007, A&A, 470, 903
- Calvet et al. (2002) Calvet, N., D’Alessio, P., Hartmann, L., Wilner, D., Walsh, A., & Sitko, M. 2002, ApJ, 568, 1008
- Calvet et al. (2005) Calvet, N., et al. 2005, ApJ, 630, L185
- Cambrésy et al. (1997) Cambrésy, L., Epchtein, N., Copet, E., de Batz, B., Kimeswenger, S., Le Bertre, T., Rouan, D., & Tiphene, D. 1997, A&A, 324, L5
- Carpenter et al. (2006) Carpenter, J. M., Mamajek, E. E., Hillenbrand, L. A., & Meyer, M. R. 2006, ApJ, 651, L49
- Chabrier et al. (2000) Chabrier, G., Baraffe, I., Allard, F., & Hauschildt, P. 2000, ApJ, 542, L119
- Comerón et al. (2004) Comerón, F., Reipurth, B., Henry, A., & Fernández, M. 2004, A&A, 417, 583
- Covino et al. (1997) Covino, E., Alcalá, J. M., Allain, S., Bouvier, J., Terranegra, L., & Krautter, J. 1997, A&A, 328, 187
- Dahm & Hillenbrand (2007) Dahm, S. E., & Hillenbrand, L. A. 2007, AJ, 133, 2072
- Dahn et al. (2002) Dahn, C. C., et al. 2002, AJ, 124, 1170
- D’Alessio et al. (2005) D’Alessio, P., et al. 2005, ApJ, 621, 461
- Damjanov et al. (2007) Damjanov, I., Jayawardhana, R., Scholz, A., Ahmic, M., Nguyey, D. C., Brandeker, A., & van Kerkwijk, M. H. 2007, ApJ, in press
- Ducourant et al. (2006) Ducourant, C., et al. 2006, A&A, 448, 1235
- Engelbracht et al. (2007) Engelbracht, C. W., et al. 2007, PASP, 119, 994
- Espaillat et al. (2007a) Espaillat, C., et al. 2007a, ApJ, 664, L111
- Espaillat et al. (2007b) Espaillat, C., et al. 2007b, ApJ, 670, L135
- Fazio et al. (2004a) Fazio, G. G., et al. 2004a, ApJS, 154, 10
- Fazio et al. (2004b) Fazio, G. G., et al. 2004b, ApJS, 154, 39
- Feigelson & Lawson (2004) Feigelson, E. D., & Lawson, W. A. 2004, ApJ, 614, 267
- Feigelson et al. (2003) Feigelson, E. D., Lawson, W. A., & Garmire, G. P. 2003, ApJ, 599, 1207
- Flaherty et al. (2007) Flaherty, K. M., Pipher, J. L., Megeath, S. T., Winston, E. M., Gutermuth, R. A., Muzerolle, J., Allen, L. E., & Fazio, G. G. 2007, ApJ, 663, 1069
- Frink et al. (1998) Frink, S., Roeser, S., Alcalá, J. M., Covino, E., & Brandner, W. 1998, A&A, 338, 442
- Furlan et al. (2007) Furlan, E., et al. 2007, ApJ, 644, 1176
- Gizis et al. (2002) Gizis, J. E., Reid, I. N., & Hawley, S. L. 2002, AJ, 123, 3356
- Glass (1979) Glass, I. S. 1979, MNRAS, 187, 305
- Gómez & Kenyon (2001) Gómez, M., & Kenyon, S. J. 2001, AJ, 121, 974
- Greene et al. (1994) Greene, T. P., Wilking, B. A., André, P., Young, E. T., & Lada, C. J. 1994, ApJ, 434, 614
- Guieu et al. (2007) Guieu, S., et al. 2007, A&A, 465, 855
- Gutermuth et al. (2004) Gutermuth, R. A., Megeath, S. T., Muzerolle, J., Allen, L. E., Pipher, J. L., Myers, P. C., & Fazio, G. G. 2004, ApJS, 154, 374
- Gutermuth et al. (2007) Gutermuth, R. A., et al. 2007, ApJ, in press
- Hartmann (2002) Hartmann, L. 2002, ApJ, 578, 914
- Hartmann, Ballesteros-Paredes, & Bergin (2001) Hartmann, L., Ballesteros-Paredes, J., & Bergin, E. 2001, ApJ, 562, 852
- Hartmann et al. (2005) Hartmann, L., Megeath, S. T., Allen, L., Luhman, K., Calvet, N., D’Alessio, P., Franco-Hernandez, R., & Fazio, G. 2005, ApJ, 629, 881
- Harvey et al. (2006) Harvey, P. M., et al. 2006, ApJ, 644, 307
- Harvey et al. (2007) Harvey, P. M., et al. 2007, ApJ, 663, 1139
- Hernández et al. (2006) Hernández, J., Briceño, C., Calvet, N., Hartmann, L., Muzerolle, J., & Quintero, A. 2006, ApJ, 652, 472
- Hernández et al. (2007) Hernández, J., et al. 2007, ApJ, 662, 1067
- Hora et al. (2004) Hora, J. L., et al. 2004, Proc. SPIE, 5487, 77
- Jayawardhana et al. (2003) Jayawardhana, R., Ardila, D. R., Stelzer, B., & Haisch, K. E. 2003, AJ, 126, 1515
- Jørgensen et al. (2006) Jørgensen, J. K., et al. 2006, ApJ, 645, 1246
- Kenyon & Gómez (2001) Kenyon, S. J., & Gómez, M. 2001, AJ, 121, 2673
- Kirkpatrick (2005) Kirkpatrick, J. D. 2005, ARA&A, 43, 195
- Kirkpatrick et al. (2006) Kirkpatrick, J. D., Barman, T. S., Burgasser, A. J., McGovern, M. R., McLean, I. S., Tinney, C. G., & Lowrance, P. J. 2006, ApJ, 639, 1120
- Kirkpatrick et al. (1999) Kirkpatrick, J. D., et al. 1999, ApJ, 519, 802
- Lada (1987) Lada, C. J. 1987, in IAU Symp. 115, Star Forming Regions, ed. M. Peimbert & J. Jugaku (Dordrecht: Reidel), 1
- Lada et al. (2000) Lada, C. J., Muench, A. A., Haisch, K. E., Lada, E. A., Alves, J. F., Tollestrup, E. V., & Willner, S. P. 2000, ApJ, 120, 3162
- Lada et al. (2004) Lada, C. J., Muench, A. A., Lada, E. A., & Alves, J. F. 2004, AJ, 128, 1254
- Lada & Wilking (1984) Lada, C. J., & Wilking, B. A. 1984, ApJ, 287, 610
- Lada et al. (2006) Lada, C. J., et al. 2006, AJ, 131, 1574
- Landsman et al. (1993) Landsman, W.B. 1993, ASP Conf. Ser. 52: Astronomical Data Analysis Software and Systems II, 52, 246
- Lehtinen et al. (2001) Lehtinen, K., Haikala, L. K., Mattila, K., & Lemke, D. 2001, A&A, 367 311
- Lucas et al. (2001) Lucas, P. W., Roche, P. F., Allard, F., & Hauschildt, P. H. 2001, MNRAS, 326, 695
- Luhman (1999) Luhman, K. L. 1999, ApJ, 525, 466
- Luhman (2004a) Luhman, K. L. 2004a, ApJ, 602, 816
- Luhman (2004b) Luhman, K. L. 2004b, ApJ, 616, 1033
- Luhman (2004c) Luhman, K. L. 2004c, ApJ, 617, 1216
- Luhman (2007) Luhman, K. L. 2007, ApJS, 173, 104
- Luhman (2008) Luhman, K. L. 2008, Handbook of Star Forming Regions, ASP Conference Series, submitted
- Luhman et al. (2005c) Luhman, K. L., Adame, L., D’Alessio, P., Calvet, N., Hartmann, L., Megeath, S. T., & Fazio, G. G. 2005c, ApJ, 635, L93
- Luhman et al. (2005a) Luhman, K. L., D’Alessio, P., Calvet, N., Allen, L. E., Hartmann, L., Megeath, S. T. Myers, P. C., & Fazio, G. G. 2005a, ApJ, 620, L51
- Luhman et al. (2004) Luhman, K. L., Peterson, D. E., & Megeath, S. T. 2004, ApJ, 617, 565
- Luhman et al. (2003) Luhman, K. L., Stauffer, J. R., Muench, A. A., Rieke, G. H., Lada, E. A., Bouvier, J., & Lada, C. J. 2003, ApJ, 593, 1093
- Luhman et al. (2006) Luhman, K. L., Whitney, B. A., Meade, M. R., Babler, B. L., Indebetouw, R., Bracker, S., & Churchwell, E. B. 2006, ApJ, 647, 1180
- Luhman et al. (2005b) Luhman, K. L., et al. 2005b, ApJ, 631, L69
- Mamajek et al. (2000) Mamajek, E., Lawson, W. A., & Feigelson, E. D. 2000, ApJ, 544, 356
- Megeath et al. (2005) Megeath, S. T., Hartmann, L., Luhman, K. L., & Fazio, G. G. 2005, ApJ, 634, L113
- Megeath et al. (2004) Megeath, S. T., et al. 2004, ApJS, 154, 367
- Mohanty et al. (2005) Mohanty, S., Jayawardhana, R., & Basri, G. 2005, ApJ, 626, 498
- Muench et al. (2007) Muench, A. A., Lada, C. J., Luhman, K. L., Muzerolle, J., & Young, E. 2007, AJ, 134, 411
- Muench et al. (2003) Muench, A. A., et al. 2003, AJ, 125, 2029
- Muzerolle et al. (2005) Muzerolle, J., Luhman, K. L., Briceño, C., Hartmann, L., & Calvet, N. 2005, ApJ, 625, 906
- Muzerolle et al. (2004) Muzerolle, J., et al. 2004, ApJS, 154, 379
- Natta & Testi (2001) Natta, A., & Testi, L. 2001, A&A, 376, L22
- Nordh et al. (1996) Nordh, L., et al. 1996, A&A, 315, L185
- Persi et al. (2001) Persi, P., Marenzi, A. R., Gómez, M., & Olofsson, G. 2001, A&A, 376, 907
- Persi et al. (2000) Persi, P., et al. 2000, A&A, 357, 219
- Pipher et al. (2004) Pipher, J. L., et al. 2004, Proc. SPIE, 5487, 234
- Porras et al. (2007) Porras, A., et al. 2007, ApJ, 656, 493
- Prusti et al. (1991) Prusti, T., Clark, F. O., Whittet, D. C. B., Laureijs, R. J., & Zhang, C. Y. 1991, MNRAS, 251, 303
- Reach et al. (2005) Reach, W. T., et al. 2005, PASP, 117, 978
- Rebull et al. (2007) Rebull, L. M., et al. 2007, ApJS, 171, 447
- Reipurth et al. (1996) Reipurth, B., Nyman, L.-Å., & Chini, R. 1996, A&A, 314, 258
- Rieke et al. (2004) Rieke, G. H. et al. 2004, ApJS, 154, 25
- Scholz & Jayawardhana (2007) Scholz, A., & Jayawardhana, R. 2007, ApJ, in press
- Scholz et al. (2007) Scholz, A., Jayawardhana, R., Wood, K., Meeus, G., Stelzer, B., Walker, C., & O’Sullivan, M. 2007, ApJ, 660, 1517
- Sicilia-Aguilar et al. (2006) Sicilia-Aguilar, A., et al. 2006, ApJ, 638, 897
- Skrutskie et al. (2006) Skrutskie, M., et al. 2006, AJ, 131, 1163
- Stelzer et al. (2004) Stelzer, B., Micela, G., & Neuhäuser, R. 2004, A&A, 423, 1029
- Teixeira et al. (2006) Teixeira, P. S., et al. 2006, ApJ, 636, L45
- Werner et al. (2004) Werner, M. W., et al. 2004, ApJS, 154, 1
- Whittet et al. (1997) Whittet, D. C. B., Prusti, T., Franco, G. A. P., Gerakines, P. A., Kilkenny, D., Larson, K. A., & Wesselius, P. R. 1997, A&A, 327, 1194
- Wichmann et al. (1998) Wichmann, R., Bastian, U., Krautter, J., Jankovics, I., & Ruciński, S. M. 1998, MNRAS, 301, L39
- Winston et al. (2007) Winston, E., et al. 2007, ApJ, 669, 493
- Young et al. (2005) Young, K. E., et al. 2005, ApJ, 628, 283
- Zacharias et al. (2004) Zacharias, N., Urban, S. E., Zacharias, M. I., Wycoff, G. L., Hall, D. M., Monet, D. G., & Rafferty, T. J., 2004, AJ, 127, 3043
- Zapatero Osorio et al. (2007) Zapatero Osorio, M. R., et al. 2007, A&A, 472, L9
- Zuckerman & Song (2004) Zuckerman, B., & Song, I. 2004, ARA&A, 42, 685
| 3.6/5.8 Center | 4.5/8.0 Center | Dimensions | AngleaaPosition angle of the long axis of the maps. | Exp TimebbTotal exposure time for each position and filter. “HDR” indicates that 0.4 s exposures were also obtained. | Date | ||
|---|---|---|---|---|---|---|---|
| AOR | PID | (J2000) | (J2000) | (arcmin) | (deg) | (s) | (UT) |
| 6526208 | 36 | 11 08 46 77 37 19 | 11 06 45 77 39 37 | 20 15 | 72 | 968 | 2004 Feb 19 |
| 5662720 | 173 | 11 02 59 77 36 25 | 11 01 38 77 31 09 | 13 7 | 142 | 20.8 HDR | 2004 May 1 |
| 5663232 | 173 | 11 24 06 79 27 30 | 11 22 21 79 22 40 | 13 6 | 135 | 20.8 HDR | 2004 May 1 |
| 11 17 50 80 31 00 | 11 15 56 80 26 09 | 13 6 | 135 | 20.8 HDR | |||
| 5663744 | 173 | 11 50 46 77 07 50 | 11 49 55 77 01 33 | 12 6 | 148 | 20.8 HDR | 2004 May 26 |
| 12 05 00 77 34 30 | 12 04 04 77 28 30 | 12 6 | 148 | 20.8 HDR | |||
| 12 17 30 77 56 30 | 12 16 28 77 50 40 | 12 6 | 148 | 20.8 HDR | |||
| 3960320 | 37 | 11 07 44 77 34 46 | 11 07 48 77 28 03 | 33 29 | 3 | 20.8 HDR | 2004 Jun 6 |
| 5663488 | 173 | 11 58 52 77 58 00 | 11 58 28 77 51 15 | 13 6 | 170 | 20.8 HDR | 2004 Jun 6 |
| 11 49 48 78 54 10 | 11 49 25 78 47 23 | 13 6 | 170 | 20.8 HDR | |||
| 3651328 | 6 | 11 09 26 76 36 26 | 11 10 16 76 30 20 | 33 29 | 28 | 20.8 HDR | 2004 Jul 4 |
| 5105920 | 139 | 11 02 02 77 42 47 | 11 03 01 77 36 43 | 19 10 | 120 | 41.6 | 2004 Jul 4 |
| 5662976 | 173 | 11 08 15 75 21 43 | 11 09 25 75 16 38 | 12 6 | 43 | 20.8 HDR | 2004 Jul 21 |
| 11 28 41 75 49 00 | 11 29 49 75 43 35 | 12 6 | 43 | 20.8 HDR | |||
| 11 10 16 76 47 22 | 11 11 35 76 42 16 | 12 6 | 43 | 20.8 HDR | |||
| 3955968 | 36 | 11 06 41 77 39 09 | 11 08 47 77 37 55 | 20 15 | 80 | 968 | 2004 Sep 2 |
| 12620032 | 36 | 11 10 38 76 34 35 | 11 09 23 76 29 21 | 25 15 | 131 | 968 | 2005 May 9 |
| 12620544 | 36 | 11 02 00 77 35 17 | 11 00 43 77 29 58 | 12 5 | 144 | 52 | 2005 May 9 |
| 18373888 | 30540 | 11 18 24 79 39 16 | 11 18 50 79 32 34 | 13 6 | 12 | 52 | 2006 Jul 6 |
| 18373376 | 30540 | 11 02 12 75 06 00 | 11 02 41 74 59 26 | 12 5 | 18 | 10.4 | 2006 Jul 7 |
| 18366720 | 30540 | 11 12 07 77 18 08 | 11 12 41 77 11 37 | 13 6 | 18 | 134 | 2006 Jul 10 |
| 18366976 | 30540 | 11 01 14 77 21 38 | 11 01 54 77 15 10 | 13 6 | 18 | 134 | 2006 Jul 10 |
| 18367232 | 30540 | 11 12 16 76 56 50 | 11 12 50 76 50 19 | 13 6 | 19 | 134 | 2006 Jul 10 |
| 18367488 | 30540 | 11 19 44 75 08 11 | 11 20 12 75 01 37 | 13 6 | 20 | 134 | 2006 Jul 10 |
| 18367744 | 30540 | 11 03 53 76 16 03 | 11 04 30 76 09 35 | 13 6 | 20 | 52 | 2006 Jul 10 |
| 18368000 | 30540 | 11 06 17 76 28 37 | 11 06 52 76 22 08 | 13 6 | 19 | 134 | 2006 Jul 10 |
| 18368256 | 30540 | 11 06 47 76 14 12 | 11 07 22 76 07 43 | 13 6 | 19 | 134 | 2006 Jul 10 |
| 18368512 | 30540 | 11 07 30 76 18 33 | 11 08 05 76 12 04 | 13 6 | 19 | 134 | 2006 Jul 10 |
| 18368768 | 30540 | 11 14 11 77 36 20 | 11 14 45 77 29 50 | 13 6 | 20 | 52 | 2006 Jul 10 |
| 18369024 | 30540 | 11 17 23 76 49 37 | 11 17 54 76 43 04 | 13 6 | 19 | 134 | 2006 Jul 10 |
| 18369280 | 30540 | 11 00 55 77 25 52 | 11 01 35 77 19 27 | 13 6 | 20 | 52 | 2006 Jul 10 |
| 18369536 | 30540 | 10 57 46 77 15 04 | 10 58 28 77 08 38 | 13 6 | 20 | 52 | 2006 Jul 10 |
| 18369792 | 30540 | 11 09 13 77 02 34 | 11 09 48 76 56 04 | 13 6 | 20 | 52 | 2006 Jul 10 |
| 18370048 | 30540 | 11 18 20 76 46 20 | 11 18 50 76 39 48 | 13 6 | 20 | 52 | 2006 Jul 10 |
| 18370304 | 30540 | 11 19 29 76 26 52 | 11 19 59 76 20 16 | 13 6 | 20 | 52 | 2006 Jul 10 |
| 18370816 | 30540 | 11 24 00 76 34 02 | 11 24 27 76 27 27 | 13 6 | 20 | 52 | 2006 Jul 10 |
| 18371072 | 30540 | 11 43 19 78 08 08 | 11 43 39 78 01 24 | 13 6 | 9 | 52 | 2006 Jul 10 |
| 18371328 | 30540 | 11 40 42 75 03 00 | 11 41 00 74 56 19 | 13 6 | 12 | 52 | 2006 Jul 10 |
| 18371584 | 30540 | 11 07 23 75 56 08 | 11 07 57 75 49 40 | 13 6 | 20 | 52 | 2006 Jul 10 |
| 18371840 | 30540 | 11 24 18 75 57 42 | 11 24 45 75 51 07 | 13 6 | 20 | 52 | 2006 Jul 10 |
| 18372096 | 30540 | 11 33 39 76 22 00 | 11 34 03 76 15 20 | 13 6 | 20 | 52 | 2006 Jul 10 |
| 18372352 | 30540 | 11 33 13 76 25 33 | 11 33 37 76 18 50 | 13 6 | 20 | 52 | 2006 Jul 10 |
| 18372608 | 30540 | 11 06 44 75 34 11 | 11 07 18 75 27 44 | 13 6 | 19 | 134 | 2006 Jul 10 |
| 18372864 | 30540 | 11 02 03 75 40 11 | 11 02 39 75 33 44 | 13 6 | 20 | 52 | 2006 Jul 10 |
| 18373120 | 30540 | 10 52 19 74 43 39 | 10 52 58 74 37 20 | 13 6 | 23 | 52 | 2006 Jul 10 |
| 18373632 | 30540 | 11 05 45 75 10 39 | 11 06 19 75 04 10 | 13 6 | 20 | 52 | 2006 Jul 10 |
| 18374400 | 30540 | 11 02 24 77 27 40 | 11 03 03 77 21 12 | 13 6 | 20 | 52 | 2006 Jul 10 |
| Center | Dimensions | AngleaaPosition angle of the long axis of the maps. | Exp Time | Date | ||
|---|---|---|---|---|---|---|
| AOR | PID | (J2000) | (arcmin) | (deg) | (s) | (UT) |
| 5706752 | 173 | 11 09 13 77 29 10 | 8 7 | 55 | 220 | 2004 Feb 3 |
| 11 12 09 77 21 22 | 8 5 | 55 | 480 | |||
| 11 07 00 77 32 30 | 7 6 | 55 | 160 | |||
| 4549376 | 72 | 11 58 29 77 54 29 | 8 7 | 61 | 280 | 2004 Feb 22 |
| 12 01 46 77 47 39 | 8 5 | 61 | 600 | |||
| 5707008 | 173 | 11 10 52 76 44 20 | 8 7 | 115 | 140 | 2004 Apr 8 |
| 11 14 15 76 48 39 | 8 5 | 115 | 360 | |||
| 9410304 | 139 | 11 02 31 77 39 46 | 17 8 | 28 | 37 | 2004 Apr 8 |
| 11 06 09 77 44 34 | 13 10 | 118 | 500 | |||
| 3661312 | 6 | 11 10 31 76 35 30 | 56 32 | 119 | 80 | 2004 Apr 11 |
| 5686784 | 173 | 11 02 24 77 33 33 | 8 7 | 15 | 37 | 2004 Jun 22 |
| 11 01 41 77 45 45 | 8 5 | 15 | 31 | |||
| 5687296 | 173 | 11 12 24 76 37 07 | 8 7 | 29 | 37 | 2004 Jul 8 |
| 11 10 53 76 48 22 | 8 5 | 29 | 120 | |||
| 5200128 | 148 | 11 11 45 76 20 10 | 8 7 | 53 | 73 | 2004 Aug 3 |
| 11 09 07 76 28 24 | 8 5 | 53 | 240 | |||
| 5687808 | 173 | 11 23 09 79 25 00 | 8 7 | 50 | 73 | 2004 Aug 3 |
| 11 19 55 79 33 40 | 8 5 | 50 | 360 | |||
| 3962112 | 37 | 11 08 29 77 30 36 | 56 32 | 73 | 80 | 2005 Feb 27 |
| 5687040 | 173 | 11 08 54 75 19 37 | 8 7 | 72 | 110 | 2005 Feb 27 |
| 11 11 54 75 14 46 | 8 5 | 72 | 360 | |||
| 5688576 | 173 | 11 50 30 77 04 36 | 8 7 | 62 | 73 | 2005 Feb 27 |
| 11 53 35 76 57 50 | 8 5 | 62 | 360 | |||
| 5688064 | 173 | 11 29 14 75 46 25 | 8 7 | 73 | 140 | 2005 Mar 6 |
| 11 32 22 75 41 53 | 8 5 | 73 | 360 | |||
| 5688320 | 173 | 11 49 46 78 50 51 | 8 7 | 67 | 110 | 2005 Mar 6 |
| 11 53 36 78 45 19 | 8 5 | 67 | 360 | |||
| 12663040 | 37 | 11 10 10 76 32 20 | 8 7 | 110 | 37 | 2005 Apr 9 |
| 11 13 37 76 35 27 | 8 5 | 110 | 120 | |||
| 13468416 | 248 | 11 06 39 77 43 14 | 8 7 | 143 | 420 | 2005 May 11 |
| 13472000 | 248 | 11 07 38 77 35 34 | 8 7 | 150 | 420 | 2005 May 17 |
| 21916928 | 40302 | 11 04 11 76 12 50 | 8 7 | 155 | 120 | 2007 Jun 6 |
| 11 05 55 76 23 40 | 8 5 | 155 | 120 | |||
| 21917184 | 40302 | 11 09 29 76 59 20 | 8 7 | 153 | 120 | 2007 Jun 6 |
| 11 11 25 77 09 57 | 8 5 | 153 | 120 | |||
| 21917440 | 40302 | 11 18 34 76 43 07 | 8 7 | 151 | 120 | 2007 Jun 6 |
| 11 20 34 76 53 28 | 8 5 | 151 | 120 | |||
| 21917696 | 40302 | 11 19 43 76 23 36 | 8 7 | 151 | 120 | 2007 Jun 6 |
| 11 21 40 76 33 56 | 8 5 | 151 | 120 | |||
| 21918208 | 40302 | 11 07 38 75 52 56 | 8 7 | 154 | 120 | 2007 Jun 6 |
| 11 09 23 76 03 39 | 8 5 | 154 | 120 | |||
| 21918464 | 40302 | 11 24 30 75 54 27 | 8 7 | 150 | 120 | 2007 Jun 6 |
| 11 26 27 76 04 38 | 8 5 | 150 | 120 | |||
| 21918720 | 40302 | 11 33 50 76 18 43 | 8 7 | 147 | 120 | 2007 Jun 6 |
| 11 35 57 76 28 36 | 8 5 | 147 | 120 | |||
| 21918976 | 40302 | 11 33 24 76 22 12 | 8 7 | 147 | 120 | 2007 Jun 6 |
| 11 35 31 76 32 07 | 8 5 | 147 | 120 | |||
| 21919488 | 40302 | 11 19 57 75 04 57 | 8 7 | 152 | 120 | 2007 Jun 6 |
| 11 21 43 75 15 20 | 8 5 | 152 | 120 | |||
| 21917952 | 40302 | 11 40 49 74 59 40 | 8 7 | 9 | 120 | 2007 Jul 16 |
| 11 40 35 75 12 09 | 8 5 | 9 | 120 | |||
| 21919232 | 40302 | 11 02 19 75 37 00 | 8 7 | 18 | 120 | 2007 Jul 16 |
| 11 01 32 75 49 07 | 8 5 | 18 | 120 | |||
| 21919744 | 40302 | 10 52 37 74 40 32 | 8 7 | 21 | 120 | 2007 Jul 16 |
| 10 51 44 74 52 29 | 8 5 | 21 | 120 | |||
| 21920000 | 40302 | 11 02 25 75 02 44 | 8 7 | 18 | 120 | 2007 Jul 16 |
| 11 01 40 75 14 49 | 8 5 | 18 | 120 | |||
| 21920256 | 40302 | 11 06 00 75 07 27 | 8 7 | 17 | 120 | 2007 Jul 16 |
| 11 05 17 75 19 37 | 8 5 | 17 | 120 |
| Night | Date | Telescope + Instrument | Disperser | (m) | |
|---|---|---|---|---|---|
| 1 | 2005 Mar 23 | Gemini + GNIRS | 31.7 cross-dispersed | 1-2.5 | 2000 |
| 2 | 2005 Mar 24 | Gemini + GNIRS | 31.7 cross-dispersed | 1-2.5 | 2000 |
| 3 | 2006 Feb 9 | Magellan II + LDSS-3 | VPH red grism | 0.68-1.1 | 1300 |
| 4 | 2006 Feb 10 | Magellan II + LDSS-3 | VPH red grism | 0.58-1 | 1300 |
| 5 | 2006 Feb 11 | Magellan II + LDSS-3 | VPH red grism | 0.58-1 | 1300 |
| aaTemperature scale from Luhman et al. (2003). For Cha J110707687626326, that scale has been extrapolated to L0. | Membership | ||||||||
|---|---|---|---|---|---|---|---|---|---|
| Name | Spectral Type | (K) | () | EvidencebbMembership in Chamaeleon is indicated by and a position above the main sequence for the distance of Chamaeleon (“”), strong emission lines (“e”), IR excess emission (“ex”), or the shape of the gravity-sensitive H2O bands (“H2O”). | ccFrom the 2MASS Point Source Catalog for 2M J110629427724586 and 2M J110703697724307 and from the ISPI images of Luhman (2007) for Cha J110707687626326. | ccFrom the 2MASS Point Source Catalog for 2M J110629427724586 and 2M J110703697724307 and from the ISPI images of Luhman (2007) for Cha J110707687626326. | ccFrom the 2MASS Point Source Catalog for 2M J110629427724586 and 2M J110703697724307 and from the ISPI images of Luhman (2007) for Cha J110707687626326. | Night | |
| 2M J110629427724586 | M61 | 2990 | 5.6 | 0.035 | ,H2O,ex | 15.200.10 | 13.810.06 | 1 | |
| 2M J110703697724307 | M7.51 | 2795 | 4.7 | 0.020 | ,H2O,ex | 15.260.12 | 13.950.07 | 1 | |
| Cha J110707687626326 | L01 | 2200 | 0 | 0.00033 | e,ex | 17.610.03 | 16.800.03 | 15.910.02 | 4,5 |
| 2M J110842967743500 | M41 | 3270 | 5.6 | 0.053 | ,e,ex | 14.870.10 | 13.480.05 | 2 |
| Name | [3.6] | [4.5] | [5.8] | [8.0] | [24] |
|---|---|---|---|---|---|
| Cha J110553627638533 | 14.590.03 | 13.820.03 | 12.900.05 | 12.190.06 | 8.890.06 |
| 2M J110812047622124 | 14.160.03 | 13.730.03 | 13.480.05 | 11.290.04 | 8.310.05 |
| Cha J110817247631107 | 15.040.03 | 14.780.04 | 14.760.04 | 13.550.04 | |
| Cha J110830297733067 | 14.490.03 | 14.280.03 | 14.330.04 | 13.590.06 | |
| Cha J110840067627085 | 15.810.02 | 15.510.02 | 15.580.06 | 14.970.08 | |
| 2M J110856517645154 | 12.470.02 | 12.480.02 | 12.460.05 | 12.340.08 | |
| Cha J110908767626234 | 16.220.02 | 15.890.02 | 15.640.06 | 14.550.08 | 10.750.17 |
| 2M J111051857642259 | 13.790.02 | 13.770.03 | 13.700.07 | 13.430.11 | |
| 2M J111053537726389 | 12.440.02 | 12.380.02 | 12.330.05 | 12.290.05 | |
| Cha J111124207637434 | 14.970.03 | 14.200.03 | 13.340.04 | 12.580.05 | 9.580.10 |
| Cha J111147737642167 | 14.020.02 | 13.190.02 | 12.420.04 | 11.600.05 | 7.900.05 |
| Cha J111205467631376 | 15.000.02 | 13.890.02 | 12.920.04 | 11.820.04 | 8.280.05 |
| Cha J111307147638575 | 15.040.03 | 14.200.04 | 13.560.07 | 12.620.06 | 8.790.06 |
| Name | [3.6] | [4.5] | [5.8] | [8.0] | Date | [24] | Date |
|---|---|---|---|---|---|---|---|
| 2M J110206107718079 | 13.420.02 | 13.100.02 | 12.840.03 | 12.340.03 | 2006 Jul 10 | out | |
| 2M J110253747722561aa[LES2004] 424. | 13.930.02 | 13.630.02 | 13.430.03 | 13.070.05 | 2006 Jul 10 | 9.800.07 | 2005 Feb 27 |
| Cha J110627887724543b,cb,cfootnotemark: | 15.570.05 | 14.450.05 | 13.370.07 | 12.410.07 | 2004 Jun 10 | 8.890.20 | 2005 Feb 27 |
| Cha J110628547618039 | 14.210.02 | 13.890.02 | 13.620.03 | 13.150.05 | 2006 Jul 10 | 10.270.15 | 2004 Apr 11 |
| Cha J110803977730382ccPossible class I source. | 15.310.02 | 14.500.02 | 13.800.03 | 12.720.03 | 2004 Feb 19 | 7.820.03 | 2005 Feb 27 |
| 15.280.03 | 14.480.02 | 14.030.08 | 12.800.07 | 2004 Jun 10 | |||
| 2M J110853677521359dd from RX J1108.87519A and B. | 8.700.02 | 8.480.02 | 8.320.03 | 7.960.03 | 2004 Jul 21 | 4.980.03 | 2005 Feb 27 |
| 2M J111003367633111c,ec,efootnotemark: | 12.740.02 | 11.980.02 | 11.510.04 | 10.940.08 | 2004 Jul 4 | 5.280.10 | 2004 Apr 11 |
| 12.670.02 | 11.910.02 | 11.280.03 | 10.670.03 | 2005 May 9 | 5.330.10 | 2005 Apr 9 | |
| 2M J112914707546256ff from RX J1129.27546. | 12.910.02 | 12.290.02 | 11.560.03 | 10.600.03 | 2004 Jul 21 | 7.340.10 | 2005 Mar 6 |
| 2MASSaa2MASS Point Source Catalog. | Name | [3.6] | [4.5] | [5.8] | [8.0] | Date | [24] | Date |
|---|---|---|---|---|---|---|---|---|
| J105236947440287 | 10.190.02 | 10.110.02 | 10.080.03 | 10.140.04 | 2006 Jul 10 | 9.440.15 | 2007 Jul 16 | |
| J105805977711501 | 11.700.02 | 11.450.02 | 11.260.03 | 10.750.04 | 2006 Jul 10 | out | ||
| J105816777717170 | T6 | sat | out | 6.410.03 | out | 2006 Jul 10 | out | |
| J110113707722387 | 11.690.02 | 11.610.02 | 11.600.03 | 11.560.04 | 2006 Jul 10 | 2005 Feb 27 | ||
| J110119267732383 | out | 10.870.02 | out | 10.770.04 | 2004 Jul 4 | 2004 Jun 22 | ||
| 11.000.02 | 10.860.02 | 10.810.03 | 10.760.04 | 2005 May 9 | ||||
| 11.000.02 | out | 10.780.03 | out | 2006 Jul 10 | ||||
| J110132057718249 | ESO H 554 | 13.050.02 | 12.970.02 | 12.890.03 | 12.880.05 | 2006 Jul 10 | out | |
| J110219277536576 | 10.890.02 | 10.790.02 | 10.780.03 | 10.800.04 | 2006 Jul 10 | 10.300.30 | 2007 Jul 16 | |
| J110224917733357 | T11 | 8.150.02 | 8.140.02 | 8.030.03 | 7.870.03 | 2004 May 1 | 2.560.04 | 2004 Apr 8 |
| out | sat | out | 7.880.03 | 2004 Jul 4 | 2.590.04 | 2004 Jun 22 | ||
| sat | out | 7.970.03 | out | 2006 Jul 10 | 2.560.04 | 2005 Feb 27 | ||
| J110226107502407 | 10.550.02 | 10.480.02 | 10.410.05 | 10.380.05 | 2006 Jul 7 | 9.790.19 | 2007 Jul 16 | |
| J110232657729129 | CHXR 71 | 9.780.02 | out | 9.530.03 | out | 2004 May 1 | 7.500.04 | 2005 Feb 27 |
| 9.780.02 | out | 9.500.03 | out | 2006 Jul 10 | ||||
| J110241837724245 | [LES2004] 423 | 11.200.02 | 11.100.02 | 11.050.03 | 11.100.04 | 2006 Jul 10 | 2005 Feb 27 | |
| J110255047721508 | T12 | 9.780.02 | bad | 9.200.03 | 8.650.03 | 2006 Jul 10 | 5.900.04 | 2005 Feb 27 |
| J110341867726520 | ISO 28 | 11.230.02 | 11.200.02 | 11.060.03 | 11.030.04 | 2004 Jun 10 | 2005 Feb 27 | |
| J110347647719563 | Hn 2 | 9.690.02 | 9.610.02 | 9.550.03 | 9.620.04 | 2004 Jun 10 | 9.380.13 | 2005 Feb 27 |
| out | 9.640.02 | out | 9.630.03 | 2006 Jul 10 | ||||
| J110356827721329 | CHXR 12 | 9.630.02 | 9.460.02 | 9.370.03 | 9.430.04 | 2004 Jun 10 | 9.190.08 | 2005 Feb 27 |
| J110404257639328 | CHSM 1715 | out | out | out | out | 4.890.04 | 2004 Apr 11 | |
| J110409097627193 | T14 | out | out | out | out | 2.440.04 | 2004 Apr 11 | |
| J110410607612490 | CHSM 1982 | 11.690.02 | 11.590.02 | 11.560.03 | 11.530.03 | 2006 Jul 10 | 2007 Jun 6 | |
| J110422757718080 | T14A | 10.060.02 | 9.230.02 | 8.250.03 | 6.970.04 | 2004 Jun 10 | 3.470.04 | 2005 Feb 27 |
| J110442587741571 | ISO 52 | out | sat | out | 8.840.04 | 2004 Feb 19 | 5.280.04 | 2004 Apr 8 |
| 9.920.02 | 9.710.02 | 9.480.03 | 8.930.03 | 2004 Jun 10 | 5.400.04 | 2005 Feb 27 | ||
| 9.820.02 | 9.490.02 | 9.290.03 | 8.790.04 | 2004 Jul 4 | ||||
| sat | out | 9.600.03 | out | 2004 Sep 2 | ||||
| J110451007625240 | CHXR 14N | out | out | out | out | 9.260.07 | 2004 Apr 11 | |
| J110452857625514 | CHXR 14S | out | out | out | out | 8.660.08 | 2004 Apr 11 | |
| J110457017715569 | T16 | out | 9.570.02 | out | 8.720.04 | 2004 Jun 10 | out | |
| J110514677711290 | Hn 4 | out | 9.140.02 | out | 9.110.03 | 2004 Jun 10 | out | |
| J110524727626209 | out | out | out | out | 9.980.21 | 2004 Apr 11 | ||
| 10.490.11 | 2007 Jun 6 | |||||||
| J110543007726517 | CHXR 15 | 9.860.02 | 9.700.02 | 9.660.03 | 9.690.04 | 2004 Jun 10 | 9.410.08 | 2005 Feb 27 |
| J110552617618255 | T20 | sat | out | 9.020.03 | out | 2006 Jul 10 | 8.770.05 | 2004 Apr 11 |
| J110557807607488 | HD 96675 | out | out | out | out | 7.050.11 | 2004 Apr 11 | |
| J110600107507252 | 11.140.02 | 11.050.02 | 11.010.03 | 10.980.03 | 2006 Jul 10 | 2007 Jul 16 | ||
| J110615407721567 | Ced 110-IRS2/T21 | 6.260.02 | 6.160.02 | 6.090.03 | 6.100.04 | 2004 Jun 10 | 5.550.07 | 2005 Feb 27 |
| J110615457737501 | Cam 2-19 | sat | sat | 9.530.03 | 9.550.04 | 2004 Feb 19 | 9.500.09 | 2005 Feb 27 |
| 9.760.02 | 9.710.02 | 9.580.03 | 9.600.04 | 2004 Jun 10 | ||||
| sat | sat | 9.580.03 | 9.530.03 | 2004 Sep 2 | ||||
| J110625547633418 | ESO H 559 | 10.830.02 | 10.420.02 | 10.070.03 | 9.380.04 | 2004 Jul 4 | 5.340.04 | 2004 Apr 11 |
| 10.640.02 | out | 9.900.03 | out | 2006 Jul 10 | ||||
| J110628777737331 | CHXR 73A | sat | sat | 10.100.03 | 10.100.03 | 2004 Feb 19 | 9.580.14 | 2005 Feb 27 |
| 10.290.02 | 10.230.02 | 10.180.03 | 10.100.03 | 2004 Jun 10 | ||||
| sat | sat | 10.150.03 | 10.130.04 | 2004 Sep 2 | ||||
| J110629427724586 | 12.180.02 | 11.630.02 | 11.140.03 | 10.590.04 | 2004 Jun 10 | 8.730.20 | 2005 Feb 27 | |
| J110632767625210 | CHSM 7869 | out | 12.220.02 | out | 11.290.03 | 2005 May 9 | 8.570.06 | 2004 Apr 11 |
| 12.520.02 | 12.210.02 | 11.940.03 | 11.300.04 | 2006 Jul 10 | 8.420.06 | 2007 Jun 6 | ||
| Cha-MMS1 | 2004 Jun 10 | 8.860.09 | 2005 Feb 27 | |||||
| J110637997743090 | Cha H 12 | sat | sat | 11.180.03 | 11.120.04 | 2004 Feb 19 | 11.170.16 | 2004 Apr 8 |
| 11.340.02 | 11.250.02 | bad | 11.200.04 | 2004 Jun 10 | 10.610.22 | 2005 Feb 27 | ||
| sat | sat | 11.170.03 | 11.130.03 | 2004 Sep 2 | 10.770.10 | 2005 May 11 | ||
| J110639457736052 | ISO 79 | sat | sat | 10.410.03 | 9.780.04 | 2004 Feb 19 | 6.210.04 | 2004 Feb 3 |
| 11.440.02 | 10.760.02 | 10.340.03 | 9.710.03 | 2004 Jun 10 | 6.370.04 | 2005 Feb 27 | ||
| sat | sat | 10.360.03 | 9.710.04 | 2004 Sep 2 | 6.350.04 | 2005 May 17 | ||
| J110641807635489 | Hn 5 | 9.150.02 | 8.580.02 | 8.030.03 | 7.060.04 | 2004 Jul 4 | 4.710.04 | 2004 Apr 11 |
| J110643467726343 | T22 | 9.100.02 | 9.050.02 | 9.000.03 | 9.010.03 | 2004 Jun 10 | 8.590.06 | 2005 Feb 27 |
| J110645107727023 | CHXR 20 | 8.510.02 | 8.360.02 | 7.930.03 | 6.940.04 | 2004 Jun 10 | 4.450.04 | 2005 Feb 27 |
| J110646587722325 | Ced 110-IRS4 | 11.120.06 | 10.000.04 | 9.340.03 | 8.460.03 | 2004 Jun 10 | 2.100.04 | 2005 Feb 27 |
| J110657337742106 | CHXR 74 | sat | sat | 9.750.03 | 9.790.04 | 2004 Feb 19 | 9.600.07 | 2004 Apr 8 |
| 9.900.02 | 9.810.02 | 9.800.03 | 9.740.03 | 2004 Jun 10 | 9.570.11 | 2005 Feb 27 | ||
| sat | sat | 9.740.03 | 9.760.04 | 2004 Sep 2 | 9.750.07 | 2005 May 11 | ||
| J110658037722488 | ISO 86 | 10.210.02 | 8.930.02 | 8.270.03 | 7.540.04 | 2004 Jun 10 | 3.580.04 | 2005 Feb 27 |
| J110659067718535 | T23 | 9.840.02 | 9.550.02 | 9.190.03 | 8.250.04 | 2004 Jun 10 | 5.250.04 | 2005 Feb 27 |
| J110659397530559 | 12.160.02 | 11.880.02 | 11.640.03 | 11.060.04 | 2006 Jul 10 | out | ||
| J110703247610565 | 12.270.02 | 12.150.02 | 12.100.03 | 12.130.03 | 2006 Jul 10 | 2004 Apr 11 | ||
| ESO H 281 | 2004 Jul 4 | 6.930.04 | 2004 Apr 11 | |||||
| J110703697724307 | 12.860.02 | 12.350.02 | 11.840.04 | 10.990.04 | 2004 Jun 10 | 7.260.04 | 2005 Feb 27 | |
| Cha J110707687626326 | 14.980.03 | 14.560.03 | 14.220.11 | 13.300.11 | 2004 Jul 4 | 10.430.18 | 2004 Apr 11 | |
| out | 14.540.02 | out | 13.460.04 | 2005 May 9 | ||||
| 14.930.02 | 14.540.02 | 14.020.06 | 13.470.06 | 2006 Jul 10 | ||||
| J110709197723049 | Ced 110-IRS6 | 7.950.02 | 6.920.02 | 6.360.03 | 5.500.03 | 2004 Jun 10 | 1.630.04 | 2005 Feb 27 |
| J110709257718471 | ISO 91 | 10.080.02 | 9.540.02 | 9.230.03 | 8.440.03 | 2004 Jun 10 | 5.270.04 | 2005 Feb 27 |
| J110711487746394 | CHXR 21 | sat | sat | 9.190.03 | 9.210.04 | 2004 Feb 19 | 9.040.06 | 2004 Apr 8 |
| 9.340.02 | out | 9.230.03 | out | 2004 Jun 10 | 8.500.07 | 2005 Feb 27 | ||
| 9.080.05 | 2005 May 11 | |||||||
| J110711817625501 | CHSM 9484 | 11.980.02 | 11.780.02 | 11.600.03 | 11.050.04 | 2004 Jul 4 | 9.340.08 | 2004 Apr 11 |
| out | 11.690.02 | out | 11.060.04 | 2005 May 9 | ||||
| 12.000.02 | 11.760.02 | 11.560.03 | 11.090.03 | 2006 Jul 10 | ||||
| J110712067632232 | T24 | 8.650.02 | 8.380.02 | 8.020.03 | 7.420.04 | 2004 Jul 4 | 4.480.04 | 2004 Apr 11 |
| J110713307743498 | CHXR 22E | sat | sat | 9.360.03 | 9.370.03 | 2004 Feb 19 | 6.800.04 | 2004 Apr 8 |
| 9.600.02 | 9.460.02 | 9.400.03 | 9.380.03 | 2004 Jun 10 | 6.850.05 | 2005 Feb 27 | ||
| sat | sat | 9.320.03 | 9.380.04 | 2004 Sep 2 | 6.910.04 | 2005 May 11 | ||
| J110716227723068 | ISO 97 | 9.570.02 | 8.840.02 | 8.230.03 | 7.470.04 | 2004 Jun 10 | 3.830.04 | 2005 Feb 27 |
| J110716687735532 | Cha H 1 | sat | sat | 10.660.03 | 9.610.04 | 2004 Feb 19 | 6.010.04 | 2005 Feb 27 |
| 11.540.02 | 11.180.02 | 10.740.03 | 9.830.04 | 2004 Jun 10 | 6.010.04 | 2005 May 17 | ||
| sat | sat | 10.740.03 | 9.780.03 | 2004 Sep 2 | ||||
| J110718607732516 | Cha H 9 | sat | sat | 10.110.03 | 9.590.04 | 2004 Feb 19 | 7.010.04 | 2004 Feb 3 |
| 10.960.02 | 10.540.02 | 10.170.03 | 9.610.03 | 2004 Jun 10 | 7.100.04 | 2005 Feb 27 | ||
| sat | sat | 10.160.03 | 9.580.03 | 2004 Sep 2 | 7.020.04 | 2005 May 17 | ||
| J110719157603048 | T25 | out | 9.600.02 | out | 9.480.03 | 2006 Jul 10 | out | |
| J110720407729403 | ISO 99 | 9.970.02 | 9.900.02 | 9.930.03 | 9.880.04 | 2004 Jun 10 | 10.040.10 | 2004 Feb 3 |
| 9.940.10 | 2005 Feb 27 | |||||||
| J110720747738073 | T26 | sat | sat | 4.690.03 | 4.160.04 | 2004 Jun 10 | 1.090.04 | 2005 Feb 27 |
| 0.990.04 | 2005 May 17 | |||||||
| J110721427722117 | B35 | 9.500.02 | 8.860.02 | 8.210.03 | 7.260.04 | 2004 Jun 10 | 3.610.04 | 2005 Feb 27 |
| J110724437743489 | [LES2004] 429 | sat | sat | 11.070.03 | 11.080.03 | 2004 Feb 19 | 11.060.24 | 2004 Apr 8 |
| 11.350.02 | 11.190.02 | 11.110.03 | 11.110.04 | 2004 Jun 10 | 11.060.37 | 2005 May 11 | ||
| sat | sat | 11.100.03 | 11.120.04 | 2004 Sep 2 | ||||
| Cha J110726477742408 | 14.780.02 | 14.630.03 | 14.470.04 | 14.400.05 | 2004 Feb 19 | 2005 Feb 27 | ||
| 14.810.02 | 14.620.02 | 14.420.06 | 14.340.05 | 2004 Sep 2 | ||||
| J110728257652118 | T27 | 9.020.02 | out | 8.370.03 | out | 2004 Jul 4 | out | |
| J110735197734493 | CHXR 76 | sat | sat | 10.380.03 | 10.370.04 | 2004 Feb 19 | 9.220.07 | 2004 Feb 3 |
| 10.540.02 | 10.430.02 | 10.370.03 | 10.460.04 | 2004 Jun 10 | 9.110.08 | 2005 Feb 27 | ||
| sat | sat | 10.410.03 | 10.390.03 | 2004 Sep 2 | 9.130.08 | 2005 May 17 | ||
| J110736867733335 | CHXR 26 | sat | sat | 8.580.03 | 8.600.04 | 2004 Feb 19 | 8.210.05 | 2004 Feb 3 |
| 8.770.02 | 8.660.02 | 8.600.03 | 8.540.03 | 2004 Jun 10 | 8.430.06 | 2005 Feb 27 | ||
| sat | sat | 8.640.03 | 8.610.04 | 2004 Sep 2 | 8.340.05 | 2005 May 17 | ||
| J110737757735308 | Cha H 7 | 11.880.02 | 11.750.02 | 11.680.03 | 11.660.04 | 2004 Feb 19 | 2005 Feb 27 | |
| 11.870.02 | 11.680.02 | 11.770.04 | 11.660.04 | 2004 Jun 10 | ||||
| sat | sat | 11.680.03 | 11.580.03 | 2004 Sep 2 | ||||
| J110738327747168 | ESO H 560 | 10.680.02 | out | 10.570.03 | out | 2004 Jun 10 | 9.630.09 | 2004 Apr 8 |
| 9.600.22 | 2005 Feb 27 | |||||||
| J110738407552519 | 11.480.02 | 11.370.02 | 11.360.03 | 11.360.04 | 2006 Jul 10 | 2007 Jun 6 | ||
| J110742457733593 | Cha H 2 | sat | sat | 9.200.03 | 8.600.04 | 2004 Feb 19 | 5.980.05 | 2004 Feb 3 |
| 9.960.02 | 9.580.02 | 9.220.03 | 8.610.04 | 2004 Jun 10 | 6.100.04 | 2005 Feb 27 | ||
| sat | sat | 9.170.03 | 8.580.04 | 2004 Sep 2 | 6.170.04 | 2005 May 17 | ||
| J110743667739411 | T28 | 7.340.02 | 7.010.02 | 6.820.03 | 6.200.04 | 2004 Jun 10 | 3.320.05 | 2005 Feb 27 |
| 3.090.04 | 2005 May 17 | |||||||
| J110746107740089 | Cha H 8 | sat | sat | 10.900.03 | 10.820.03 | 2004 Feb 19 | 2005 Feb 27 | |
| 11.030.02 | 10.900.02 | 10.900.03 | 10.810.04 | 2004 Jun 10 | ||||
| sat | sat | 10.870.03 | 10.890.04 | 2004 Sep 2 | ||||
| J110746567615174 | CHSM 10862 | 11.470.02 | 11.100.02 | 10.750.03 | 10.210.04 | 2006 Jul 10 | 7.000.04 | 2004 Apr 11 |
| J110752257736569 | Cha H 3 | sat | sat | 10.470.03 | 10.480.03 | 2004 Feb 19 | 10.010.26 | 2005 May 17 |
| 10.700.02 | 10.570.02 | 10.470.03 | 10.490.03 | 2004 Jun 10 | ||||
| sat | sat | 10.570.03 | 10.500.04 | 2004 Sep 2 | ||||
| J110755887727257 | CHXR 28 | 7.470.02 | 7.490.02 | 7.470.03 | 7.430.03 | 2004 Jun 10 | 7.220.04 | 2005 Feb 27 |
| J110757307717262 | CHXR 30B | out | 7.880.02 | out | 6.960.03 | 2004 Jun 10 | 3.880.04 | 2005 Feb 27 |
| J110757927738449 | T29 | 6.030.02 | 5.210.02 | 4.490.03 | 3.620.04 | 2004 Jun 10 | sat | 2005 May 17 |
| J110758097742413 | T30 | 8.580.02 | 8.160.02 | 7.930.03 | 7.290.04 | 2004 Jun 10 | 4.530.11 | 2004 Apr 8 |
| 4.410.11 | 2005 Feb 27 | |||||||
| J110759937715317 | ESO H 561 | out | 10.600.02 | out | 10.580.04 | 2004 Jun 10 | 2005 Feb 27 | |
| J110800027717304 | CHXR 30A | out | 8.380.02 | out | 7.630.04 | 2004 Jun 10 | 5.220.11 | 2005 Feb 27 |
| J110801487742288 | T31 | 6.200.02 | 5.830.02 | 5.660.03 | 5.090.04 | 2004 Jun 10 | 1.890.04 | 2004 Apr 8 |
| 1.830.11 | 2005 Feb 27 | |||||||
| J110802347640343 | [LES2004] 717 | 11.510.02 | 11.390.02 | 11.410.03 | 11.310.04 | 2004 Jul 4 | 2004 Apr 11 | |
| J110802977738425 | ISO 126 | 6.790.02 | 6.120.02 | 5.470.03 | 4.720.04 | 2004 Jun 10 | sat | 2005 Feb 27 |
| J110803297739174 | T32 | sat | sat | 3.870.03 | 2.720.04 | 2004 Jun 10 | sat | 2005 May 17 |
| J110806097739406 | 14.370.18 | 14.150.20 | 2004 Feb 19 | 2005 Feb 27 | ||||
| 13.770.06 | 13.810.07 | 2004 Jun 10 | ||||||
| 14.240.08 | 14.520.16 | 2004 Sep 2 | ||||||
| J110815097733531 | T33A | sat | sat | 4.170.03 | 3.190.03 | 2004 Jun 10 | sat | 2005 May 17 |
| J110816487744371 | T34 | sat | sat | 9.730.03 | 9.710.03 | 2004 Feb 19 | 2004 Apr 8 | |
| 9.780.02 | 9.750.02 | 9.680.03 | 9.780.04 | 2004 Jun 10 | ||||
| sat | sat | 9.760.03 | 9.730.04 | 2004 Sep 2 | ||||
| J110817037744118 | Cha H 13 | sat | sat | 10.120.03 | 10.100.03 | 2004 Feb 19 | 2005 Feb 27 | |
| 10.250.02 | 10.180.02 | 10.130.03 | 10.150.04 | 2004 Jun 10 | ||||
| sat | sat | 10.100.03 | 10.080.03 | 2004 Sep 2 | ||||
| J110818507730408 | ISO 138 | 12.510.02 | 12.220.02 | 12.060.03 | 11.390.03 | 2004 Feb 19 | 7.940.05 | 2004 Feb 3 |
| 12.500.02 | 12.200.02 | 11.920.04 | 11.510.11 | 2004 Jun 10 | 8.110.06 | 2005 Feb 27 | ||
| out | 12.150.02 | out | 11.260.04 | 2004 Sep 2 | ||||
| J110818967739170 | Cha H 4 | sat | sat | 10.500.03 | 10.500.05 | 2004 Feb 19 | 2005 Feb 27 | |
| 10.670.02 | 10.590.02 | 10.480.04 | 2004 Jun 10 | |||||
| sat | sat | 10.510.04 | bad | 2004 Sep 2 | ||||
| Cha J110819387731522 | 16.180.02 | 15.870.02 | 15.650.05 | 14.760.07 | 2004 Feb 19 | 6.790.04 | 2004 Feb 3 | |
| 16.110.07 | 15.760.11 | 2004 Jun 10 | 6.780.04 | 2005 Feb 27 | ||||
| 16.130.02 | 15.790.03 | 15.800.10 | 14.690.09 | 2004 Sep 2 | ||||
| J110822387730277 | ISO 143 | sat | sat | 9.500.03 | 8.780.04 | 2004 Feb 19 | 6.170.04 | 2004 Feb 3 |
| 10.310.02 | 9.850.02 | 9.560.03 | 8.780.04 | 2004 Jun 10 | 6.210.04 | 2005 Feb 27 | ||
| J110824047739299 | Cha H 10 | 12.750.02 | 12.620.02 | 12.590.04 | 12.590.08 | 2004 Feb 19 | 2005 Feb 27 | |
| 12.790.02 | 12.630.02 | 12.430.06 | 12.560.11 | 2004 Jun 10 | ||||
| 12.760.02 | 12.600.02 | 12.540.04 | 12.620.07 | 2004 Sep 2 | ||||
| J110824107741473 | Cha H 5 | sat | sat | 10.080.03 | 10.100.03 | 2004 Feb 19 | 2005 Feb 27 | |
| 10.300.02 | 10.140.02 | 10.100.03 | 10.130.04 | 2004 Jun 10 | ||||
| sat | sat | 10.080.03 | 10.100.03 | 2004 Sep 2 | ||||
| J110825707716396 | out | 13.010.02 | out | 11.980.04 | 2004 Jun 10 | 9.720.10 | 2005 Feb 27 | |
| J110826507715550 | ISO 147 | out | 11.270.02 | out | 10.330.04 | 2004 Jun 10 | 7.600.05 | 2005 Feb 27 |
| J110829277739198 | Cha H 11 | 12.940.02 | 12.690.02 | 12.450.04 | 11.970.04 | 2004 Feb 19 | 2005 Feb 27 | |
| 12.910.02 | 12.760.02 | 12.240.08 | 12.160.05 | 2004 Jun 10 | ||||
| 12.980.02 | 12.730.02 | 12.490.04 | 12.290.07 | 2004 Sep 2 | ||||
| Cha J110830407731387 | 15.110.02 | 14.940.02 | 14.680.04 | 14.590.05 | 2004 Feb 19 | 2004 Feb 3 | ||
| 15.140.03 | 14.850.04 | 2004 Jun 10 | ||||||
| 15.140.02 | 14.950.02 | 14.950.04 | 14.710.07 | 2004 Sep 2 | ||||
| J110838967743513 | IRN | 7.370.04 | 6.310.02 | 5.220.03 | 3.660.04 | 2004 Jun 10 | sat | 2005 Feb 27 |
| J110839057716042 | T35 | out | 8.110.02 | out | 7.890.04 | 2004 Jun 10 | 4.450.04 | 2005 Feb 27 |
| J110839527734166 | Cha H 6 | sat | sat | 9.860.03 | 9.320.04 | 2004 Feb 19 | 6.690.04 | 2005 Feb 27 |
| 10.410.02 | 10.090.02 | 9.930.03 | 9.360.04 | 2004 Jun 10 | 6.770.04 | 2005 May 17 | ||
| sat | sat | 9.770.03 | 9.350.03 | 2004 Sep 2 | ||||
| J110840697636078 | CHXR 33 | 9.050.02 | 8.980.02 | 8.940.03 | 8.960.04 | 2004 Jul 4 | 8.820.07 | 2004 Apr 11 |
| sat | sat | 8.890.03 | 8.940.04 | 2005 May 9 | ||||
| J110842967743500 | 11.680.13 | 10.980.11 | 9.540.10 | 2004 Feb 19 | 2004 Apr 8 | |||
| 12.340.15 | 11.650.15 | 11.010.10 | 9.430.10 | 2004 Jun 10 | ||||
| 12.390.14 | 11.550.10 | 2004 Sep 2 | ||||||
| J110849527638443 | 13.610.02 | 13.220.02 | 12.860.05 | 12.120.04 | 2004 Jul 4 | 9.790.08 | 2004 Apr 11 | |
| 13.700.02 | 13.210.02 | 12.880.03 | 12.290.04 | 2005 May 9 | ||||
| J110850907625135 | T37 | 10.680.02 | 10.340.02 | 9.960.03 | 9.410.03 | 2004 Jul 4 | 7.060.04 | 2004 Apr 11 |
| sat | sat | 9.980.03 | 9.390.03 | 2005 May 9 | ||||
| J110851767632502 | [LES2004] 737 | 12.430.02 | 12.290.02 | 12.270.05 | 12.320.06 | 2004 Jul 4 | 2005 Apr 9 | |
| 12.420.02 | 12.310.02 | 12.190.03 | 12.260.04 | 2005 May 9 | ||||
| J110852427519027 | RX J1108.87519B | 8.960.02 | 8.700.02 | 8.540.03 | 7.930.03 | 2004 Jul 21 | 5.270.04 | 2005 Feb 27 |
| J110853267519374 | RX J1108.87519A | 8.620.02 | 8.560.02 | 8.510.03 | 8.500.03 | 2004 Jul 21 | 8.460.06 | 2005 Feb 27 |
| J110854217732115 | CHXR 78C | sat | sat | 10.630.03 | 10.650.04 | 2004 Feb 19 | 10.170.19 | 2004 Feb 3 |
| 10.800.02 | 10.650.02 | 10.590.03 | 10.630.04 | 2004 Jun 10 | 10.980.52 | 2005 Feb 27 | ||
| sat | sat | 10.610.03 | 10.600.03 | 2004 Sep 2 | ||||
| J110854647702129 | T38 | out | out | out | out | 4.090.04 | 2007 Jun 6 | |
| J110854977632410 | ISO 165 | 10.660.02 | 10.340.02 | 9.960.03 | 9.520.04 | 2004 Jul 4 | 7.070.05 | 2004 Apr 11 |
| sat | sat | 9.960.03 | 9.500.03 | 2005 May 9 | ||||
| J110855967727132 | ISO 167 | 11.070.02 | 10.950.02 | 10.850.03 | 10.890.04 | 2004 Jun 10 | 10.290.16 | 2004 Feb 3 |
| J110911727729124 | T39A | sat | out | 8.500.03 | out | 2004 Feb 19 | 8.080.05 | 2004 Feb 3 |
| 8.640.02 | 8.600.02 | 8.590.03 | 8.540.04 | 2004 Jun 10 | 8.180.06 | 2005 Feb 27 | ||
| Cha J110913637734446 | 14.580.02 | 14.330.02 | 14.090.04 | 13.580.05 | 2004 Feb 19 | 2005 Feb 27 | ||
| 14.610.03 | 14.330.04 | 13.960.08 | 13.420.09 | 2004 Jun 10 | ||||
| 14.620.02 | 14.280.02 | 14.050.03 | 13.570.05 | 2004 Sep 2 | ||||
| J110913807628396 | CHXR 35 | 10.550.02 | 10.440.02 | 10.400.03 | 10.400.04 | 2004 Jul 4 | 10.090.20 | 2004 Apr 11 |
| sat | sat | 10.370.03 | 10.370.03 | 2005 May 9 | 10.230.10 | 2004 Aug 3 | ||
| J110917697627578 | CHXR 37 | 8.440.02 | 8.450.02 | 8.330.03 | 8.320.03 | 2004 Jul 4 | 8.190.06 | 2004 Apr 11 |
| sat | sat | 8.340.03 | 8.380.04 | 2005 May 9 | 8.220.05 | 2004 Aug 3 | ||
| J110918127630292 | CHXR 79 | 7.920.02 | 7.430.02 | 7.150.03 | 6.500.04 | 2004 Jul 4 | 3.570.04 | 2004 Apr 11 |
| 3.550.04 | 2004 Aug 3 | |||||||
| 3.570.04 | 2005 Apr 9 | |||||||
| J110922667634320 | C1-6 | 7.220.02 | 6.510.02 | 6.030.03 | 5.170.04 | 2004 Jul 4 | 1.460.04 | 2004 Apr 11 |
| 1.800.04 | 2005 Apr 9 | |||||||
| J110923797623207 | T40 | 7.110.02 | 6.560.02 | 6.220.03 | 5.560.03 | 2004 Jul 4 | 3.330.04 | 2004 Apr 11 |
| J110928557633281 | ISO 192 | 8.470.02 | 6.970.02 | 5.860.03 | 4.580.03 | 2004 Jul 4 | 0.390.04 | 2004 Apr 11 |
| J110929137659180 | [LES2004] 602 | 11.730.02 | 11.620.02 | 11.590.03 | 11.590.04 | 2006 Jul 10 | 2007 Jun 6 | |
| J110935437731390 | 13.800.02 | out | 13.550.03 | out | 2004 Feb 19 | 2004 Feb 3 | ||
| 13.820.02 | 13.630.03 | 13.520.07 | 13.390.09 | 2004 Jun 10 | ||||
| out | 13.680.02 | out | 13.570.04 | 2004 Sep 2 | ||||
| J110940067628391 | CHXR 40 | 8.760.02 | 8.760.02 | 8.700.03 | 8.670.03 | 2004 Jul 4 | 8.430.05 | 2004 Apr 11 |
| sat | sat | 8.750.03 | 8.720.04 | 2005 May 9 | 8.330.05 | 2004 Aug 3 | ||
| J110941927634584 | C1-25 | 8.530.02 | 7.950.02 | 7.380.03 | 6.660.04 | 2004 Jul 4 | 3.260.04 | 2004 Apr 11 |
| 3.130.04 | 2005 Apr 9 | |||||||
| J110942607725578 | C7-1 | 9.600.02 | 9.180.02 | 9.080.03 | 8.900.04 | 2004 Jun 10 | 6.660.04 | 2004 Feb 3 |
| 6.570.04 | 2005 Feb 27 | |||||||
| J110945257740332 | ESO H 566 | sat | sat | 10.360.03 | 10.350.04 | 2004 Feb 19 | 9.820.18 | 2005 Feb 27 |
| 10.550.02 | 10.400.02 | 10.390.03 | 10.390.04 | 2004 Jun 10 | ||||
| sat | sat | 10.420.03 | 10.370.04 | 2004 Sep 2 | ||||
| J110946217634463 | Hn 10E | 9.490.02 | 8.920.02 | 8.460.03 | 7.590.04 | 2004 Jul 4 | 3.700.06 | 2004 Apr 11 |
| sat | sat | 8.410.03 | sat | 2005 May 9 | 3.580.07 | 2005 Apr 9 | ||
| J110947427726290 | B43 | 9.040.02 | 8.500.02 | 8.370.03 | 7.820.03 | 2004 Jun 10 | 4.650.04 | 2004 Feb 3 |
| 4.210.04 | 2005 Feb 27 | |||||||
| J110948667714383 | ISO 209 | out | 10.890.02 | out | 9.860.04 | 2004 Jun 10 | 7.080.04 | 2005 Feb 27 |
| J110949187731197 | KG 102 | sat | out | 11.090.03 | out | 2004 Feb 19 | 10.700.38 | 2004 Feb 3 |
| 11.220.02 | 11.060.02 | 11.090.03 | 11.050.04 | 2004 Jun 10 | 10.130.14 | 2005 Feb 27 | ||
| out | 11.080.02 | out | 11.000.03 | 2004 Sep 2 | ||||
| J110950037636476 | T41 | 7.080.02 | 7.050.02 | 6.720.08 | extended | 2004 Jul 4 | extended | 2004 Apr 11 |
| J110952157639128 | ISO 217 | 10.800.02 | 10.290.02 | 9.830.03 | 9.160.03 | 2004 Jul 4 | 6.710.04 | 2004 Apr 11 |
| sat | sat | 8.950.03 | 8.300.04 | 2005 May 9 | ||||
| J110952627740348 | CHSM 15991 | 12.670.02 | 11.970.02 | 11.130.03 | 10.060.04 | 2004 Feb 19 | 7.210.05 | 2005 Feb 27 |
| 11.980.02 | 11.370.02 | 10.710.03 | 9.870.03 | 2004 Jun 10 | ||||
| 12.640.02 | 11.880.02 | 11.100.03 | 10.100.04 | 2004 Sep 2 | ||||
| J110953367728365 | ISO 220 | sat | out | 10.750.03 | out | 2004 Feb 19 | 7.250.04 | 2004 Feb 3 |
| 11.390.02 | 10.980.02 | 10.640.03 | 10.010.03 | 2004 Jun 10 | 7.250.04 | 2005 Feb 27 | ||
| J110953407634255 | T42 | sat | sat | 3.720.03 | 3.040.03 | 2004 Jul 4 | sat | 2004 Apr 11 |
| J110954077629253 | T43 | 8.550.02 | 8.140.02 | 7.620.03 | 6.830.04 | 2004 Jul 4 | 3.760.04 | 2004 Apr 11 |
| 3.580.04 | 2004 Aug 3 | |||||||
| 3.740.04 | 2005 Apr 9 | |||||||
| J110954377631113 | ISO 225 | 11.220.02 | 10.350.02 | 9.610.03 | 8.700.04 | 2004 Jul 4 | 4.850.04 | 2004 Apr 11 |
| sat | sat | 9.600.03 | 8.580.03 | 2005 May 9 | 5.020.04 | 2005 Apr 9 | ||
| J110955057632409 | C1-2 | 7.900.02 | 7.150.02 | 6.750.03 | 5.960.03 | 2004 Jul 4 | 2.190.04 | 2004 Apr 11 |
| 2.140.04 | 2005 Apr 9 | |||||||
| J110958737737088 | T45 | 6.990.02 | 6.500.02 | 6.160.03 | 5.520.04 | 2004 Jun 10 | 3.170.04 | 2005 Feb 27 |
| J111000107634578 | T44 | sat | sat | 3.700.03 | 3.150.04 | 2004 Jul 4 | sat | 2004 Apr 11 |
| J111001927725451 | [LES2004] 419 | 11.460.02 | 11.240.02 | 11.240.03 | 11.220.04 | 2004 Jun 10 | 2005 Feb 27 | |
| J111003697633291 | Hn 11 | 8.180.02 | 7.520.02 | 6.840.03 | 6.040.04 | 2004 Jul 4 | 3.230.04 | 2004 Apr 11 |
| 3.200.04 | 2005 Apr 9 | |||||||
| J111004697635452 | T45A | 8.700.02 | 8.410.02 | 8.100.03 | 7.550.03 | 2004 Jul 4 | 4.580.04 | 2004 Apr 11 |
| sat | sat | 8.370.03 | sat | 2005 May 9 | 4.380.05 | 2005 Apr 9 | ||
| J111006587642486 | 14.470.03 | 14.270.03 | 14.290.11 | 2004 Jul 4 | 2004 Apr 8 | |||
| 14.410.02 | 14.290.02 | 14.080.03 | 14.150.06 | 2005 May 9 | ||||
| J111007047629376 | T46 | 7.690.02 | 7.290.02 | 6.820.03 | 5.970.03 | 2004 Jul 4 | 3.540.04 | 2004 Apr 11 |
| 3.640.04 | 2005 Apr 9 | |||||||
| J111007857727480 | ISO 235 | 10.480.02 | 10.050.02 | 9.600.03 | 8.860.03 | 2004 Jun 10 | 6.380.04 | 2004 Feb 3 |
| 6.380.04 | 2005 Feb 27 | |||||||
| J111009347632178 | OTS 44 | 13.690.02 | 13.220.02 | 12.680.05 | 12.100.05 | 2004 Jul 4 | 8.810.11 | 2004 Apr 11 |
| 13.670.02 | 13.170.02 | 12.650.03 | 12.030.03 | 2005 May 9 | 9.650.20 | 2005 Apr 9 | ||
| J111011417635292 | ISO 237 | 8.070.02 | 7.550.02 | 7.040.03 | 6.180.03 | 2004 Jul 4 | 2.330.04 | 2004 Apr 11 |
| 2.270.04 | 2005 Apr 9 | |||||||
| J111011537733521 | sat | out | 10.370.03 | out | 2004 Feb 19 | 10.270.20 | 2005 Feb 27 | |
| 10.470.02 | 10.470.02 | 10.360.03 | 10.390.04 | 2004 Jun 10 | ||||
| out | sat | out | 10.370.04 | 2004 Sep 2 | ||||
| J111022267625138 | CHSM 17173 | 11.970.02 | 11.870.02 | 11.780.04 | 11.820.05 | 2004 Jul 4 | 2004 Apr 11 | |
| 11.950.02 | 11.840.02 | 11.730.03 | 11.790.04 | 2005 May 9 | ||||
| J111028527716596 | Hn 12W | out | 10.230.02 | out | 10.260.04 | 2004 Jun 10 | 10.000.09 | 2005 Feb 27 |
| J111034817722053 | [LES2004] 405 | 9.600.02 | 9.430.02 | 9.420.03 | 9.420.04 | 2004 Jun 10 | 9.190.10 | 2005 Feb 27 |
| J111036447722131 | ISO 250 | 10.150.02 | 9.940.02 | 9.880.03 | 9.940.04 | 2004 Jun 10 | 2005 Feb 27 | |
| J111038017732399 | CHXR 47 | 7.660.02 | 7.390.02 | 6.950.03 | 6.260.04 | 2004 Jun 10 | 3.520.04 | 2005 Feb 27 |
| J111040067630547 | 12.840.02 | 12.720.02 | 12.640.05 | 12.630.07 | 2004 Jul 4 | 2005 Apr 9 | ||
| 12.830.02 | 12.650.02 | 12.600.03 | 12.660.04 | 2005 May 9 | ||||
| J111041417720480 | ISO 252 | 11.450.02 | 11.020.02 | 10.570.03 | 9.750.03 | 2004 Jun 10 | 7.050.04 | 2005 Feb 27 |
| J111049597717517 | T47 | out | 8.130.02 | out | 6.370.04 | 2004 Jun 10 | 2.960.04 | 2005 Feb 27 |
| J111050767718031 | ESO H 568 | out | 10.260.02 | out | 10.220.05 | 2004 Jun 10 | 2005 Feb 27 | |
| J111053337634319 | T48 | 9.140.02 | 8.560.02 | 8.250.03 | 7.330.03 | 2004 Jul 4 | 4.520.04 | 2004 Apr 11 |
| sat | sat | 8.300.03 | sat | 2005 May 9 | 4.660.05 | 2005 Apr 9 | ||
| J111053597725004 | ISO 256 | 9.500.02 | 8.930.02 | 8.610.03 | 7.740.04 | 2004 Jun 10 | 4.890.11 | 2005 Feb 27 |
| J111055977645325 | Hn 13 | 9.260.02 | 8.840.02 | 8.450.03 | 7.860.03 | 2004 Jul 4 | 5.020.04 | 2004 Apr 8 |
| 9.290.02 | 8.900.02 | 8.530.03 | 7.930.04 | 2004 Jul 21 | 5.060.04 | 2004 Apr 11 | ||
| sat | out | 8.520.03 | out | 2005 May 9 | ||||
| J111110837641574 | ESO H 569 | 14.210.03 | 13.760.03 | 13.230.06 | 12.500.05 | 2004 Jul 4 | 7.120.04 | 2004 Apr 8 |
| 13.920.02 | 13.480.03 | 13.080.08 | 12.190.05 | 2004 Jul 21 | 7.300.05 | 2004 Apr 11 | ||
| 14.160.02 | out | 13.170.03 | out | 2005 May 9 | ||||
| J111122497745427 | [LES2004] 436 | 13.570.02 | out | 12.800.05 | out | 2004 Jun 10 | out | |
| J111122607705538 | ISO 274 | out | out | out | out | 10.340.29 | 2007 Jun 6 | |
| J111134747636211 | CHXR 48 | 9.500.02 | 9.470.02 | 9.410.03 | 9.410.03 | 2004 Jul 4 | 9.150.06 | 2004 Apr 11 |
| sat | sat | 9.470.03 | 9.430.03 | 2005 May 9 | 9.740.20 | 2004 Jul 8 | ||
| J111139657620152 | T49 | out | 7.920.02 | out | 6.860.03 | 2004 Jul 4 | 3.750.04 | 2004 Apr 11 |
| 3.720.04 | 2004 Aug 3 | |||||||
| J111145337636505 | [LES2004] 743 | 13.310.02 | 12.920.02 | 12.700.05 | 12.150.05 | 2004 Jul 4 | 9.710.10 | 2004 Apr 11 |
| 13.320.02 | 12.980.02 | 12.650.03 | 12.200.03 | 2005 May 9 | 9.010.13 | 2004 Jul 8 | ||
| J111146327620092 | CHX 18N | out | 6.740.02 | out | 6.260.03 | 2004 Jul 4 | 3.880.04 | 2004 Apr 11 |
| 3.720.04 | 2004 Aug 3 | |||||||
| J111154007619311 | CHXR 49NE | out | 8.900.02 | out | 8.850.03 | 2004 Jul 4 | 8.540.06 | 2004 Aug 3 |
| J111202887722483 | 12.050.02 | 11.930.02 | 11.910.04 | 11.800.05 | 2004 Jun 10 | 2004 Feb 3 | ||
| 12.070.02 | out | 11.890.03 | out | 2006 Jul 10 | ||||
| J111203277637034 | CHXR 84 | 10.390.02 | 10.270.02 | 10.230.03 | 10.290.04 | 2004 Jul 4 | 9.810.15 | 2004 Apr 11 |
| out | 10.280.02 | out | 10.290.04 | 2004 Jul 21 | 9.810.14 | 2004 Jul 8 | ||
| sat | sat | 10.220.03 | 10.290.04 | 2005 May 9 | ||||
| J111203517726009 | ISO 282 | 10.740.02 | 10.440.02 | 10.190.03 | 9.630.04 | 2004 Jun 10 | 7.020.04 | 2005 Feb 27 |
| J111209847634366 | T50 | 9.350.02 | 9.030.02 | 8.740.03 | 8.090.04 | 2004 Jul 4 | 5.170.04 | 2004 Apr 11 |
| sat | sat | 8.800.03 | 8.130.04 | 2005 May 9 | 5.100.04 | 2004 Jul 8 | ||
| J111222507714512 | 13.860.02 | 13.710.02 | 13.530.04 | 12.930.04 | 2006 Jul 10 | 10.130.15 | 2005 Feb 27 | |
| J111224417637064 | T51 | 7.280.02 | 6.720.02 | 6.290.03 | 5.300.04 | 2004 Jul 4 | 3.400.04 | 2004 Apr 11 |
| out | 6.750.02 | out | 5.320.04 | 2004 Jul 21 | 3.450.04 | 2004 Jul 8 | ||
| J111227727644223 | T52 | 5.930.02 | 5.570.02 | 5.240.03 | 4.560.04 | 2004 Jul 4 | 1.190.04 | 2004 Apr 11 |
| J111230927644241 | T53 | 8.190.02 | 7.730.02 | 7.420.03 | 6.540.04 | 2004 Jul 4 | 2004 Apr 11 | |
| J111230997653342 | [LES2004] 601 | 12.580.02 | 12.480.02 | 12.450.03 | 12.390.03 | 2006 Jul 10 | 2004 Apr 11 | |
| J111242107658400 | CHXR 54 | sat | out | 9.350.03 | out | 2006 Jul 10 | out | |
| J111242687722230 | T54 | out | out | out | out | 4.810.04 | 2004 Feb 3 | |
| 4.840.04 | 2005 Feb 27 | |||||||
| J111242997637049 | CHXR 55 | 9.200.02 | 9.190.02 | 9.170.03 | 9.140.04 | 2004 Jul 4 | 8.940.06 | 2004 Apr 11 |
| out | 9.140.02 | out | 9.090.03 | 2004 Jul 21 | 9.120.13 | 2004 Jul 8 | ||
| sat | out | 9.080.03 | out | 2005 May 9 | 8.980.07 | 2005 Apr 9 | ||
| J111248617647066 | Hn 17 | out | 10.350.02 | out | 9.300.04 | 2006 Jul 10 | 7.000.04 | 2004 Apr 11 |
| J111324467629227 | Hn 18 | 10.070.02 | 9.700.02 | 9.400.03 | 8.860.03 | 2004 Jul 4 | 5.950.04 | 2004 Apr 11 |
| J111327377634165 | CHXR 59 | 9.470.02 | 9.410.02 | 9.370.03 | 9.390.03 | 2004 Jul 4 | 9.240.07 | 2004 Apr 11 |
| 9.270.08 | 2005 Apr 9 | |||||||
| J111329707629012 | CHXR 60 | 10.290.02 | 10.180.02 | 10.150.03 | 10.260.04 | 2004 Jul 4 | 10.140.17 | 2004 Apr 11 |
| J111333567635374 | T55 | 10.410.02 | 10.350.02 | 10.300.03 | 10.340.04 | 2004 Jul 4 | 10.060.17 | 2004 Apr 11 |
| sat | out | 10.280.03 | out | 2005 May 9 | 9.760.10 | 2005 Apr 9 | ||
| J111415657627364 | CHXR 62 | 9.810.02 | 9.770.02 | 9.760.03 | 9.720.03 | 2004 Jul 4 | 9.030.10 | 2004 Apr 11 |
| J111424547733062 | Hn 21W | 10.060.04 | 9.840.04 | 9.540.04 | 8.960.04 | 2006 Jul 10 | 6.420.04 | 2005 Feb 27 |
| J111426117733042 | Hn 21E | 11.010.04 | 10.890.04 | 10.790.06 | 10.570.08 | 2006 Jul 10 | 2005 Feb 27 | |
| J111429067625399 | ESO H 571 | out | 11.200.02 | out | 11.220.04 | 2004 Jul 4 | 2004 Apr 11 | |
| J111450317733390 | B53 | 9.350.02 | 9.280.02 | 9.260.03 | 9.240.03 | 2006 Jul 10 | 9.060.05 | 2005 Feb 27 |
| J111521807724042 | ESO H 572 | out | 10.390.02 | out | 10.370.04 | 2006 Jul 10 | 10.370.16 | 2005 Feb 27 |
| J111737927646193 | 12.210.02 | 12.090.02 | 12.070.03 | 12.030.03 | 2006 Jul 10 | 2004 Apr 11 | ||
| J111820247621576 | CHXR 68A | out | out | out | out | 8.380.11 | 2007 Jun 6 | |
| J111833797643041 | 10.010.02 | 9.900.02 | 9.900.03 | 9.860.03 | 2006 Jul 10 | 9.870.15 | 2007 Jun 6 | |
| J111942147623326 | 11.420.02 | 11.310.02 | 11.300.03 | 11.340.04 | 2006 Jul 10 | 2007 Jun 6 | ||
| J111956527504529 | 12.470.02 | 12.360.02 | 12.320.03 | 12.390.04 | 2006 Jul 10 | 2007 Jun 6 | ||
| J112411867630425 | 11.560.02 | 11.400.02 | 11.330.03 | 10.880.04 | 2006 Jul 10 | out | ||
| J112429807554237 | 9.610.02 | 9.540.02 | 9.540.03 | 9.500.03 | 2006 Jul 10 | 9.360.11 | 2007 Jun 6 | |
| J112912617546263 | RX J1129.27546 | 8.780.02 | 8.760.02 | 8.790.03 | 8.720.04 | 2004 Jul 21 | 8.270.20 | 2005 Mar 6 |
| J113323277622092 | 9.440.02 | 9.360.02 | 9.330.03 | 9.310.03 | 2006 Jul 10 | 9.150.10 | 2007 Jun 6 |
Note. — Entries of “”, “sat”, “out”, and “bad” indicate measurements that are absent because of non-detection, saturation, a position outside the field of view of the filter, and contamination by a cosmic ray or a ghost from a bright star, respectively.
| Name | (2-8 µm) | (2-24 µm) | (3.6-8 µm) | (3.6-24 µm) | SED Class |
|---|---|---|---|---|---|
| 2M J105236947440287 | 2.60 | 2.51 | 2.81 | 2.58 | III |
| 2M J105805977711501 | 1.76 | 1.78 | II | ||
| 2M J110113707722387 | 2.45 | 2.73 | III | ||
| 2M J110119267732383 | 2.24 | 2.62 | III | ||
| 2M J110132057718249 | 2.31 | 2.65 | III | ||
| 2M J110219277536576 | 2.55 | 2.56 | 2.77 | 2.66 | III |
| 2M J110224917733357 | 2.57 | 0.72 | 2.54 | 0.24 | II |
| 2M J110226107502407 | 2.51 | 2.50 | 2.67 | 2.57 | III |
| 2M J110232657729129 | 1.91 | 1.84 | II | ||
| 2M J110241837724245 | 2.53 | 2.79 | III | ||
| 2M J110255047721508 | 1.50 | 1.13 | 1.55 | 1.05 | II |
| 2M J110341867726520 | 2.41 | 2.66 | III | ||
| 2M J110347647719563 | 2.63 | 2.70 | 2.82 | 2.80 | III |
| 2M J110356827721329 | 2.62 | 2.70 | 2.64 | 2.73 | III |
| 2M J110404257639328 | 0.62 | II | |||
| 2M J110409097627193 | 0.51 | II | |||
| 2M J110410607612490 | 2.38 | 2.67 | III | ||
| 2M J110422757718080 | 0.96 | 0.49 | 0.69 | 0.25 | I |
| 2M J110442587741571 | 1.56 | 0.84 | 1.70 | 0.72 | II |
| 2M J110451007625240 | 2.77 | III | |||
| 2M J110452857625514 | 2.48 | III | |||
| 2M J110457017715569 | 1.81 | II | |||
| 2M J110514677711290 | 2.55 | III | |||
| 2M J110524727626209 | 2.89 | III | |||
| 2M J110543007726517 | 2.41 | 2.58 | 2.66 | 2.72 | III |
| 2M J110552617618255 | 2.67 | III | |||
| 2M J110557807607488 | 2.92 | III | |||
| 2M J110600107507252 | 2.50 | 2.69 | III | ||
| 2M J110615407721567 | 2.70 | 2.62 | 2.73 | 2.62 | III |
| 2M J110615457737501 | 2.71 | 2.82 | 2.82 | 2.89 | III |
| 2M J110625547633418 | 1.43 | 0.59 | 1.36 | 0.35 | II |
| 2M J110628777737331 | 2.64 | 2.60 | 2.77 | 2.64 | III |
| 2M J110629427724586 | 1.31 | 1.37 | 1.40 | 1.42 | II |
| 2M J110632767625210 | 1.58 | 1.12 | 1.46 | 0.96 | II |
| 2M J110637997743090 | 2.34 | 2.50 | 2.64 | 2.66 | III |
| 2M J110639457736052 | 1.03 | 0.63 | 0.94 | 0.49 | II |
| 2M J110641807635489 | 0.64 | 0.82 | 0.46 | 0.79 | II |
| 2M J110643467726343 | 2.67 | 2.65 | 2.82 | 2.72 | III |
| 2M J110645107727023 | 1.56 | 1.26 | 1.12 | 1.00 | II |
| 2M J110646587722325aaSpectral slopes are the observed values without a correction for extinction. | 0.90 | 1.56 | 0.22 | 1.44 | I |
| 2M J110657337742106 | 2.55 | 2.75 | 2.73 | 2.88 | III |
| 2M J110658037722488aaSpectral slopes are the observed values without a correction for extinction. | 1.44 | 0.92 | 0.24 | 0.28 | flat |
| 2M J110659067718535 | 1.53 | 1.05 | 1.02 | 0.71 | II |
| 2M J110659397530559 | 1.64 | 1.59 | II | ||
| 2M J110703247610565 | 2.36 | 2.69 | III | ||
| Cha J110703507631460 | 1.16 | II | |||
| 2M J110703697724307 | 1.36 | 0.67 | 1.02 | 0.35 | II |
| Cha J110707687626326 | 1.03 | 0.77 | 1.13 | 0.74 | II |
| 2M J110709197723049aaSpectral slopes are the observed values without a correction for extinction. | 1.11 | 0.71 | 0.03 | 0.13 | flat |
| 2M J110709257718471 | 1.28 | 0.85 | 1.27 | 0.73 | II |
| 2M J110711487746394 | 2.62 | 2.75 | 2.77 | 2.84 | III |
| 2M J110711817625501 | 1.85 | 1.71 | 1.82 | 1.66 | II |
| 2M J110712067632232 | 1.48 | 1.04 | 1.48 | 0.93 | II |
| 2M J110713307743498 | 2.55 | 1.80 | 2.69 | 1.67 | II |
| 2M J110716227723068aaSpectral slopes are the observed values without a correction for extinction. | 0.24 | 0.15 | 0.43 | 0.15 | flat |
| 2M J110716687735532 | 1.04 | 0.50 | 0.78 | 0.25 | II |
| 2M J110718607732516 | 1.44 | 1.16 | 1.38 | 1.07 | II |
| 2M J110719157603048 | 2.65 | III | |||
| 2M J110720407729403 | 2.52 | 2.80 | 2.74 | 2.97 | III |
| 2M J110720747738073 | 1.42 | 0.92 | II | ||
| 2M J110721427722117aaSpectral slopes are the observed values without a correction for extinction. | 0.15 | 0.05 | 0.26 | 0.08 | flat |
| 2M J110724437743489 | 2.43 | 2.67 | 2.65 | 2.83 | III |
| Cha J110726477742408 | 1.95 | 2.38 | III | ||
| 2M J110735197734493 | 2.50 | 2.23 | 2.75 | 2.27 | III |
| 2M J110736867733335 | 2.58 | 2.68 | 2.79 | 2.79 | III |
| 2M J110737757735308 | 2.26 | 2.60 | III | ||
| 2M J110738327747168 | 2.40 | 2.45 | III | ||
| 2M J110738407552519 | 2.51 | 2.73 | III | ||
| 2M J110742457733593 | 1.46 | 1.23 | 1.36 | 1.13 | II |
| 2M J110743667739411 | 1.51 | 0.99 | 1.63 | 0.91 | II |
| 2M J110746107740089 | 2.38 | 2.67 | III | ||
| 2M J110746567615174 | 1.33 | 0.86 | 1.43 | 0.78 | II |
| 2M J110752257736569 | 2.45 | 2.52 | 2.66 | 2.62 | III |
| 2M J110755887727257 | 2.83 | 2.83 | 2.92 | 2.86 | III |
| 2M J110757307717262 | 1.11 | 0.79 | II | ||
| 2M J110757927738449 | 0.66 | 0.15 | flat | ||
| 2M J110758097742413 | 1.11 | 0.91 | 1.44 | 1.00 | II |
| 2M J110759937715317 | 2.47 | III | |||
| 2M J110800027717304 | 2.18 | 1.63 | II | ||
| 2M J110801487742288 | 1.56 | 0.98 | 1.63 | 0.86 | II |
| 2M J110802347640343 | 2.35 | 2.63 | III | ||
| 2M J110802977738425 | 0.41 | 0.56 | II | ||
| 2M J110803297739174 | 0.58 | II | |||
| 2M J110815097733531 | 0.23 | flat | |||
| 2M J110816487744371 | 2.63 | 2.83 | III | ||
| 2M J110817037744118 | 2.44 | 2.72 | III | ||
| 2M J110818507730408 | 1.56 | 0.91 | 1.50 | 0.72 | II |
| 2M J110818967739170 | 2.45 | 2.67 | III | ||
| Cha J110819387731522 | 1.76 | 0.75 | 1.26 | 1.60 | II |
| 2M J110822387730277 | 1.29 | 1.07 | 1.16 | 0.96 | II |
| 2M J110824047739299 | 2.37 | 2.70 | III | ||
| 2M J110824107741473 | 2.44 | 2.67 | III | ||
| 2M J110825707716396 | 1.16 | 1.13 | II | ||
| 2M J110826507715550 | 1.44 | 1.10 | II | ||
| 2M J110829277739198 | 1.73 | 1.84 | II | ||
| Cha J110830407731387 | 1.84 | 2.24 | III | ||
| 2M J110838967743513aaSpectral slopes are the observed values without a correction for extinction. | 0.84 | 1.44 | I | ||
| 2M J110839057716042 | 2.11 | 1.19 | II | ||
| 2M J110839527734166 | 1.63 | 1.26 | 1.65 | 1.18 | II |
| 2M J110840697636078 | 2.75 | 2.81 | 2.83 | 2.86 | III |
| 2M J110842967743500 | 0.79 | 0.06 | flat | ||
| 2M J110849527638443 | 1.11 | 1.05 | 1.17 | 1.06 | II |
| 2M J110850907625135 | 1.44 | 1.25 | 1.38 | 1.18 | II |
| 2M J110851767632502 | 2.37 | 2.70 | III | ||
| 2M J110852427519027 | 1.77 | 1.31 | 1.66 | 1.14 | II |
| 2M J110853267519374 | 2.58 | 2.75 | 2.71 | 2.86 | III |
| 2M J110854217732115 | 2.45 | 2.52 | 2.70 | 2.65 | III |
| 2M J110854647702129 | 0.88 | II | |||
| 2M J110854977632410 | 1.50 | 1.25 | 1.57 | 1.21 | II |
| 2M J110855967727132 | 2.52 | 2.51 | 2.76 | 2.61 | III |
| 2M J110911727729124 | 2.54 | 2.57 | 2.76 | 2.67 | III |
| Cha J110913637734446 | 1.37 | 1.69 | II | ||
| 2M J110913807628396 | 2.47 | 2.65 | 2.68 | 2.79 | III |
| 2M J110917697627578 | 2.68 | 2.77 | 2.81 | 2.85 | III |
| 2M J110918127630292 | 1.23 | 0.91 | 1.34 | 0.88 | II |
| 2M J110922667634320 | 0.75 | 0.49 | 0.70 | 0.40 | II |
| 2M J110923797623207 | 0.95 | 1.03 | 1.10 | 1.12 | II |
| 2M J110928557633281aaSpectral slopes are the observed values without a correction for extinction. | 1.86 | 1.23 | 1.65 | 0.99 | I |
| 2M J110929137659180 | 2.48 | 2.73 | III | ||
| 2M J110935437731390 | 2.22 | 2.58 | III | ||
| 2M J110940067628391 | 2.68 | 2.69 | 2.82 | 2.74 | III |
| 2M J110941927634584aaSpectral slopes are the observed values without a correction for extinction. | 0.39 | 0.23 | 0.69 | 0.31 | II |
| 2M J110942607725578 | 1.89 | 1.53 | 2.18 | 1.57 | II |
| 2M J110945257740332 | 2.39 | 2.46 | 2.68 | 2.60 | III |
| 2M J110946217634463 | 1.17 | 0.46 | 0.72 | 0.09 | II |
| 2M J110947427726290 | 1.39 | 0.91 | 1.60 | 0.87 | II |
| 2M J110948667714383aaSpectral slopes are the observed values without a correction for extinction. | 1.02 | 0.86 | II | ||
| 2M J110949187731197 | 2.34 | 2.51 | 2.68 | 2.70 | III |
| 2M J110952157639128 | 0.67 | 0.96 | 0.51 | 0.97 | II |
| 2M J110952627740348 | 0.01 | 0.31 | 0.11 | 0.42 | flat |
| 2M J110953367728365 | 1.44 | 1.09 | 1.37 | 0.97 | II |
| 2M J110953407634255 | 0.55 | II | |||
| 2M J110954077629253 | 1.27 | 0.87 | 0.96 | 0.64 | II |
| 2M J110954377631113 | 0.26 | 0.16 | 0.04 | 0.04 | flat |
| 2M J110955057632409aaSpectral slopes are the observed values without a correction for extinction. | 0.12 | 0.03 | 0.61 | 0.14 | flat |
| 2M J110958737737088 | 1.11 | 1.07 | 1.19 | 1.10 | II |
| 2M J111000107634578 | 0.88 | II | |||
| 2M J111001927725451 | 2.52 | 2.71 | III | ||
| 2M J111003697633291 | 0.66 | 0.64 | 0.52 | 0.58 | II |
| 2M J111004697635452 | 1.66 | 1.05 | 1.57 | 0.86 | II |
| 2M J111006587642486 | 2.13 | 2.52 | III | ||
| 2M J111007047629376 | 1.17 | 1.11 | 0.94 | 1.00 | II |
| 2M J111007857727480 | 1.36 | 1.16 | 1.14 | 1.01 | II |
| 2M J111009347632178 | 0.95 | 0.96 | 0.99 | 0.98 | II |
| 2M J111011417635292 | 1.32 | 0.58 | 0.80 | 0.17 | II |
| 2M J111011537733521 | 2.59 | 2.73 | 2.79 | 2.86 | III |
| 2M J111022267625138 | 2.33 | 2.67 | III | ||
| 2M J111028527716596 | 2.42 | 2.58 | III | ||
| 2M J111034817722053 | 2.64 | 2.71 | 2.78 | 2.79 | III |
| 2M J111036447722131 | 2.61 | 2.77 | III | ||
| 2M J111038017732399 | 1.55 | 1.16 | 1.33 | 0.97 | II |
| 2M J111040067630547 | 2.39 | 2.69 | III | ||
| 2M J111041417720480 | 1.12 | 0.95 | 0.95 | 0.83 | II |
| 2M J111049597717517 | 0.95 | 0.57 | II | ||
| 2M J111050767718031 | 2.54 | III | |||
| 2M J111053337634319 | 0.86 | 0.82 | 0.76 | 0.76 | II |
| 2M J111053597725004 | 0.58 | 0.59 | 0.99 | 0.77 | II |
| 2M J111055977645325 | 1.38 | 1.01 | 1.28 | 0.88 | II |
| 2M J111110837641574 | 1.28 | 0.05 | 0.87 | 0.43 | II |
| 2M J111122607705538 | 2.79 | III | |||
| 2M J111134747636211 | 2.56 | 2.88 | 2.78 | 3.06 | III |
| 2M J111139657620152 | 1.39 | 0.92 | II | ||
| 2M J111145337636505 | 1.44 | 0.93 | 1.56 | 0.86 | II |
| 2M J111146327620092 | 1.74 | 1.34 | II | ||
| 2M J111154007619311 | 2.54 | 2.63 | III | ||
| 2M J111202887722483 | 2.39 | 2.60 | III | ||
| 2M J111203277637034 | 2.44 | 2.51 | 2.74 | 2.65 | III |
| 2M J111203517726009 | 1.35 | 1.10 | 1.64 | 1.16 | II |
| 2M J111209847634366 | 1.56 | 1.06 | 1.42 | 0.87 | II |
| 2M J111222507714512 | 1.71 | 1.22 | 1.77 | 1.12 | II |
| 2M J111224417637064 | 0.86 | 1.13 | 0.58 | 1.08 | II |
| 2M J111227727644223 | 1.21 | 0.73 | 1.30 | 0.65 | II |
| 2M J111230927644241 | 1.05 | 1.00 | II | ||
| 2M J111230997653342 | 2.31 | 2.63 | III | ||
| 2M J111242687722230 | 1.75 | II | |||
| 2M J111242997637049 | 2.71 | 2.79 | 2.78 | 2.84 | III |
| 2M J111248617647066 | 1.44 | 1.27 | II | ||
| 2M J111324467629227 | 1.42 | 1.02 | 1.47 | 0.94 | II |
| 2M J111327377634165 | 2.64 | 2.75 | 2.77 | 2.84 | III |
| 2M J111329707629012 | 2.57 | 2.72 | 2.82 | 2.87 | III |
| 2M J111333567635374 | 2.52 | 2.51 | 2.77 | 2.62 | III |
| 2M J111415657627364 | 2.56 | 2.49 | 2.78 | 2.57 | III |
| 2M J111424547733062 | 1.69 | 1.31 | 1.63 | 1.19 | II |
| 2M J111426117733042 | 2.21 | 2.38 | II | ||
| 2M J111429067625399 | 2.54 | III | |||
| 2M J111450317733390 | 2.57 | 2.70 | 2.72 | 2.79 | III |
| 2M J111521807724042 | 2.53 | 2.74 | III | ||
| 2M J111737927646193 | 2.37 | 2.65 | III | ||
| 2M J111820247621576 | 2.71 | III | |||
| 2M J111833797643041 | 2.39 | 2.67 | 2.69 | 2.87 | III |
| 2M J111942147623326 | 2.55 | 2.77 | III | ||
| 2M J111956527504529 | 2.37 | 2.77 | III | ||
| 2M J112411867630425 | 2.10 | 2.12 | II | ||
| 2M J112429807554237 | 2.55 | 2.70 | 2.75 | 2.82 | III |
| 2M J112912617546263 | 2.68 | 2.65 | 2.79 | 2.69 | III |
| 2M J113323277622092 | 2.51 | 2.67 | 2.71 | 2.79 | III |
| Class | Northaa. | Southbb from 2M J110629427724586. | Total |
|---|---|---|---|
| I | 1 | 3 | 4 |
| flat | 2 | 8 | 10 |
| II | 43 | 51 | 94 |
| III | 44 | 51 | 95 |
| Spectral Type | Chamaeleon I | IC 348 |
|---|---|---|
| K6 | 14/19 = | 7/35 = |
| K6 and M3.5 | 42/66 = | 41/94 = |
| M3.5 and M6 | 36/83 = | 62/130 = |
| M6 and M8 | 10/24 = | 13/23 = |
| M8 | 5/10 = | 5/12 = |
Note. — The statistical errors in the disk fractions are computed in the manner described by Burgasser et al. (2003).
| IDaaIdentifications assigned in this work, which conform to the ones used for previously known members of Cha (Feigelson et al., 2003; Luhman, 2004b). | 2MASSbb. | Name | [3.6] | [4.5] | [5.8] | [8.0] | Date | [24] | Date |
|---|---|---|---|---|---|---|---|---|---|
| 13 | J111835727935548 | 9.310.02 | 9.150.02 | 9.060.03 | 8.500.04 | 2006 Jul 6 | out | ||
| 14 | J112255627924438 | RX J1123.27924 | 9.450.02 | 9.460.02 | 9.420.03 | 9.400.03 | 2004 May 1 | 9.530.10 | 2004 Aug 3 |
| 15 | J113349267618399 | 10.920.02 | 10.840.02 | 10.820.03 | 10.790.03 | 2006 Jul 10 | 9.950.27 | 2007 Jun 6 | |
| 16 | J114049677459394 | 11.380.02 | 11.280.02 | 11.240.03 | 11.170.03 | 2006 Jul 10 | 2007 Jul 16 | ||
| 17 | J114326697804454 | 10.080.02 | 9.870.02 | 9.670.03 | 9.260.03 | 2006 Jul 10 | out | ||
| 18 | J114931847851011 | RX J1149.87850 | 7.960.02 | 7.530.02 | 7.010.03 | 5.810.03 | 2004 Jun 10 | 1.750.04 | 2005 Mar 6 |
| 19 | J115028297704380 | RX J1150.47704 | 8.860.02 | 8.860.02 | 8.850.03 | 8.820.04 | 2004 May 26 | 8.760.06 | 2005 Feb 27 |
| 20 | J115826817754450 | RX J1158.57754B | 9.250.02 | 9.200.02 | 9.160.03 | 9.150.04 | 2004 Jun 10 | 8.610.06 | 2004 Feb 22 |
| 21 | J115828167754294 | RX J1158.57754A | 7.310.02 | 7.270.02 | 7.280.03 | 7.220.03 | 2004 Jun 10 | 7.140.04 | 2004 Feb 22 |
| IDaaIdentifications from Table 11. | (2-8 µm) | (2-24 µm) | (3.6-8 µm) | (3.6-24 µm) | SED Class |
|---|---|---|---|---|---|
| 13 | 1.99 | 1.92 | II | ||
| 14 | 2.60 | 2.83 | 2.80 | 2.97 | III |
| 15 | 2.54 | 2.43 | 2.71 | 2.47 | III |
| 16 | 2.37 | 2.62 | III | ||
| 17 | 1.87 | 1.92 | II | ||
| 18 | 0.86 | 0.28 | 0.37 | 0.08 | flat |
| 19 | 2.68 | 2.80 | 2.80 | 2.88 | III |
| 20 | 2.59 | 2.57 | 2.74 | 2.62 | III |
| 21 | 2.66 | 2.78 | 2.75 | 2.85 | III |