The energy spectrum of all-particle
cosmic rays around the
knee region
observed with the Tibet-III air-shower array
Abstract
We have already reported the first result on the all-particle spectrum around the knee region based on data from 2000 November to 2001 October observed by the Tibet-III air-shower array. In this paper, we present an updated result using data set collected in the period from 2000 November through 2004 October in a wide range over 3 decades between eV and eV, in which the position of the knee is clearly seen at around 4 PeV. The spectral index is -2.68 0.02(stat.) below 1PeV, while it is -3.12 0.01(stat.) above 4 PeV in the case of QGSJET+HD model, and various systematic errors are under study now.
keywords:
cosmic rays, knee, air showerPACS:
98.70.Sa , 95.85.Ry , 96.40.De,
,
,
,
,
,
,
,
,
,
,
,
,
,
,
,
,
,
,
,
,
,
,
,
,
,
,
,
,
,
,
,
,
,
,
,
,
,
,
,
,
,
,
,
,
,
,
,
,
,
,
,
,
,
,
,
,
,
,
,
,
,
,
,
,
,
,
,
,
,
,
,
,
,
,
,
,
,
,
,
,
,
,
,
(The Tibet AS Collaboration)
1 Introduction
The energy spectrum of primary cosmic rays is well described by a power law over a wide energy range, while its slope becomes steeper in the energy range between and eV, which is called ”knee”. It has been discussed that the knee is closely related with the origin, the acceleration and the propagation of high-energy cosmic rays in the Galaxy. One of the plausible understanding may be that almost all cosmic rays below the knee are accelerated at supernova remnants (SNRs), since the maximum energy gained by shock acceleration at SNRs is of the order of eV per unit charge [Lagage and Cesarsky. 1983], the cosmic-ray spectrum is expected to become steeper at energies around and beyond the knee. Another possibility is that the break of the spectrum around the knee represents the energy at which cosmic rays can escape more freely from the trapping zone in the Galactic disk [Peters 1961].
We have already reported the first result on the all-particle spectrum around the knee region based on data from 2000 November to 2001 October observed by the Tibet-III air-shower array [Amenomori et al., 2003]. In this paper, we present an updated result using data set collected in the period from 2000 November through 2004 October. We also examine the simulation code CORSIKA with interaction models of QGSJET01c. Based on these calculations, we obtained the cosmic ray energy spectrum in a wide range over 3 decades between eV and eV.
2 Tibet-III air shower array and detector response
The Tibet-III air-shower array, consisting of 533 scintillation detectors of each 0.5 m2 with the area of 22,050 m2, has been successfully operating since 1999 with energy threshold of a few TeV. A 0.5 cm-thick lead plate is put on the top of each detector to increase the detection sensitivity of a detector by converting secondary gamma rays into electron-positron pairs in an air shower. In the fall of 2000, this array was further improved for UHE cosmic-ray study by adding wide dynamic range PMTs to all 221 sets of detectors which are placed on a lattice of 15 m spacing in the detector covering area of 36,900 m2. This PMT equipped in each detector can measure the number of particles beyond 4,000, so that the array can observe UHE cosmic rays with the energy exceeding eV with a good accuracy.
The Tibet-III air-shower array is able to measure the shower size and the arrival direction of each air shower. The air shower direction can be estimated with an inaccuracy smaller than 0.2∘ at energies above 1014 eV. The shower size for each event is estimated by fitting the lateral particle density distribution with the modified NKG structure function (see section 3.2). The primary energy of each air shower event is then estimated from the air shower size. The relation between the shower size and the primary energy is calculated based on the MC simulation as discussed later. In general, the “shower size” means the number of electrons and positrons in each air shower event. It cannot be, however, directly obtained by usual shower array using scintillators since these electromagnetic components cannot be discriminated from other charged particles such as muons and hadrons.
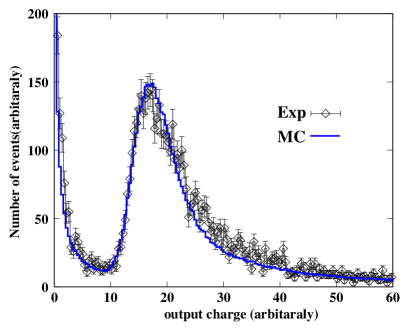
In our experiment, the number of particles detected by each scintillation detector is defined as the PMT output (charge) divided by that of the single peak, which is determined by a probe calibration using cosmic rays. For this purpose, a small scintillator of 25 cm 25 cm 3.5 cm thick with a PMT (H1949) is put on the top of the each detector during the maintenance period. This is called probe detector and is used for making the trigger of the each Tibet-III detector. These events triggered by the probe detector was also examined by a MC simulation. In this simulation, the primary particles were sampled in the energy range above the geomagnetic cutoff energy at Yangbajing, and all secondary particles which pass through the probe detector and the Tibet-III detector were selected for the analysis. Since the value of PMT output is proportional to the energy loss of the particles passing through the scintillator, the peak position of the energy loss distribution is defined as the “energy deposit by a singly charged particle”. This value corresponds to the observed single peak of the probe calibration. The peak energy was calculated as 6.11 MeV for the Tibet-III detector configuration. We confirmed that the shape of the energy loss distribution shows a good agreement with the charge distribution of the experimental data as shown in Fig. 1. It should be noted that the dependences of the energy loss on particle type and its energy are adequately taken into account in this calibration.
For air-shower MC calculation at high energies, we treat the number of shower particles as the calculated energy deposit divided by 6.11 MeV. Thus, all detector responses including muons and the materialization of photons inside the detector are taken into account. The shower size of each event was estimated using a modified NKG lateral distribution function which is tuned to reproduce the above defined lateral distribution using the MC events under our detector configurations.
3 Air shower size and primary particle energy
An extensive Monte Carlo simulation (MC) using CORSIKA code (ver. 6.204) including QGSJET01c [Heck et al., 1998] hadronic interaction model was made to obtain the primary cosmic ray spectrum using the Tibet-III air shower data. Since the Tibet hybrid experiment of the air shower array and the burst detector array to measure the energy spectrum of the light components (proton and helium) strongly suggests that the knee region is dominated by heavy components [Amenomori et al., 2006], in this paper we use a heavy dominant (HD) composition model [Amenomori et al., 2000] in the MC for comparison with experimental data. All secondary particles are traced until their energies become 1 MeV in the atmosphere. Simulated air-shower events were input to the detector with the same detector configuration as the Tibet-III array with use of Epics code (ver. 8.64) [Kasahara] to calculate the energy deposit of these shower particles.
3.1 Event selection and collecting area
Following criteria are applied to select the events for the analysis.
1) The zenith angle () of each air-shower event should be smaller than 25∘, or 1.1 to exclude the zenith angle dependence of the air-shower development.
2) More than 10 detectors should detect a signal of more than five particles per detector.
3) The central positions weighted by the 8th power of the number of particles at each detector should be inside the innermost 135 m 135 m area. This area is chosen with use of MC events so that the following two cases are just canceling out each other. Namely, the number of events originally inside of this area falling outside of this area after event reconstruction equals to the number of events in the opposite case.
It is confirmed by simulations that the air showers induced by primary particles with 100 TeV and 1.1 can be fully detected without any bias under above mentioned criteria.
The total effective area S is calculated to be 10410.1 msr for all primary particles with 100 TeV. For the operation period from 2000 November through 2004 October, the effective live time T is 2.21 years. The total number of air showers selected under the above conditions is 4.1 events.
3.2 Lateral distribution of shower particles
The determination of the lateral distribution function of an air shower is substantially important in this experiment, since the total number of shower particles is obtained by fitting the structure function to the experimental data. Since our air-shower array is also used to study the TeV gamma-ray point sources, lead plate of 5 mm thick is placed above each scintillation counter to increase the sensitivity, the detector response should be carefully examined by MC. Using the Monte Carlo data obtained under the same conditions as the experiment, we find that the following modified NKG function can fit well to the lateral distribution of shower particles under the lead plate:
| (1) |
| (2) |
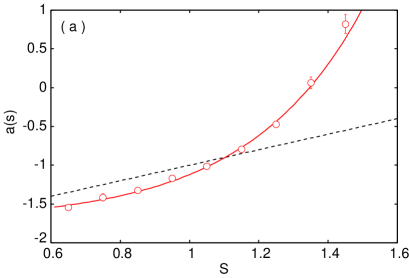
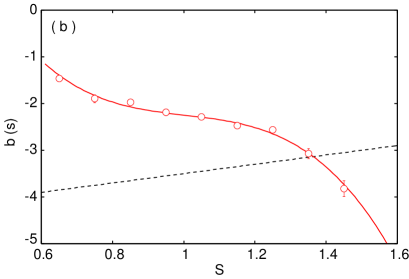
where = 30 m, and the variable corresponds to the age parameter, the total number of shower particles and denotes the beta function. The functions and are determined as follows. In CORSIKA simulation, the shower age parameter is calculated at observation level by fitting to a function for the one dimensional shower development. It may be possible to assume that air showers with the same shower age s are in the almost same stage of air shower development in the atmosphere, i.e. they show the almost same lateral distribution for shower particles irrespective of their primary energies. The lateral distribution of the particle density obtained by the simulation with carpet array configuration is normalized by the total number of particles which is derived from the total energy deposit in infinitely wide scintillator. These events are then classified according to the stage of air shower development using the age parameter and they are averaged over the classified events. The fitting of the equation (1) to the averaged MC data is made to obtain the numerical values and . Thus, we can obtain the behavior of and as a function of as shown in Fig. 2 where original definitions of and in NKG function are shown by the dotted lines. Although our result shows different dependences of and on , it is confirmed that the lateral distribution of the shower particles is better reproduced by our formula. This expression is valid in the range of s = 0.6 1.6, 1.1 and r = 5 3000 m.
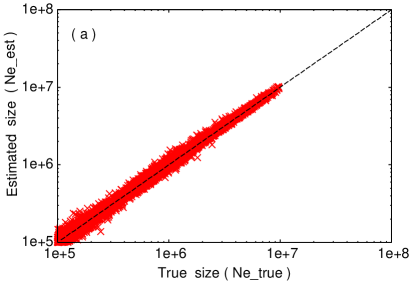
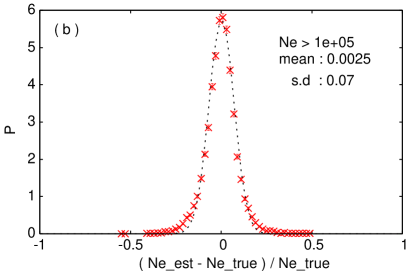
Based on the Monte Carlo simulation, the correlation between the true shower size and the estimated shower size is demonstrated in Fig. 3(a) and Fig. 3(b). As seen in these two figures, a good correlation between the true shower size and the estimated shower size is obtained and the shower size resolution is estimated to be 7% above with 1.1.
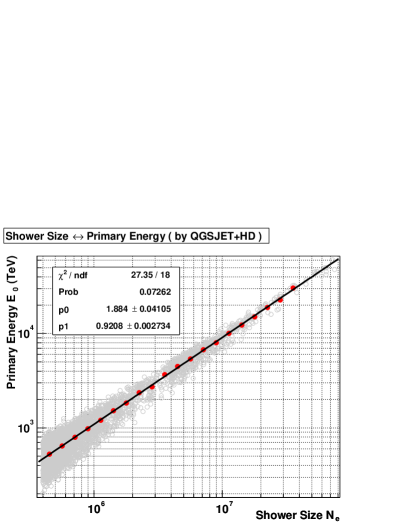
3.3 Relation between the shower size and the primary energy
In Fig. 4, we show the correlation between the shower size under the lead plate at the Tibet observation level and the primary energy for the QGSJET+HD model. The conversion function from the shower size to the primary energy can be expressed by the following equation for 1.1,
| (3) |
where a=1.88, b=0.92. The energy resolution is estimated by our simulation as 36% and 17% at energies around 200 TeV and 2000 TeV, respectively. It is seen that the energy estimation of the primary particle from the air shower size is well made with a good accuracy in the wide energy range including the knee region. We further examine the dependence of the result on the interaction models, primary models, and other possible systematic biases in the very near future.
4 Results and Discussions
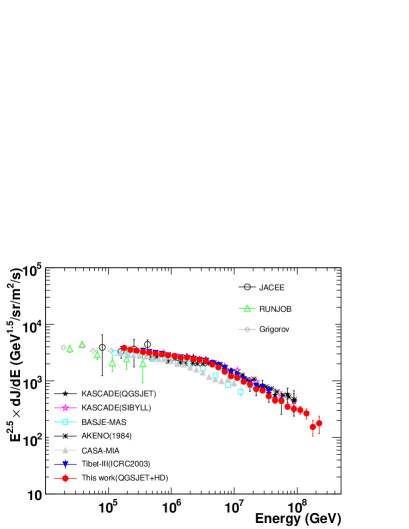
We obtained the all-particle energy spectrum between 1 eV and 1 eV based on the QGSJET+HD model as shown in Fig. 5. The red circle represents this work, and the blue inverse-triangle is our old result [Amenomori et al., 2003], and they are compared with other experiments. Our new result shows a good agreement with the previous one in the energy range less than 4 PeV, while suggesting a slightly steeper power index above 4 PeV and about 10% lower intensity around eV. This difference may be due to the upgrade of MC calculations and the increase of the observed data. The spectral index of this work is -2.68 0.02(stat.) below 1 PeV and -3.12 0.01(stat.) above 4 PeV in the case of QGSJET+HD model. The evaluation of various systematic errors is under examination at present.
The all-particle spectrum obtained in a wide range over 3 decades between eV and eV clearly shows the position of the knee being at energy around 4 PeV. In this work, we obtained the result based on the assumption that the knee energy region is dominated by nuclei heavier than helium [Amenomori et al., 2006]. It is noted that the all-particle spectrum depends slightly on the primary composition in the energy region below about eV. A further study of the dependence of the spectrum on the simulation codes, interaction models, primary composition models, and other possible systematic biases should be carefully done in the very near future.
Acknowledgments
The collaborative experiment of the Tibet Air Shower Arrays has been performed under the auspices of the Ministry of Science and Technology of China and the Ministry of Foreign Affairs of Japan. This work was supported in part by Grants-in-Aid for Scientific Research on Priority Areas (712) (MEXT), by Scientific Research (JSPS) in Japan, by the National Natural Science Foundation of China, and by the Chinese Academy of Sciences.
References
- [Amenomori et al., 1996] Amenomori, M., Cao, Z., Dai, B.Z., et al., The Cosmic-Ray Energy Spectrum between and eV Covering the “Knee” Region, ApJ. 461, pp.408-414, 1996.
- [Amenomori et al., 2000] Amenomori, M., Ayabe, S., Caidong, et al., Measurement of air-shower cores to study the cosmic ray composition in the knee energy region, Phys. Rev. D 62, pp.072007-1-12, 2000.
- [Amenomori et al., 2003] Amenomori, M., Ayabe, S., Cui, S.W., et al., The energy spectrum of all-particle cosmic rays around the knee region observed with the Tibet air-shower array, Proc. 28th Int. Cosmic Ray Conf. (Tsukuba), Vol.1, pp.143-146, 2003.
- [Amenomori et al., 2006] Amenomori, M., Ayabe, S., Chen, D., et al., Are protons still dominant at the knee of the cosmic-ray energy spectrum?, Phys. lett. B Vol.632, Issue 1, pp.58-64, 2006.
- [Antoni et al., 2005] Antoni, T., Apel, W.D., Badea, A.F., et al., KASCADE measurements of energy spectra for elemental groups of cosmic rays: Results and open problems, Astropart. Phys. 24, pp.1-25, 2005.
- [Apanasenko et al., 2001] Apanasenko, A.V., Sukhadolskaya, V.A., Derbina, V.A., et al., Composition and energy spectra of cosmic-ray primaries in the energy range - eV/particle observed by Japanese-Russian joint balloon experiment, Astropart. Phys. 16, pp.13-46, 2001.
- [Asakimori et al., 1998] Asakimori, K., Burnett, T.H., Cherry, M.L., et al., Cosmic-Ray Proton and Helium Spectra : Results from the JACEE Experiment, ApJ 502, pp.278-283, 1998.
- [Glasmacher et al., 1999] Glasmacher, M.A.K., Catanese, M.A., Chantell, M.C., et al., The cosmic ray energy spectrum between and Astropart. Phys. 10, pp.291-302, 1999.
- [Grigorov et al., 1971] Grigorov, N.L., Gubin, Yu.V., Jakovlev, B.M., et al., Energy Spectrum of Primary Cosmic Rays in the - eV According to the Data of Proton-4 Measurements. Proc. 12th Int. Cosmic Ray Conf. (Hobart), Vol.5, pp.1746-1749, 1971.
- [Heck et al., 1998] Heck, D., et al., Report FZKA 6019, 1998 ; http://www-ik3.fzk.de/ ∼heck/corsika/physics_description/corsika_phys.html.
- [Kasahara] Kasahara, K., http://cosmos.n.kanagawa-u.ac.jp/EPICSHome/index.html.
- [Lagage and Cesarsky. 1983] Lagage, P.O. and Cesarsky, C.J., Cosmic-ray shock acceleration in the presence of self-excited waves, Astron. Astrophys. 118, pp.223-228, 1983.
- [Nagano et al., 1984] Nagano, M., Hara, T., Hatano, Y., et al., Energy spectrum of primary cosmic rays between - eV, J. Phys. G 10, pp.1295-1310, 1984.
- [Ogio et al., 2004] Ogio, S., Kakimoto, F., Kurashina, Y., et al., The energy spectrum and the chemical composition of primary cosmic rays with energies from to eV, ApJ. 612, pp.268-275, 2004.
- [Peters 1961] Peters, B., Primary Cosmic Radiation and Extensive Air Showers, Nuovo Cimento 22, pp.800-806, 1961.