Novel exponents control the quasi-deterministic limit of the extinction transition
Abstract
The quasi-deterministic limit of the generic extinction transition is considered within the framework of standard epidemiological models. The susceptible-infected-susceptible (SIS) model is known to exhibit a transition from extinction to spreading, as the infectivity is increased, described by the directed percolation equivalence class. We find that the distance from the transition point, and the prefactor controlling the divergence of the (perpendicular) correlation length, both scale with the local population size, , with two novel universal exponents. Different exponents characterize the large behavior of the susceptible-infected-recovered (SIR) model, which belongs to the dynamic percolation class. Extensive numerical studies in a range of systems lead to the conjecture that these characteristics are generic and may be used in order to classify the high density limit of any stochastic process on the edge of extinction.
pacs:
05.70.Ln,02.50.Ey,64.60.Ht,87.19.X-I Introduction
Perhaps the most useful approximation in science is the description of microscopic, stochastic processes via ”mean field” deterministic equations. Except for the most fundamental parts of particle physics, almost any other study involves that procedure: classical mechanics is used to describe quantum systems, classical electromagnetism neglects the fluctuations of the photon density and continuum mechanics averages out the microscopic stochasticity involved in the motion of an individual molecule. Chemical reaction kinetics is generally described by rate equations; population dynamics and other ecological processes are depicted using the concept of logistic growth, or by Lotka-Volterra equations. The dynamics of the individual, microscopic, constituents is always stochastic, and is subject to fluctuations; these fluctuations are smeared out when the system is described by deterministic rate equations.
Basically, the underlying assumption beyond all these approximations is that the microscopic fluctuations are averaged out in the “large density” (many atoms, animals, quanta) limit. A generic analysis of the deterministic limit, like a expansion where is the number of elements, is still lacking in many fields. Problems like the quantum classical correspondence in chaotic systems, or the decay of a quasistationary state to an absorbing state are still a subject of intensive studies. The situation becomes even more complicated when spatially extended systems, made of diffusively coupled patches, are considered. What exactly determine the “large N” limit in that system? Should the number of microscopic entities be large on a single patch, or within a correlation length? All these questions are still open, as no systematic perturbation theory in exists so far.
In this paper we consider a generic process in population dynamics: the extinction transition with an absorbing state. The framework used is two well-known models for epidemics, namely, the SIS and the SIR models sa ; am . For a well mixed population of size (say, on a single patch) the stochastic process starts by the introduction of a single infected (“I”) individual into the system. This individual may infect any other, susceptible (“S”), individual with rate , where after the infection the susceptible becomes infected and may infect other susceptible members of the community; the only other process is a ”recovery” of an infected person; this happens with rate . In the SIR model, the recovered individuals are then immune against the disease, while the SIS model describes the case where the recovered became susceptible again. The elementary processes, thus, are
| (1) |
Denoting by the fraction of infected individuals, and by the fraction of susceptibles, the mean field equations in the well mixed limit are
| (2) |
Clearly, the SIR process is self-limiting, as decreases with time, while the SIS process may support an endemic state with . Another piece of information garnered from the rate equations is the existence of a transition when the infectivity parameter crosses the value . Below , both SIS and SIR processes immediately decay; above that value, an outbreak is possible.
The mean field equations (I) are an approximation for the real stochastic process (I). Some characteristics of the epidemic, though, may be calculated exactly for the real stochastic process in the well mixed limit. In particular,
Below both processes are the same in the large limit, since the change of a susceptible becoming reinfected in the SIS model is vanishingly small.
For large , above there are two peaks in the distribution of epidemic sizes. The first peak is at size 1 (i.e. the initial infected individual, only). The second peak for the SIR model is at the size predicted by the deterministic equations watson . For the SIS model, the second peak is at an exponentially large value, corresponding to the exponentially long lifetime of the metastable endemic statemysis .
At , the average size of the epidemic scales for large as for the SIS model dlsis ; mysis and as for the SIR model lof ; bn ; mysir .
Let us consider now a one dimensional array of L patches, with susceptible individuals on each patch, where a single infected individual is introduced at a single patch.
Above , and for , the deterministic equations (I), with an appropriate contact term playing the role of ”diffusion” , give rise to a constant velocity solution. The mean field dynamics is akin to that of the FKPP equation fisher ; kpp , and yield a velocity proportional to the square root of the distance from . The solution for the SIS case is that of a front separating the metastable uninfected state ahead of the front from the endemic state behind. In the SIR case, the solution is a pulse, leaving behind a state with a diminished susceptible population such that the effective infectivity parameter, , is below .
What happens in the stochastic models then? Let us discuss the SIS case first. For the SIS model is equivalent to the contact process Harris , where there is a transition to a propagating state at a finite value of . This transition is known to be in the directed peculation (DP) equivalence class Hinr . Above the transition, there is a finite chance of generating a wave of infection whose lifetime is infinite. The average velocity of the wave is less than that predicted by the deterministic equation. This has been analyzed by Brunet and Derrida bd , who show that as , the average velocity approaches the deterministic value, albeit with anomalously large corrections. Below the directed percolation transition, the typical spatial extent of the epidemic, denoted , is finite, and diverges as the transition point is approached. Following the Janssen-Grassberger conjecture jg , it is widely believed that any generic extinction transition, and, in particular, the transition for the SIS model for any N, falls in the equivalence class of directed percolation.
In order to test these predictions in the large density limit we have simulated the SIS process on a one dimensional array of sites. On each site there are individuals, and this number is fixed throughout the process. The epidemics is ignited by the introduction of a single infected individual on a single site. The chance of an to infect any susceptible individual on the same site is , and its chance to infect an on one of the two neighboring sites is . Thus, is the inter-site infectivity rate, while the population within a site is considered as well mixed. The chance of recovery is independent of the spatial structure and the recovery rate is for any individual. We have used an exact, agent-based simulation in order to study the approach to transition from below, using the divergence of the perpendicular correlation length as a marker of the transition.
What is the effect of increasing on the transition? Fixing and one should expect a dependence of , the value of at the DP transition, on . If , for example, the SIS becomes a simple contact process on a line, and the DP transition happens when the infection rate is 3.297 times higher than the recovery rate; accordingly, . On the other hand, as , should approach the value and becomes independent, as a single site may support the endemic state. should interpolate between these two limits as a function of .
Another effect has to do with the divergence of at the transition. According to the stochastic theory, right below the transition is finite but large. On the other hand, the classical equations predict that below the transition. One expects both statements to be true at the large limit. The only way out of that paradox is to understand that the classical description must fail close enough to the transition, but the region in which it fails must shrink to zero in the limit. Say it another way, at a fixed distance from the transition, and for large enough , the perpendicular correlation length should approach zero.
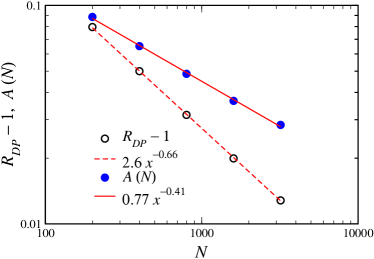
Our simulations support all parts of this picture. First, the Jansen-Grassberger conjecture works and in all cases studied we find that diverges as the transition point is approached from below with the expected power . Second, we find that obeys a universal scaling with , independent of the details of the model. Specifically, near the transition
| (3) |
where for large
| (4) |
where for large
| (5) |
The data supporting these findings are presented in Fig. 1 for the specific case of an SIS model with fixed recovery time and . The applicability of these results, though, is much wider; the same exponents turn out to describe the large limit of the SIS model with different and with exponentially distributed recovery time, as well as other stochastic models like branching-annihilation-death () and so on. We thus conjecture that these exponents describe the large behavior of any one-dimensional extinction transition that belongs to the DP equivalence class.
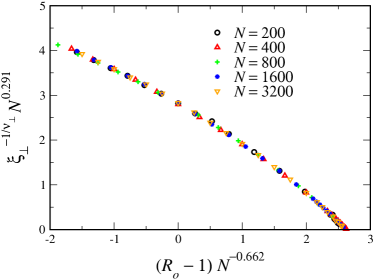
The data collapse presented in Figure 2 reveals the existence of much stronger regularity at large ’s. Eq. (3) implies that is a linear function of close to the transition. In fact, this result generalizes to a whole scaling regime where the scaled correlation length is a function of the scaled distance from the classical transition:
| (6) |
Again, we have verified that this scaling behavior is independent of the (nonzero) strength of the intersite coupling.
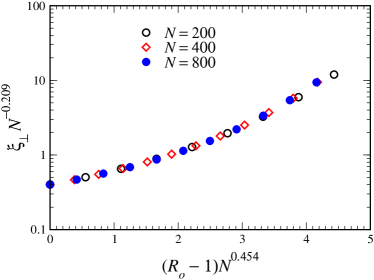
We now turn to examine the behavior of the stochastic model at large . Here, the model is supposed to be in the dynamic percolation universality class gras83 ; grascar85 . This class does not have a transition in one spatial dimension, and the propagating pulse always dies out in an infinite system. Still, the correlation length exhibits a scaling behavior with very similar to that of the SIS model. We find that the scaled correlation length, is a function of the scaled infectivity . The data collapse is presented in Fig. 3. Here the correlation length is finite for all infectivities, indicating that we are indeed below the percolation transition. The correlation length does however grow very rapidly with .
In the simulations presented above, we have used as our measure of the correlation length the inverse of the exponential falloff rate of the distribution function for infection location. It is remarkable that in both models, for all studied (below the extinction transition), this distribution function appears to be given exactly (at least to within our statistical errors, over some seven decades) by the functional form , with is the location of the original infected person. The average total number of infections is given then roughly by (assuming , as it is for large). We can then deduce the scaling properties of with . The number of infections at the central site, are the result of the on-site infections nucleated by the original infected person and by those nucleated by the neighboring sites. The effective on-site infection rate is , and since this is below , each initial infection develops essentially independently, giving rise to total infections. The number of primary infections induced by the neighbors is . Thus, we have, for
| (7) | |||||
| (8) |
This implies that
| (9) |
so scales exactly the same with as . Thus, the total number of infections scales as , in both the SIS and SIR models. For the SIS model, this gives the total number of infections scaling as , whereas in the SIR model, we have the total number of infections scaling as approximately . Notice that in both cases, the total number of infections at the critical infectivity scales faster than the 0 dimensional results, and , respectively. We have tested these predictions in our simulations, (data not shown) and found them to be very well satisfied. Also, preliminary work indicates that these exponents are higher still in two dimensions, and saturate at 1 as the dimension goes to infinity long .
In the SIS model, as in the related contact process, the total number of infections diverges at the directed percolation transition, with the exponent . However, the total number of infections is equal to . Thus, should diverge at the transition as . Combining this with our above result for the scaling of with at criticality, we get that
| (10) |
where vanishes linearly at the transition. It is remarkable that even though the directed percolation exponent associated with differs from that of , the scaling is the same.
Our simulations suggest that the quasi-deterministic region is controlled by the new critical exponents and . At the transition, the deterministic limit does not exist and the stochastic dynamics of the microscopic constituents determines the system behavior for any time scale. Off transition, on the other hand, the effect of stochasticity vanishes for large enough . The value of and is parameter independent, as long as the dimensionality of the system and the type of stochastic transition (DP vs. dynamic percolation) are kept fixed.
It is interesting to point out an exception to our analysis, namely, the branching-annihilation process with no bare death term () for Brownian particles. Here at low densities there is a DP type transition at finite birth rate, but as (i.e., ) the transition approaches . The deterministic limit of the transition in that case does not belong to the directed percolation equivalence class; in fact, it is known that for the density decays like in one spatial dimension. Indeed, Cardy and Tauber cardy calculated that the distance to the DP transition should scale as , (since close to the classical transition the density is inversly proportional to ). Addition of a spontaneous death process to the model shifts the deterministic transition to and provide us with a model that admits a DP transition all the way to . In fact, our preliminary numerics show that in the Cardy-Tauber case the scaling of the critical appears to be consistent with their prediction. Adding changes the picture dramatically and , where is identical to that measured for the SIS model. It is interesting to note that, if the Cardy-Tauber perturbative technique is modified to include the spontaneous death process, at large the distance from the DP transition is predicted to scale as instead of .
Many aspects of that problem are still open. In particular a rigorous classification scheme for the quasi-deterministic behavior is still missing. The extinction transition in higher dimensions (where dynamic percolation admits a nontrivial critical point) and the behavior of the system above the transition also need to be investigated. We hope to address these subjects in future work.
Acknowledgements.
We thank S. Havlin for useful remarks. The work of NMS is supported in part by the EU 6th framework CO3 pathfinder.References
- (1) N. T. J. Bailey, The Mathematical Theory of Infectious Diseases and its Applications (Hafner Press, New York, 1975).
- (2) R. M. Anderson and R. M. May, Infectious Diseases of Humans (Oxford University Press, Oxford, 1991).
- (3) R. Watson, J. Appl. Prob. 17, 912 (1980).
- (4) D. A. Kessler, preprint arXiv:0709.3049.
- (5) R. G. Dolgoarshinnykh and S. P. Lalley, J. Appl. Prob. 43, 892 (2006).
- (6) A. Martin-Löf, J. Appl. Prob. 35, 671 (1998).
- (7) E. Ben-Naim and P. L. Krapivsky, Phys. Rev. E69 050901 (2004).
- (8) D. A. Kessler and N. M. Shnerb, Phys. Rev. Ebf 76 010901(R) (2007).
- (9) R. A. Fisher, Ann. Eugenics 7, 353 (1937).
- (10) A. N. Kolmogorov, I. G. Petrovskii and N. S. Piskunov, Selected Works of A. N. Kolmogorov. V. M. Tikhomirov (Ed.), Kluwer Academic Publishers, 1991.
- (11) T. E. Harris, Ann. Prob. 2, 969 (1974).
- (12) For a review of directed percolation, see H. Hinrichsen, Adv. Phys. 49, 815 (2000).
- (13) E. Brunet and B. Derrida, Phys. Rev. E56, 2597 (1997).
- (14) H. K. Janssen, Z. Phys. B 42, 151 (1981); P. Grassberger, Z. Phys. B 47, 365 (1982).
- (15) P. Grassberger, Math. Biosci. 62, 157 (1983).
- (16) J. Cardy and P. Grassberger, J. Phys. A 18, L267 (1985).
- (17) D. A. Kessler and N. M. Shnerb, unpublished.
- (18) J.L. Cardy and U.C. Tauber, J. Stat. Phys. 90, 1 (1998).