Detection of X-ray emission from the very old pulsar J0108–1431
Abstract
PSR J0108–1431 is a nearby, 170 Myr old, very faint radio pulsar near the “pulsar death line” in the - diagram. We observed the pulsar field with the Chandra X-ray Observatory and detected a point source (53 counts in a 30 ks exposure; energy flux ergs cm-2 s-1 in the 0.3–8 keV band) close to the radio pulsar position. Based on the large X-ray/optical flux ratio at the X-ray source position, we conclude that the source is the X-ray counterpart of PSR J0108–1431. The pulsar spectrum can be described by a power-law model with photon index and luminosity ergs s-1, or by a blackbody model with the temperature keV and bolometric luminosity ergs s-1, for a plausible hydrogen column density cm-2 (). The pulsar converts of its spin-down power into the X-ray luminosity, i.e., its X-ray efficiency is higher than for most younger pulsars. From the comparison of the X-ray position with the previously measured radio positions, we estimated the pulsar proper motion of 0.2 arcsec yr-1 ( km s-1), in the south-southeast direction.
Subject headings:
pulsars: individual (PSR J0108–1431) — stars: neutron — X-rays: stars1. Introduction
Because of the observational selection, most of radio pulsars detected in X-rays are much younger and more powerful than “typical” ones, and they cannot be considered as a representative sample of the whole radio pulsar population. Therefore, to understand the evolution of X-ray pulsar properties, it is important to expand the current sample toward lower spin-down powers, , and larger spin-down ages, . X-ray emission from such low-powered, old pulsars is expected to be composed of nonthermal (magnetospheric) emission and thermal emission from the heated polar caps around the neutron star (NS) magnetic poles. (Old NSs are too cold to observe thermal emission from the bulk of the NS surface in X-rays; see, e.g., Yakovlev & Pethick 2004.) The magnetospheric X-ray emission is routinely seen in both young and old pulsars. It is characterized by a power-law (PL) spectrum, with a typical slope (photon index) , and relatively sharp pulsations. The X-ray emission from polar caps, heated by relativistic particles accelerated in the pulsar magnetosphere, is expected to be most efficient in old pulsars (e.g., Harding & Muslimov 2001, 2002). It should show a thermal spectrum, with a temperature –0.3 keV, and smoother pulsations. Since both the magnetospheric and thermal components are powered by the NS spin-down, their luminosities are expected to be proportional to the spin-down power, , where is the pulsar X-ray efficiency.
As of February 2008, Chandra and XMM-Newton observations of eight old, low-powered pulsars (, ) have been reported, of which seven were detected (Becker et al. 2004, 2005, 2006; Zavlin & Pavlov 2004; Zhang et al. 2005; Tepedelenlioğlu & Ögelman 2005; Kargaltsev et al. 2006; Hui & Becker 2007; Misanovic et al. 2008)111After submitting this paper, Gil et al. (2008) reported XMM-Newton observations of two other old pulsars, of which one, PSR B0834+06, was detected and showed properties similar to the previously detected old pulsars.. Most of them showed rather faint X-ray emission, such that it was hard to accurately characterize their spectra and detect pulsations. The spectra of all the detected pulsars can be satisfactorily fitted with a PL model, but the PL slopes, –4, are, on average, steeper than those found in young pulsars, and the hydrogen column densities, , often exceed those estimated from the pulsar dispersion measure at the usual assumption of 10% ionization of the interstellar medium (ISM). (An extreme example is PSR B1929+10, for which the found from the PL fit corresponds to 0.4% of ISM ionization; Misanovic et al. 2008). Some of the spectra can be fitted with a blackbody (BB) model, but the emitting areas are usually much smaller than the conventional areas of polar caps. The spectra can be also described by a two-component, PL+BB, model, but usually with poorly constrained parameters. The measured X-ray efficiencies of old pulsars show a large scatter, – in the 1–10 keV band, but, on average, they seem to be higher than those for young pulsars (Kargaltsev et al. 2006). Pulsations were firmly detected only for three brighter pulsars, B1929+10, B0628–28, and B0950+08, with a hint of energy dependence in the latter case, but their analysis was not very conclusive (e.g., Becker et al. 2004 and Zavlin & Pavlov 2004 came to quite different conclusions about the possible polar cap contribution to the emission from B0950+08). At this point, our working hypothesis is that the emission from old pulsars possibly includes both the magnetospheric and polar cap components, such that the magnetospheric component dominates at higher energies, –2 keV, and has about the same PL slope and efficiency as in young pulsars. However, we cannot rule out that old pulsars are purely magnetospheric emitters, with spectra softer, and efficiencies higher, than those of young pulsars. To check which of these two hypotheses is correct, not only deeper observations of X-ray brightest old pulsars are warranted, but also the number of observed pulsars should be increased. Particularly important would be X-ray observations of pulsars even older and less powerful than those in the currently observed sample.

A very interesting target for such observations is PSR J0108–1431 (hereafter J0108), a very old, non-recycled pulsar (period s, spin-down age Myr, spin-down power ergs s-1, surface magnetic field G), discovered by Tauris et al. (1994). Based on its dispersion measure, DM = 2.38 pc cm-3 (D’Amico et al. 1998), the smallest known for any radio pulsar, and the Galactic coordinates, and , the distance to the pulsar is pc, according to the model for Galactic electron density distribution by Taylor & Cordes (1993) ( pc in the model by Cordes & Lazio 2002). J0108 is not only among the nearest NSs to Earth, but it also has the second lowest known radio luminosity, 0.15 mJy kpc2 at 400 MHz (for pc), and its position in the - diagram is very close to the “pulsar death line” (see Fig. 1). Mignani et al. (2003) carried out deep optical observations of the J0108 field with the Very Large Telescope (VLT) and reported upper limits on its fluxes in several bands (e.g., , ).
Obviously, even a mere detection of such an extremely old, “almost dead” pulsar in X-rays would allow one to probe the pulsar properties in the regime where no other pulsar has been detected outside the radio range. Therefore, we observed J0108 with the Chandra X-ray Observatory. We describe the observation and data analysis in § 2, and discuss implications of our results in § 3.
2. Observations and data analysis
The field of J0108 was observed by Chandra on 2007 February 5 (MJD 54,136) using the Advanced CCD Imaging Spectrometer (ACIS). The observation was carried out in Very Faint mode, and the target was imaged on the ACIS-S3 chip, off-axis. The detector was operated in Full Frame mode, which provides time resolution of 3.24 s. The total scientific exposure time was 30,090 s. As no bad-time intervals (e.g., particle background flares) were found in the data, the whole exposure was used for the analysis. Data reduction was done with the Chandra Interactive Analysis Observations (CIAO) software (ver. 3.4). For the analysis, we used the data reprocessed on 2007 August 5 (ASCD ver. 7.6.11, CALDB ver. 3.4.1)222This reprocessing corrected for a systematic aspect offset of , believed to be the result of a changed thermal environment in early 2007.. We removed the pipeline pixel randomization and used the energy range of 0.3–8 keV to minimize the particle background. We used XSPEC ver. 11.3.2ag for spectral fits.
2.1. Image
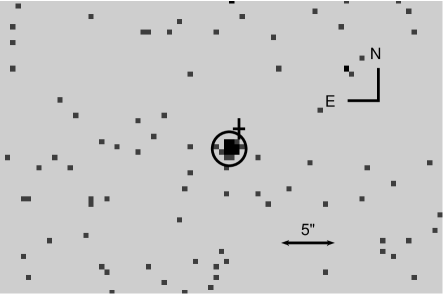
Inspection of the ACIS image shows only one source in the vicinity of the radio pulsar position (see Fig. 2). To measure the coordinates of this pointlike source, we used the CIAO tasks celldetect, wavdetect and vtdetect, which yielded the same source position within the centroiding uncertainty ( for each of the coordinates):
| (1) |
The astrometric uncertainty of this position can be estimated from the empirical distribution of the radial offsets of X-ray positions (aspect solutions) from the accurately known celestial locations for a sample of point sources333See § 5.4 and Fig. 5.4 in the Chandra Proposers’ Observatory Guide, ver. 10, at http://asc.harvard.edu/proposer/POG.. In particular, 68% of the 184 such sources imaged on the S3 chip within from the optical axis have offsets smaller than , and 90% of the sources have offsets . For a two-dimensional Gaussian distribution with equal standard deviations for the (uncorrelated) right ascension and declination offsets, we can estimate the standard deviation as , where is the probability to have a radial offset smaller than . This gives and . The different values of are likely due to the scarce statistics, and we can adopt the larger one as a conservative estimate. Adding the centroiding uncertainty in quadrature, we obtain the total uncertainty for each of the coordinates.
The absolute astrometric position of the target could be improved, in principle, by cross-correlation of the ACIS positions of field X-ray sources with the positions of their optical counterparts in catalogs with sufficiently accurate astrometry, such as the 2MASS catalog. However, we found only two X-ray sources with possible 2MASS counterparts. One of these sources, located northwest of the target, has too few counts to measure its centroid with sufficient precision (centroiding errors are in right ascension and in declination, while the corresponding Chandra 2MASS offsets are and ). As the other source, southeast of the target, looks slightly extended (perhaps a double source) in X-rays, its centroid cannot be reliably measured (e.g., the positions measured with celldetect and wavdetect differ by ). Therefore, the field sources cannot be used for a reliable boresight correction.
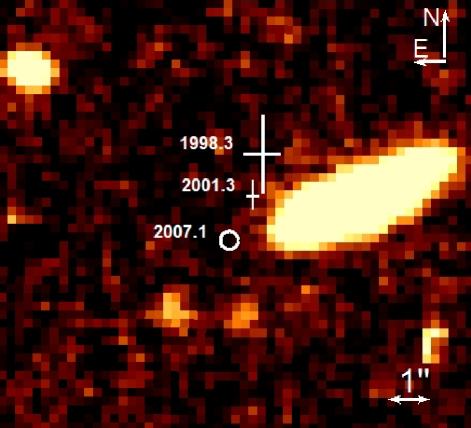
The measured X-ray position differs by from the radio pulsar position in the ATNF Pulsar Catalogue444http://www.atnf.csiro.au/research/pulsar/psrcat (Manchester et al. 2005) derived from timing observations of the pulsar (Hobbs et al. 2004), and it differs by from the radio-interferometric position reported by Mignani et al. (2003). These differences significantly exceed the absolute position uncertainty of Chandra source location and the reported uncertainties of the radio positions (see Fig. 3). Therefore, the source could be either a field object (a star or an AGN) or the pulsar with an appreciable proper motion. Based on the lack of optical sources in the most conservative Chandra error circle, we will argue in § 2.2 that only the latter option is viable, and we will estimate the pulsar proper motion in § 3.1.
2.2. Spectral Analysis
Using the CIAO’s psextract task, we extracted 53 counts from the circular aperture of radius ( encircled energy radius) around the centroid position (Fig. 2). The background was taken from an annulus of around the pulsar. The background region has 57 counts, which corresponds to 0.60 counts when scaled to the source aperture. Thus, the source count rate is counts ks-1, in the aperture and 0.3–8 keV energy range. In Figure 4 we show the energies of all the 53 events detected, which are within the range , and the distribution of their arrival times over the duration of the observation. The distribution of the arrival times does not show statistically significant deviation from the Poisson statistics, i.e. the source does not show flares, which could be seen in X-ray emission from a star or an AGN.

The observed X-ray flux and its variance can be estimated as and , where is the exposure time, is the total number of detected events, is the energy of -th event, and is the detector effective area at energy . For the source under consideration, the flux in the 0.3–8 keV band is ergs cm-2 s-1. This flux is much higher than the upper limits on the optical fluxes within the Chandra error circle, and ergs cm-2 s-1 in the V and B bands, respectively (Mignani et al. 2003). The large X-ray/optical flux ratio [e.g., , where ergs cm-2 s-1] means that the detected source cannot be an ordinary star or an AGN, the usual field sources at high Galactic latitudes, for which and , respectively (see Fig. 1 in Maccacaro et al. 1988, and Table 1 and Fig. 1 in Stocke et al. 1991). The only known objects with are NSs (e.g., – for radio pulsars; see Zavlin & Pavlov 2004). Therefore, we conclude that the source should be the X-ray counterpart of PSR J0108–1431, whose displacement from the previously measured pulsar positions can be attributed to the proper motion of the pulsar.
Because of the small number of counts, we used the -statistic (Cash 1979) for spectral fitting, without binning the count spectrum. The results of spectral fits are presented in Table 1. The errors of the fitting parameters in Table 1 and below in the text are quoted at the 68 confidence level for one interesting parameter, calculated with the XSPEC error command.
| Model | aaHydrogen column density in units of cm-2. Fixed values are in square brackets. | /bbPhoton index for the PL fits or temperature for the BB fits, in eV. | /ccPL normalization in units of photons cm-2 s-1 keV-1 at 1 keV or apparent emitting area in m2. | ddUnabsorbed flux in the 0.3–8 keV range, in units of ergs cm-2 s-1. | eeBest-fit statistic value, for 526 bins used in the fit. | ffX-ray luminosity in the 0.3–8 keV band for the PL fits, or bolometric luminosity for the BB fits, in units of ergs s-1. |
|---|---|---|---|---|---|---|
| PL | 159.5 | 5.9 | ||||
| PL | [0.73] | 163.7 | 2.1 | |||
| PL | [2.0] | 163.0 | 2.2 | |||
| BB | 160.8 | 1.3 | ||||
| BB | [0.73] | 161.0 | 1.3 | |||
| BB | [2.0] | 161.3 | 1.4 |


First, we fit the spectrum with the absorbed PL model, with all the model parameters allowed to vary. Because of the small number of counts, the fit is poorly constrained (see Fig. 5, top). Moreover, the best-fit hydrogen column density obtained in this fit, cm-2, is unrealistically large, at least a factor of 10 larger than the total Galactic neutral hydrogen column density in the direction of J0108: cm-2 (Dickey and Lockman 1990) or cm-2 (Kalberla et al. 2005). The best-fit photon index obtained in this fit, , is considerably higher than those usually observed from radio pulsars.


To better constrain the model parameters, we have to fix the hydrogen column density. Using the pulsar’s dispersion measure ( cm-3 pc-1, which corresponds to the electron column density cm-2) and assuming the typical 10% ISM ionization, we obtain cm-2. With the hydrogen column density fixed at this value, we obtain a smaller photon index, , and a lower unabsorbed flux, ergs cm-2 s-1 (see Fig. 6, top, Fig. 7, and Table 1), corresponding to the isotropic luminosity ergs s-1 (). Changing the value of the fixed hydrogen column density within a reasonable range, , changes the fitting parameters only slightly because the ISM absorption in the observed energy band is very low at such small values (see the fit for cm-2 in Table 1).

The fit of the same count-rate spectrum with the absorbed BB model with the hydrogen column density allowed to vary yields lower values ( cm-2, consistent with cm-2 estimated from the DM value; see Fig. 5, bottom, and Table 1). The fit with the column density fixed at cm-2 gives approximately the same temperature keV ( MK) and projected emitting area m2 as the fit with free (see Fig. 6, bottom, and Fig. 8). This temperature and area correspond to the apparent radius m and bolometric luminosity ergs s-1. Similar to the PL fit, the fitting parameters very weakly depend on (see Table 1) as long as it remains within reasonable limits. We also tried a PL+BB fit, but the fitting parameters could not be constrained because of the small number of counts.
3. Discussion
3.1. Proper motion
Based on the large X-ray/optical flux ratio, we have concluded in § 2.2 that the point source we detected with the Chandra ACIS is the X-ray counterpart of the J0108 pulsar. As its X-ray position is different from those reported from earlier radio observations (see § 2.2), we can estimate the pulsar’s proper motion.
Among the previously measured pulsar coordinates,
the most reliable ones,
,
,
were obtained in the 11.3 hr interferometric observation
with the Australia Telescope Compact Array (ATCA) at epoch MJD 51,999
(Mignani et al. 2003). Comparing these coordinates with those we
measured, we obtain the proper motion
| (2) |
or
| (3) |
for the total proper motion and the position angle (counted east of north).
In addition to the interferometric position, timing positions of J0108 have been reported by Tauris et al. (1994), D’Amico et al. (1998), and Hobbs et al. (2004). The position reported by Hobbs et al. (, ; mean epoch MJD 50,889 [1998.3]), quoted in the current version of the ATNF Pulsar Catalogue (Manchester et al. 2005), is supposed to be the most accurate because it used data acquired during the longest time span of 9.6 yr, versus 1 yr and 3 yr for the measurements by Tauris et al. and D’Amico et al., respectively. Moreover, the Hobbs et al. position supresedes the earlier ones because it includes the data used by Tauris et al. and D’Amico et al.555 We should note that the position reported by D’Amico et al. is not consistent with the other two timing positions if its very small errors ( and in R.A. and decl., respectively) are taken at face value. As these position errors are a factor of 10 smaller than those of the Hobbs et al. position based on a factor of 3 longer observation time span, we suppose that the errors were strongly underestimated. Therefore, the upper limit on the proper motion, mas/yr, obtained by Mignani et al. (2003) from the comparison of the ATCA position with the position reported by D’Amico et al., should be disregarded. Using the Hobbs et al. position together with the the ATCA and Chandra positions, we find the proper motion
| (4) |
| (5) |
consistent with that given by equations (2) and (3). (We should note, however, that the weights of the ATCA-Chandra pair in this and values, 0.76 and 0.73, respectively, are larger than those of the two other pairs because of the larger uncertainties of the timing position.)
The inferred proper motion corresponds to the transverse pulsar velocity km s-1, somewhat lower than the typical transverse velocity of 300–400 km s-1. The proper motion in the Galactic coordinates is , , i.e., the pulsar is moving farther south from the Galactic plane.
Interestingly, a recent re-analysis of the original VLT observations (epoch 2000.6) have shown a faint object (, , ), whose position (at the outskirts of the bright field galaxy) virtually coincides with that following from the backward extrapolation of the proper motion to the epoch of the VLT observations (Mignani et al. 2008). Assuming this is the optical counterpart of J0108, its X-ray/optical flux ratios for the V and B bands (, ) are consistent with typical values for radio pulsars (Zavlin & Pavlov 2004; Zharikov et al. 2006), while the relatively high flux in the U band might indicate thermal emission from the bulk of the NS surface with a brightness temperature K, too low to be detected in X-rays666Such a relatively high surface temperature of the very old NS could be explained by (re)heating processes in the NS interiors (see Mignani et al. 2008 for discussion and references).. The optical detection (if confirmed) provides additional support to the identification of the detected X-ray source with the J0108 pulsar and to our estimate of the proper motion.

3.2. Energetics and spectrum
J0108 is the least powerful and the oldest among the ordinary (nonrecycled) pulsars detected in the X-ray range. The previous record-holders have a factor of 15 higher spin-down power (B1133+16) and a factor of 9.5 smaller spin-down age (B0950+08). Therefore, our observation of J0108 has yielded the pulsar X-ray properties, such as the spectrum and luminosity, in the yet unexplored parameter domain, allowing us to examine the evolution of pulsar X-ray emission at very late stages of pulsar activity.
The small number of source counts detected does not allow us to differentiate between the alternative spectral models for J0108. For the PL fit with the hydrogen column density fixed at cm-2, we obtained the spectral slope , somewhat softer than the typical values, –2, observed for young, more powerful pulsars (e.g., Gotthelf 2003). However, some old pulsars show even steeper spectra, –3 (e.g. for PSR B1133+16; Kargaltsev et al. 2006), suggesting that pulsar spectra might soften with increasing age (i.e., decreasing spin-down power). This softening can be ascribed to either an evolution of the energy spectrum of magnetospheric particles or to a larger contribution of soft thermal emissison from polar caps in old, low-powered pulsars (e.g., Zavlin & Pavlov 2004).
The luminosity found from the PL fit (e.g., ergs s-1; see § 2.2 and Table 1) is the lowest among the luminosities of ordinary pulsars detected in X-rays. This is demonstrated in Figure 9, where we plot the 1–10 keV luminosities of nine old, low-powered pulsars ( ergs s-1). Adding J0108 to the sample makes it clear that the X-ray luminosity of old pulsars is correlated with the spin-down power in the same manner as has been observed for younger pulsars (i.e., generally grows with , albeit with a large scatter; e.g., Possenti et al. 2002; Li et al. 2008; Kargaltsev & Pavlov 2008). The X-ray efficiency, , can be estimated for J0108 as . This efficiency is larger than the typical efficiencies, –, of younger, more powerful pulsars (see e.g., Fig. 5 in Kargaltsev & Pavlov 2008), but it is comparable with the efficiencies of old pulsars (see Fig. 9). This supports the conjecture that, on average, old pulsars radiate a larger fraction of their spin-down power in the X-ray range than younger ones (Zharikov et al. 2006; Kargaltsev et al. 2006).
The higher X-ray efficiency could be attributed to the additional contribution of soft X-ray polar cap emission, in accordance with the softer X-ray spectra of old pulsars. This hypothesis could be tested by deep X-ray observations that would allow phase-resolved spectroscopy and energy-resolved timing (because the polar cap radiation, which dominates at lower energies, should show shallower pulsations than the magnetospheric radiation; e.g., Zavlin & Pavlov 2004). Alternatively, one could speculate that the broadband magnetospheric spectrum shifts toward lower energies with decreasing , so that the soft X-ray efficiency increases at the expense of decreasing hard X-ray or soft -ray efficiency. Observations at higher energies with future missions could verify this hypothesis.
As we have mentioned in §2.2, the observed X-ray spectrum of J0108 can be fitted with a BB model, which might be interpreted as thermal radiation from heated polar caps. The best-fit BB temperature, 3.2 MK, obtained from this fit, is within the 1.7–3.5 MK range found from BB (or PL+BB) fits for other old pulsars (Zavlin & Pavlov 2004; Kargaltsev et al. 2006; Misanovic et al. 2008; Gil et al. 2008). The projected emitting area, m2, is, however, exremely small. Not only it is considerably smaller than the smallest area reported ( m2 for PSR B0834+06), but also the ratio, , of this area to the conventional polar cap area, m2, is smaller than for any other pulsar. We should bear in mind, however, that both the temperature and the area are not only highly uncertain because of the strong correlation of these parameters (see Fig. 8), but they are also strongly dependent on the model of thermal emission (e.g., fits with hydrogen NS atmosphere models usually give a factor of 2 lower effective temperature and a factor of 10–100 larger area; Pavlov et al. 1995; Zavlin & Pavlov 2004). The large difference between the observed and conventional areas can be also explained by the assumption that the non-dipolar component of the magnetic field at the NS surface is much stronger than the dipolar component inferred from the pulsar spindown, in accordance with the partially screened gap model for the inner acceleration region above the pulsar polar cap (Gil et al. 2003). Finally, the relationship between the actual emitting area and depends on the orientation of the magnetic and spin axes, and on the General Relativity effects (see discussion in Pavlov et al. 2007).
The apparent bolometric luminosity, ergs s-1, which is less model-dependent than and (Zavlin & Pavlov 2004), is also smaller than those of the other old pulsars; however, the corresponding “polar cap efficiency”, , is comparable to (or even larger than) those reported for other pulsars. Such an efficiency exceeds the predictions of the polar cap heating models by Harding & Muslimov (2001, 2002)777Since the curvature radiation cannot induce a pair cascade in the low-powered J0108, only the less efficient inverse Compton scattering (ICS) cascade can be responsible for polar cap heating in this pulsar. The and estimated from our observation of J0108 are close to the analytical estimates for upper limits on these quantities for the resonant ICS heating (eqs. [60] and [64] in Harding & Mulsimov 2002). However, an extrapolation of the numerical calculations of these authors into the J0108 parameter domain seems to predict lower values. , but it is in a reasonable agreement with the partially screened gap model by Gil et al. (2003, 2008) . We should not forget, however, that this is only an upper limit because the observed spectrum can contain a nonthermal component.
3.3. Summary
Thanks to the high sensitivity of the Chandra ACIS, we have detected J0108, the oldest and the least powerful pulsar ever observed in X-rays. This observation has shown that even very old pulsars can be rather efficient X-ray emitters, even more efficient than young ones. It seems likely that the observed emission contains both magnetospheric and thermal components. To separate these components and understand the nature of the X-ray emission, a deep XMM-Newton observation, which would provide not only high sensitivity but also a sufficient time resolution, would be particularly useful. To evaluate the X-ray luminosity and efficiency of J0108 more accurately, the distance to the pulsar should be determined from annual parallax measurements.
Comparing the Chandra position of J0108 with the previously measured radio positions, we have been able to estimate the pulsar’s proper motion of about 200 mas/yr. To determine the proper motion with a higher accuracy, radio observations with ATCA and/or VLA are required. Alternatively, the proper motion can be accurately measured with new Chandra observations in a few years from now.
The detection of the candidate optical counterpart of J0108 (Mignani et al. 2008) was hampered by the proximity of its sky position to the bright field galaxy (see Fig. 3). Our estimate of the proper motion suggests that it has moved away from the galaxy and could be firmly detected in the near future. Measuring its optical-UV spectrum would be particularly important for understanding the thermal evolution and magnetospheric emission of old NSs.
References
- (1) Becker, W., Weisskopf, M. C., Tennant, A. F., Jessner, A., Dyks, J., Harding, A. K., & Zhang, S. N. 2004, ApJ, 615, 908
- (2) Becker, W., Jessner, A., Kramer, M., Testa, V., & Howaldt, C. 2005, ApJ, 633, 367
- (3) Becker, W., et al. 2006, ApJ, 645, 1421
- (4) Cash, W. 1979, ApJ, 228, 939
- (5) Cordes, J. M., & Lazio, T. J. W. 2002, preprint (arXiv:astro-ph/0207156)
- (6) D’Amico, N., Stappers, B. W., Bailes, M., Martin, C. E., Bell, J. F., Lyne, A. G., & Manchester, R. N. 1998, MNRAS, 297, 28
- (7) Dickey, J. M., & Lockman, F. J. 1990, ARA&A, 28, 215
- (8) Gil, J., Melikidze, G., & Geppert, U. 2003, A&A, 407, 315
- (9) Gil, J., Haberl, F., Melikidze, G., Geppert, U., Zhang, B., & Melikidze Jr., G. 2008, ApJ, 686, 497
- (10) Gotthelf, E. V. 2003, ApJ, 591, 361
- (11) Harding, A. K., & Muslimov, A. G. 2001, ApJ, 556, 987
- (12) Harding, A. K., & Muslimov, A. G. 2002, ApJ, 568, 862
- (13) Hui, C. Y., & Becker, W. 2007, A&A, 467, 1209
- (14) Hobbs, G., Lyne, A. G., Kramer, M., Martin, C. E., & Jordan, C. 2004, MNRAS, 353, 1311
- (15) Kalberla, P. M. W., et al. 2005, A&A, 440, 775
- (16) Kargaltsev, O., & Pavlov, G. G. 2008, in 40 Years of Pulsars: Millisecond Pulsars, Magnetars and More, eds. C. Bassa, A. Cumming, V. M. Kaspi, & Z. Wang, AIP Conf. Proc., 983, 171 (preprint arXiv:0801.2602)
- (17) Kargaltsev, O., Pavlov, G. G., & Garmire, G. P. 2006, ApJ, 636, 406
- (18) Li, X.-H., Lu, F.-J., & Li, Z. 2008, ApJ, 682, 1166
- (19) Maccacaro, T., Gioia, I., Wolter, A., Zamorani, G., & Stocke J. T. 1988, ApJ, 326, 680
- (20) Manchester, R. N., Hobbs, G. B., Teoh, A., & Hobbs, M. 2005, AJ, 129, 1993
- (21) Mignani, R. P., Manchester, R. N., & Pavlov, G. G. 2003, ApJ, 582, 978
- (22) Mignani, R. P., Pavlov, G. G., & Kargaltsev, O., 2008, A&A, 488, 1027
- (23) Misanovic, Z., Pavlov, G. G., & Garmire, G. P. 2008, ApJ, 685, 1129
- (24) Pavlov, G. G., Shibanov, Y. A., Zavlin, V. E., & Meyer, R. D. 1995, in The Lives of the Neutron Stars, Eds. M. A. Alpar, U. Kiziloğlu, & J. van Paradijs (Dordrecht: Kluwer), 71
- (25) Pavlov, G. G., Kargaltsev, O., Garmire, G. P., & Wolszczan, A. 2007, ApJ, 664, 1072
- (26) Possenti, A., Cerutti, R., Colpi, M., & Mereghetti, S. 2002, A&A, 387, 993
- (27) Stocke, J. T., Morris, S. L., Gioia, I. M., Maccacaro, T., Schild, R., Wolter, A., Fleming, T. A., & Henry, J. P. 1991, ApJS, 76, 813
- (28) Tauris, T. M., et al. 1994, ApJ, 428, L53
- (29) Taylor, J. H., & Cordes, J. M. 1993, ApJ, 411, 674
- (30) Tepedelenlioğlu, E., & Ögelman, H. 2005, ApJ, 630, L57
- (31) Yakovlev, D. G., & Pethick, C. J. 2004, ARA&A, 42, 169
- (32) Zavlin, V. E., & Pavlov, G. G. 2004, ApJ, ApJ, 616, 452
- (33) Zharikov, S. V., Shibanov, Yu. A., Mennickent, R. E., Komarova, V. N., & Tovmassian, G. H. 2004, A&A, 417, 1017
- (34) Zharikov, S., Shibanov, Yu., & Komarova, V. 2006, AdSpR, 37, 1979
- (35) Zhang, B., Sanwal, D., & Pavlov, G. G., 2005, ApJ, 624, L109