Discovery of a T Dwarf Binary with the Largest Known -Band Flux Reversal11affiliation: Some of the data presented herein were obtained at the W.M. Keck Observatory, which is operated as a scientific partnership among the California Institute of Technology, the University of California and the National Aeronautics and Space Administration. The Observatory was made possible by the generous financial support of the W.M. Keck Foundation. This paper includes data gathered with the 6.5-m Magellan Telescopes located at Las Campanas Observatory, Chile.
Abstract
We present Keck laser guide star observations of two T2.5 dwarfs – 2MASS J11061197+2754225 and 2MASS J140449413159329 – using NIRC2 on Keck-II and find 2MASS J140449413159329 to be a 013 binary. This system has a secondary that is 0.45 mags brighter than the primary in -band but 0.49 mags fainter in -band and 1.13 mags fainter in -band. We use this relative photometry along with near-infrared synthetic modelling performed on the integrated light spectrum to derive component types of T1 1 for the primary and T5 1 for the secondary. Optical spectroscopy of this system obtained with Magellan/LDSS-3 is also presented. This is the fourth L/T transition binary to show a flux reversal in the 1–1.2 m regime and this one has the largest flux reversal. Unless the secondary is itself an unresolved binary, the -band magnitude difference between the secondary and primary shows that the -band “bump” is indeed a real feature and not an artifact caused by unresolved binarity.
Subject headings:
binaries: general, close – stars: individual (2MASS J11061197+2754225, 2MASS J140449413159329) – stars: low-mass, brown dwarfs – techniques: high angular resolution, spectroscopy1. Introduction
As brown dwarfs cool and pass through the L/T spectral class boundary, their spectral morphologies transition from red near-infrared (NIR) colors of the L dwarf class, caused by condensate dust in their photospheres, to blue NIR colors of the T dwarf class, where their photospheres are relatively clear of dust. This transition is rapid, as implied by the nearly flat effective temperature scale around 1400 K for NIR L7–T5 dwarfs (Golimowski et al. 2004; Kirkpatrick 2005, bottom panel of Fig. 7 in that paper). Within this transition, a remarkable brightening in -band (M 1) from spectral types T1T5, known as the -band “bump” (Dahn et al., 2002; Tinney et al., 2003; Vrba et al., 2004), has been noted.
Two withstanding mechanisms to explain this brightening have been suggested: (1) the “patchy clouds” model – proposed by Burgasser et al. (2002) (see also Ackerman & Marley 2001), suggesting that the break-up of clouds in the atmosphere allows hot flux from inner layers to emerge (analogous to the 5 m hot spots of Jupiter), and (2) the “sudden downpour” model – proposed by Knapp et al. (2004), suggesting that the dust clouds suddenly condense out due to an increase in sedimentation efficiency.
Recent studies of brown dwarf binaries have revealed that a fraction of the amplitude in this bump can be explained by systems appearing overluminous due to binarity (i.e., “crypto-binarity”; Burgasser et al. 2006b; Liu et al. 2006; Burrows et al. 2006); however, some part of this brightening is intrinsic to the atmospheres as they cool. This was revealed by HST/WFPC2 imaging of 2MASS J17281150+3948593AB (hereafter 2MASS 1728AB), the first 1–1.2 m flux reversal binary, which has a T dwarf secondary brighter in -band but fainter in -band than the mid-to late-type L dwarf primary (Gizis et al., 2003). No -band resolved photometry for this system has been published. Two later discoveries of 1–1.2 m flux reversal binaries – SDSS J102109.69030420.1 (hereafter SDSS 1021; HST/NICMOS, Burgasser et al. 2006b) and SDSS J153417.05+161546.1 (hereafter SDSS 1534; Keck LGS AO/NIRC2, Liu et al. 2006) – provided additional information on the flux reversals. Both systems were found to have a secondary brighter than the primary in -band (see Table 1).
L dwarf/T dwarf binaries such as those listed above provide crucial information on the L/T transition, as the components of these systems are likely coeval, with common ages and compositions. In an effort to identify additional systems, we have performed high angular resolution imaging of two T2.5 dwarfs – 2MASS J11061197+2754225 (hereafter 2MASS 1106) and 2MASS J140449413159329 (hereafter 2MASS 1404). These objects were identified in a NIR proper motion survey (Looper et al. 2007; Kirkpatrick et al., in prep) based on multi-epoch data from the Two Micron All Sky Survey (2MASS; Skrutskie et al. 2006). Both systems are in the field, unassociated with any higher mass stars within a radius of 10 arcminutes111See http://simbad.u-strasbg.fr/simbad/.. 2MASS 1404 was discovered to be a fourth resolved L/T transition system showing this 1–1.2 m flux reversal. These observations were made using the Keck II sodium laser guide star adaptive optics system. We describe these observations and optical spectroscopy of 2MASS 1404 in 2, discuss the results of this imaging and implications for the -band bump in 3, and give our conclusions in 4.
2. Observations
2.1. High Resolution Imaging: Keck II 10.0-m/NIRC2 LGS AO
We used the Keck II 10.0 m Telescope222Located on the summit of Mauna Kea, Hawaii. Sodium Laser Guide Star Adaptive Optics (LGS AO) system (Wizinowich et al., 2006; van Dam et al., 2006) on 2006 June 3 UT to observe 2MASS 1106 and 2MASS 1404. Observations were taken using the NIRC2 narrow camera and the Mauna Kea Observatories (MKO) filter set (Tokunaga et al., 2002): -band (2.15 m) for 2MASS 1106 and (1.25 m), (1.635 m), and -bands for 2MASS 1404. The field of view was 102 with a 000994 pixel scale. Nearby ( 60) and bright ( mag) stars were selected from the USNO-B1.0 catalog (Monet et al., 2003) to provide for tip-tilt (TT) sensing. For 2MASS 1106, the TT star (USNO-B1.0 1179-0233699) had a brightness of mag and a separation of 52. For 2MASS 1404, the TT star (USNO-B1.0 0580-0365843) had a brightness of mag and a separation of 29. Conditions were clear and photometric with good seeing at the start of the night (07 at -band) with slight degradation afterwards.
For 2MASS 1106, we dithered by a few arcseconds between positions to obtain a set of eight images with an integration time of 60 sec for each position, for a total on-source integration time of 480 sec. For 2MASS 1404, we dithered by a few arcseconds between positions, for a total of six images for each of the three filters. Integration times per position were 90 sec, 60 sec, and 60 sec for a total integration time of 540 sec, 360 sec, and 360 sec in the , , and filters, respectively. The full widths at half maximum (FWHM) in the filter were 0 and 0 for 2MASS 1106 and 2MASS 1404, respectively.
We employed standard reduction techniques. Flats were created from differenced lights-on and lights-off images of the telescope dome interior. A super-sky frame was created from the median of the individual science frames and was subsequently subtracted from each frame. The background subtracted images were shifted so that the target landed on the same position and were then stacked to form the final mosaic.
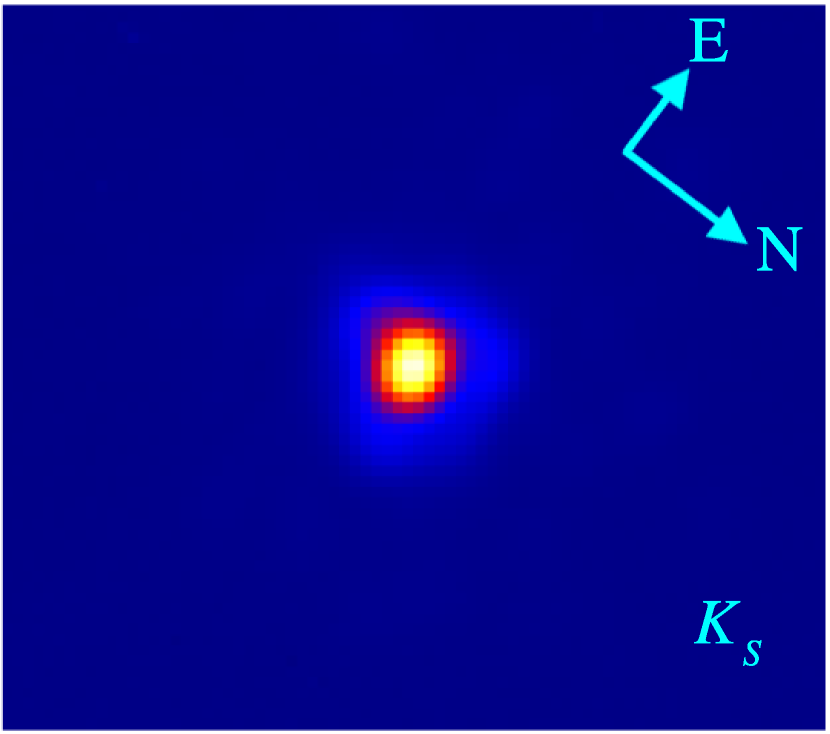
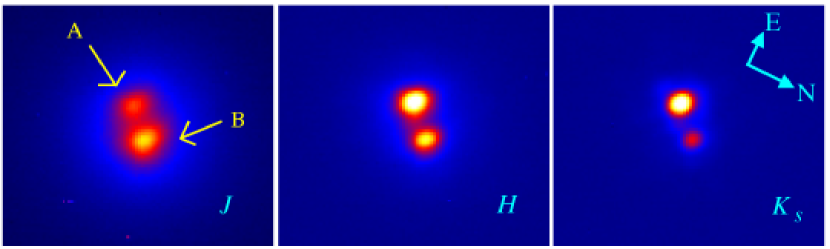
In the mosaic of 2MASS 1106 (see Fig. 1), the target is not elongated and no other objects, companions or background sources, are seen. On the other hand, we have resolved 2MASS 1404 into two components, shown in Fig. 2. Based on the large proper motion of this system ( = 035 yr-1) and the elapsed 5.3 yrs between the first 2MASS observation of this field (2001 Feb 4 UT) and our observation with Keck II (2006 Jun 3 UT), we should be able to see both components separated in the 2MASS image, which has a plate scale of 1, if they were not physically associated. Because we do not see an object on the 2001 2MASS image that is positionally coincident with the double seen in our 2006 Keck image, we conclude that this is a physical binary unresolved in 2MASS images. Using the -band final mosaic, which has the smallest FWHM, we find a separation, , of 01336 00006 and a position angle, , of 311.8∘ 0.7∘.
We performed an image subtraction technique in all three bands to obtain final flux ratios for the 2MASS 1404AB system. To do this, we computed the centroid for the component to be subtracted and placed this component at the center of a 257257 pixel subimage. This subimage was copied, rotated 180 degrees, and then subtracted from the original, non-rotated subimage. The quality of the subtraction was checked both visually and by examination of the radial profile of the unsubtracted component. In many cases, small offsets had to be applied by hand to obtain optimal subtraction. Aperture photometry was performed on the unsubtracted objects and used to obtain the flux ratio difference of the components.
Errors in the rotation-subtraction technique were estimated by creating fake binaries from (presumably) single objects observed with NIRC2 in LGS AO mode and having similar image qualities as 2MASS 1404AB. The fake binaries were created at 25 different separations and position angles. The same rotation-subtraction technique was performed on these binaries as was done for 2MASS 1404AB. The magnitude of each component was taken to be the average of the 25 separate measurements and the error was the standard deviation of the measurements.
The final errors in the photometry for 2MASS 1404AB are the square root of the sum of squares for the following eight terms: the errors in the single point-spread function (PSF) photometry (both A and B), the standard deviation of the binary PSF photometry (both A and B), the difference between the single and binary PSF photometry (both A and B), and the errors in 2MASS 1404AB photometry (both A and B). The final flux ratios for 2MASS 1404AB are shown in Table 2.
2.2. Red Optical Spectroscopy: Magellan 6.5-m/LDSS3
Red optical spectroscopy (6000–10500 ) of the 2MASS 1404AB system was obtained on 2006 May 8 (UT) with LDSS-3 (upgraded from LDSS-2, Allington-Smith et al. 1994) on the 6.5-m Magellan Clay Telescope. Conditions were clear with good seeing (06 at -band). The VPH-red grism (660 lines/mm) and the OG590 longpass filter were used with a 075 (4 pixels) slit, resulting in R = 1800. The slit was rotated to the parallactic angle to minimize slit losses. Dispersion across the chip was 1.2 Å/pixel. We obtained two exposures of 1500 sec each, for a total integration time of 50 minutes at an average air mass of 1.01. The flux standard star LTT 7987 (Hamuy et al., 1994) was observed the previous night (2006 May 7 UT) using an identical set-up. Calibration exposures were taken using the HeNeAr arc lamp and the flat-field quartz lamp. The G2 V star HD 127526 was observed immediately prior to 2MASS 1404AB to use as a correction for telluric absorption.
LDSS-3 data were reduced in the IRAF333IRAF is distributed by the National Optical Astronomy Observatories, which are operated by the Association of Universities for Research in Astronomy, Inc., under cooperative agreement with the National Science Foundation. environment. Raw science images were first trimmed, bias-subtracted and then divided by the normalized, median-combined and bias-subtracted set of flat field frames. Spectra were optimally extracted using the APALL task, with the extraction of HD 127526 used as a dispersion template for 2MASS 1404AB. Wavelength solutions were determined from the arc lamp spectra; solutions were accurate to 0.1 pixels, or 0.12 Å. Flux calibration was determined using the tasks STANDARD and SENSFUNC with observations of LTT 7987, adequate over the spectral range 6000–10000 Å. Corrections to telluric O2 (6860–6960 Å B-band, 7580–7700 Å A-band) and H2O (7150–7300 and 9270–9675 Å) absorption bands were computed using the G dwarf spectrum.
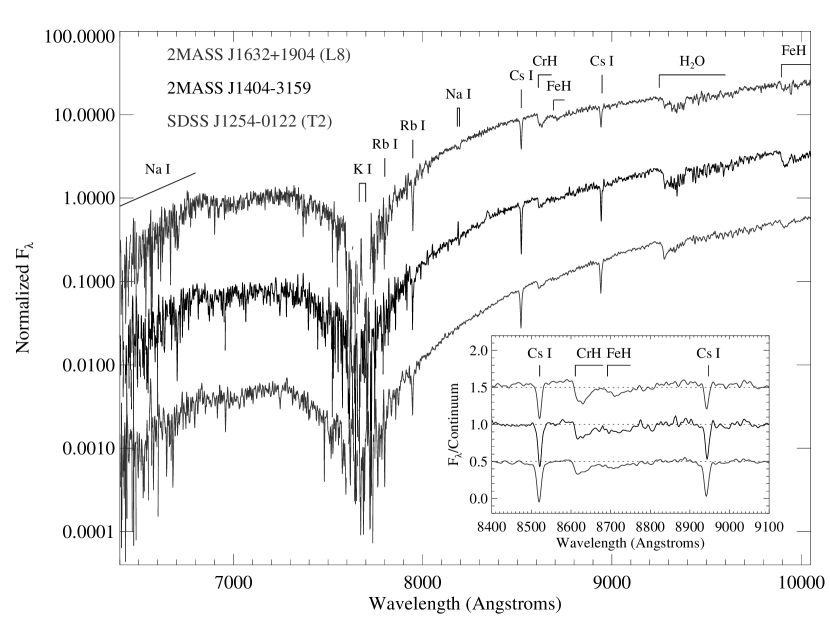
The optical spectrum is shown in Fig. 3, along with the L8 optical standard 2MASS J1632291+190441 (hereafter 2MASS 1632, Kirkpatrick et al. 1999) and the T2 optical standard SDSS J125453.90012247.4 (hereafter SDSS 1254, Burgasser et al. 2003b) for comparison. The spectra are shown on a log flux scale and have been smoothed to R1000 to match the resolution of 2MASS 1632 observed with Keck/LRIS. Overall, the continuum of 2MASS 1404AB is intermediate between the L8 and T2 standards, consistent with an optical spectral type of T0. The inset box in this same figure shows the Cs I lines and FeH/CrH bands between 8400 and 9100 Å. The spectra shown in this insert have been divided through by a 4th-order polynomial fit to the continuum in order to highlight the strength of these features. The Cs I lines are of comparable strength in 2MASS 1404AB as in SDSS 1254, while the FeH/CrH band in 2MASS 1404AB is intermediate between the L8 and T2 standards. We therefore adopt an optical spectral type of T0 1 for the 2MASS 1404AB system.
3. Analysis
3.1. New M-Spectral Type Relations Based on 2MASS Photometry
We have derived absolute magnitude versus spectral type relations using optically classified late-type M and L dwarfs and NIR classified T dwarfs with parallax measurements of signal-to-noise ratio (S/N) 5 and not known to be binary (collected from: Perryman et al. 1997; Dahn et al. 2002; Tinney et al. 2003; Vrba et al. 2004). The coefficients of the sixth-degree polynomial fits to this unweighted data are given in Table 3 and shown graphically in Fig. 4. We have used optical spectral classification for the L dwarfs because no formal L dwarf NIR spectral classification scheme has been constructed444Geballe et al. (2002) have identified classification indices based on NIR molecular absorption bands.. These relations use the new NIR spectral classification scheme for T dwarfs (Burgasser et al., 2006a), superceding previous MJHK versus spectral type (SpT) relations on the old NIR T dwarf scheme (Geballe et al., 2002; Burgasser et al., 2002).
3.2. Component Spectral Types of 2MASS 1404AB
Since the relative - and -band photometry is on the MKO photometric system and the relative -band photometry is on the 2MASS photometric system, we need to convert the -band photometry onto the same MKO system. To do this, we examined a set of 25 L6.0–T2.0 dwarfs, described below, and computed the (2MASSMKO) -band color term as 0.01 0.04 averaged over these spectral classes. We show the breakdown of this color term per spectral class in Table 4. Since this color term difference is near zero, we assume the two are equivalent and proceed to determining the component MKO photometry, using the following steps:
-
1.
Convert (2MASS) to (MKO) using the (MKO2MASS) color term computed from the spectrum of 2MASS 1404AB (Looper et al., 2007). (MKO2MASS) = 0.17; (MKO) = 15.41 0.07.
-
2.
Decompose the system: = + 2.5 log(1 + 10); = +, where = . (MKO) = 16.46 0.12.
-
3.
Similarly, = + 2.5 log(1 + 10); = +, where = . (MKO) = 15.93 0.09.
In the same manner, this procedure was carried out to determine the MKO -band and -band component photometry (see Table 5).
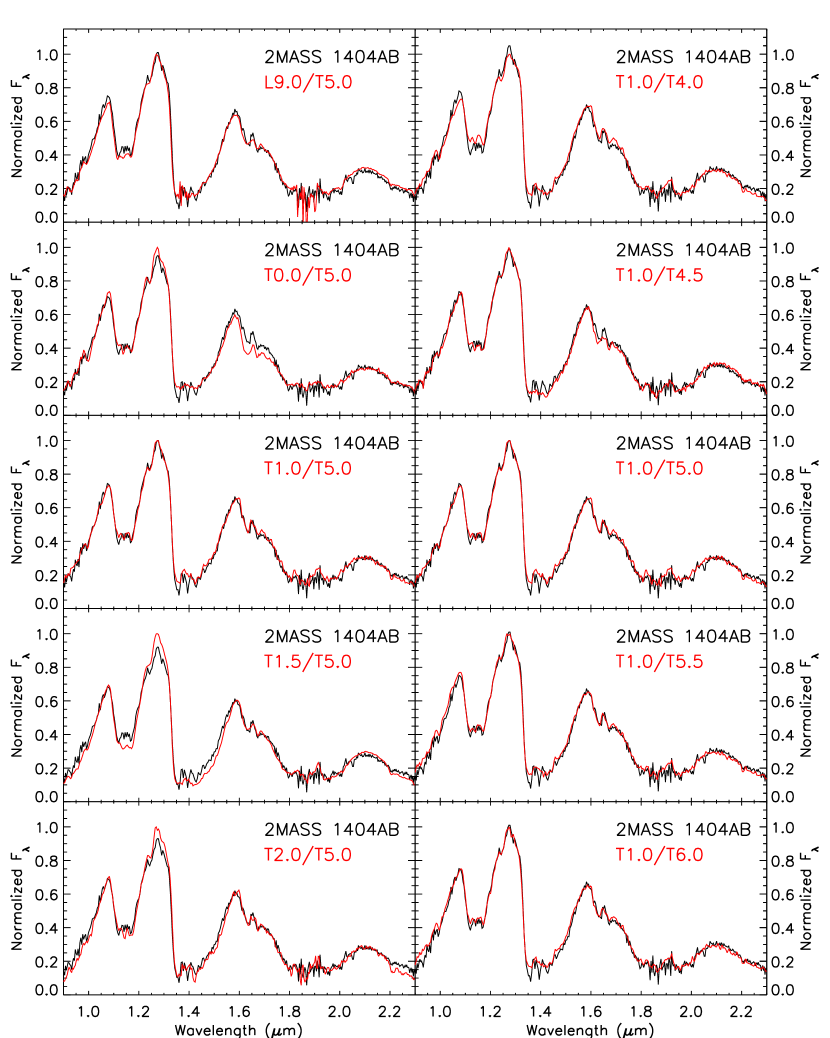
To estimate NIR spectral types for the AB components, we compared the integrated light spectrum to a suite of synthetic IRTF/SpeX spectra constructed in the same manner as Burgasser et al. (2008). The constituents for these synthetic spectra are the 25 L6T2 dwarfs, used for the primaries, and the 38 T3T8 dwarfs, used for the secondaries, as listed in Burgasser et al. (2008)555Also, see http://web.mit.edu/ajb/www/browndwarfs/spexprism/html/binarytemplates.html for a list of these 63 spectra, where we have eliminated 2MASS J215138394853542 (T4) and 2MASS J051035204208140 (T5) from the list of T3T8 dwarfs used due to the poor signal-to-noise ratio (SNR) of their spectra., which is drawn from Burgasser et al. (2004, 2006a, 2006c); Burgasser (2007); Chiu et al. (2006); Cruz et al. (2004); Liebert & Burgasser (2007); Looper et al. (2007); Reid et al. (2006); Siegler et al. (2007). In cases where more than one spectrum for an object was available, we used the highest SNR spectrum available. All combinations of primary and secondary were scaled together using the MJ magnitude from the MJ-SpT relation derived above in 3.1. This resulted in 1000 synthetic spectra. To estimate the goodness of fit between the data (2MASS 1404AB) and each model, we first interpolated the flux of the models onto the wavelength scale of the data and normalized each to their peak flux over the 1.2–1.3 m window. We then calculated the values666Defined as (, where is the data for 2MASS 1404AB, is the synthetic model spectrum, and are the errors in the data for 2MASS 1404AB. The summation is performed over the wavelengths 0.95–1.35, 1.45–1.8, and 2.0–2.35 m. between the data and each model over the wavelength ranges 0.95–1.35 m, 1.45–1.8 m, and 2.0–2.35 m to avoid low S/N regions of the spectra. In addition, we calculated for a range of multiplicative scale factors (0.5 to 1.5) of the data, in steps of 0.01, to eliminate the normalization bias, selecting the normalization that yielded .
From the 1000 model spectra, we selected the 15 spectra with the smallest values for visual inspection. The model spectrum created from SDSS J205235.31160929.8 (T1, hereafter SDSS 2052; Chiu et al. 2006) for the primary and from 2MASS J233123784718274 (T5, hereafter 2MASS 2331; Burgasser et al. 2004) for the secondary with the same normalization provided the best fit and yielded 2MASS = 0.18 mag. We also examined model combinations constructed from two earlier type (L9 and T0) and two later type (T1.5 and T2) primaries with a T5 used as the secondary. In addition, we examined model combinations constructed from a T1 as the primary and two earlier type (T4 and T4.5) and two later type (T5.5 and T6) secondaries. Since many spectra with identical spectral types were available, we used those with model spectra that minimized . All fits are shown in Fig. 5. The best fit is clearly the T1/T5 model, which shows an excellent match to the data of 2MASS 1404AB over all wavelengths. Deviating the spectral type of either the primary or secondary by a subtype or more while holding the other fixed, results in a degraded goodness of fit to the data. We therefore estimate a final NIR spectral type of the primary as T1 1 and of the secondary as T5 1.
Using the MKO component photometry of 2MASS 1404AB and component spectral type estimates of T1 and T5, we compute the 2MASS component photometry (see Table 5) using the appropriate transformations from Stephens & Leggett (2004). These relations are dependent on spectral type with errors that add negligibly to the component photometric errors. We can compare the relative 2MASS -band photometry obtained from imaging, = 0.45 0.15, to that obtained from our synthetic spectral modeling, = 0.18, using a T1 primary and a T5 secondary. The relative 2MASS -band photometry obtained from our synthetic spectral modeling is 1.8 sigma from our relative 2MASS -band photometry obtained from imaging. It confirms that the secondary is indeed brighter than the primary in -band.
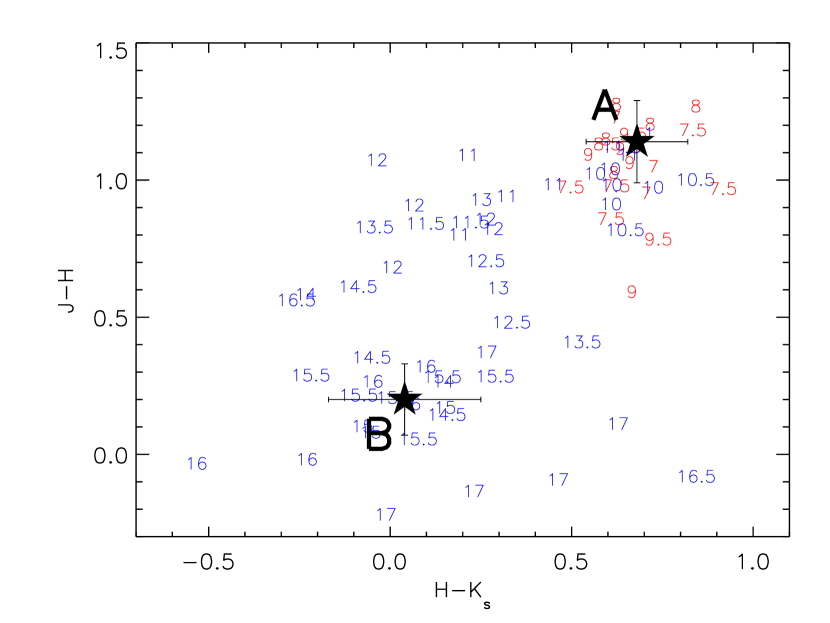
As a check on our spectral type estimates, we compute 2MASS NIR colors of each component and compare these to the 2MASS NIR colors of published L and T dwarfs777See http://dwarfarchives.org. in Fig. 6. In this color-color diagram, component A is seen coincident with a cluster of L7T1 dwarfs. Component B is associated with a cluster of T4T6 dwarfs. This color comparison yields an average spectral type estimate of L9 for component A and T5 for component B.
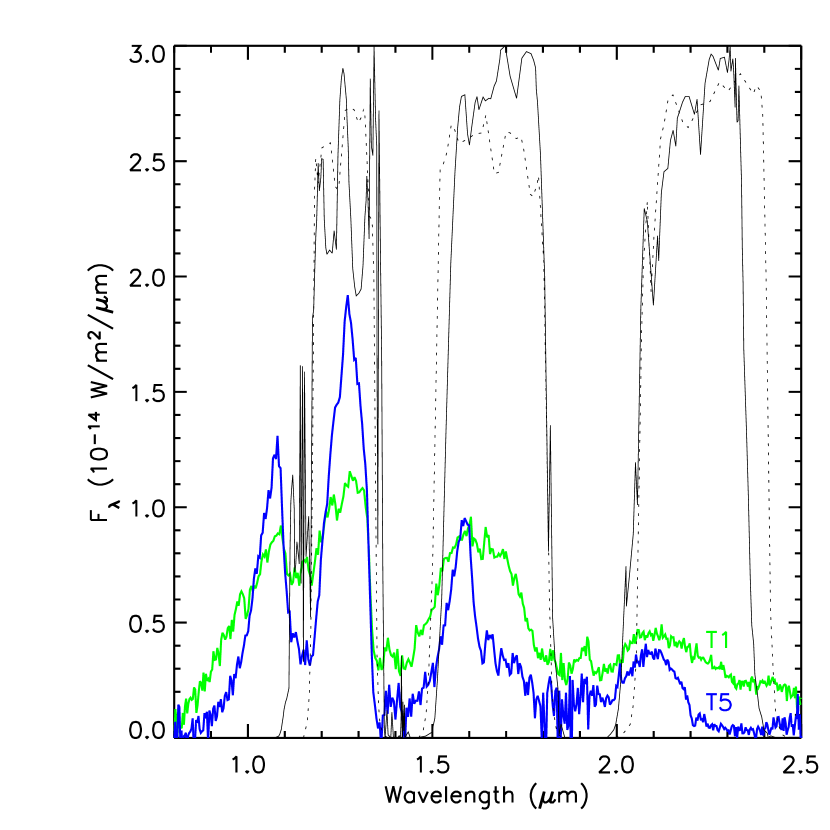
In Fig. 7, we plot SDSS 2052 and 2MASS 2331 scaled with the relative photometry of the A and B components of 2MASS 1404AB, with the 2MASS and MKO filter transmission profiles overlaid. The 2MASS -band filter profile extends to slightly shorter wavelengths, covering more of the CH4 absorption band at 1.15 m, than does the MKO -band profile. This explains the reduced relative 2MASS -band photometry of the two components compared to the relative MKO -band photometry, since the secondary (T5) has larger CH4 absorption than does the primary (T1). The flux peaks, however, are more illuminating than the broadband photometry. The peak at 1.25 m of the scaled T5 is 70% brighter than that of the scaled T1, and the 1.05 m peak (outside the -band filter profile) is 40% brighter. This redistribution of flux into the 1.05 and 1.25 m peaks is remarkably similar to that seen for SDSS 1021AB and SDSS 1534AB. SDSS 1021B is 30% and 25% brighter at the 1.25 and 1.05 m bands than SDSS 1021A, respectively. Likewise, SDSS 1534B is 30% and 20% brighter at the 1.25 and 1.05 m bands than SDSS 1534A. While no atmospheric models can accurately reproduce this flux redistribution, we refer the reader to Burgasser et al. (2006b) for a qualitative description of how this brightening may arise.
3.3. Construction of Color-Magnitude Diagrams
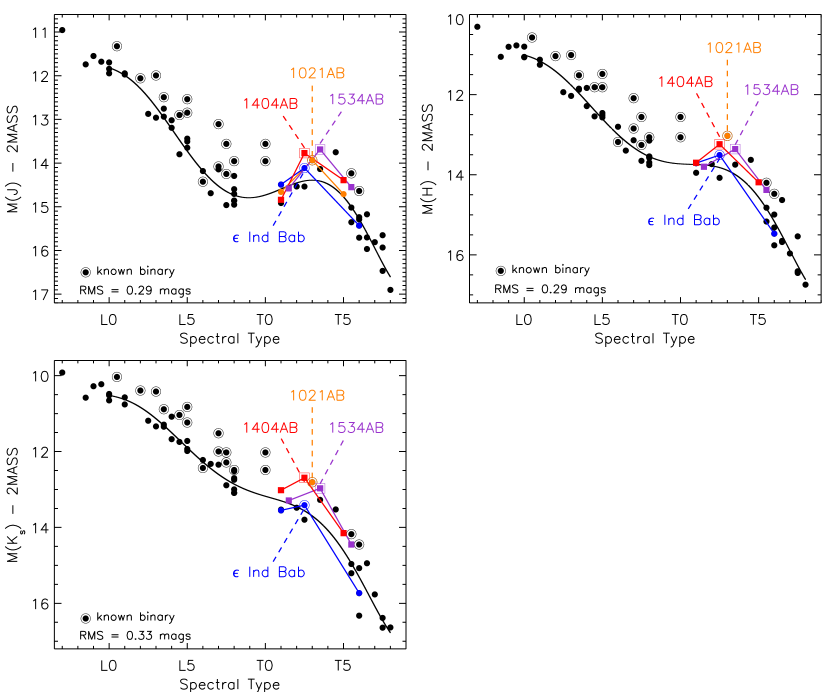
Using the new M-SpT relations derived in 3.1, we estimate distances for component A, assuming a T1 spectral type, of 25.8, 22.6, and 20.2 pc, respectively, yielding a mean distance of 23 pc. We can now place 2MASS 1404AB and its components on a color-magnitude diagram (see Fig. 4). Likewise, SDSS 1021AB and SDSS 1534AB are also shown, and these have been converted onto the 2MASS photometric system using the spectral type estimates of their components, their component MKO photometry, and the appropriate transformations from Stephens & Leggett (2004). The parallax measurement for SDSS 1021AB (Tinney et al., 2003) is used to place it on the diagram. Since SDSS 1534AB lacks a parallax measurement, we use the M-SpT relations for component SDSS 1534A (d 41 pc) to place SDSS 1534AB on the diagram.
Of note, only two other T dwarfs in the -band bump, SDSS J175032.96+175903.9 (T3.5; hereafter SDSS 1750) and 2MASS J055919141404488 (T4.5; hereafter 2MASS 0559), lie above the -band fit, by 0.3 and 0.9 mag, respectively. Neither object has been resolved in high-angular resolution studies (Burgasser et al., 2006b, 2003a), nor show any signs of unusual metallicity or gravity effects in their spectra. These objects could still be binaries with very small separations and/or imaged at an unpropitious place in their orbits, as was originally the case with Kelu-1 (Liu & Leggett, 2005; Gelino et al., 2006). However, Zapatero Osorio et al. (2007) have monitored 2MASS 0559 over a period of 4.37 years with radial velocity measurements and have ruled out companions more massive than 10 MJup in orbits of 1 yr and companions more massive than 2 MJup in orbits of less than a few days.
In order to eliminate the -band bump, SDSS 1750 would have to be an unresolved binary, 2MASS 0559 would have to be an unresolved triple (since 0.75 mags) with the above restrictions on the orbital periods of its components, and 2MASS 1404AB would also have to be a triple system instead of a binary. The small observed frequency of brown dwarf triple systems (3% – not considering selection effects; Burgasser et al. 2007) suggests this is highly unlikely. Hence, the amplitude of the -band bump is probably at least 0.5 mag as illustrated by the components of 2MASS 1404AB and likely as high as 1 mag in light of the recent null result of radial velocity companions to 2MASS 0559 by Zapatero Osorio et al. (2007). A parallax measurement and resolved spectroscopy of this system are needed to accurately place the components on a color magnitude diagram. Radial velocity monitoring of the 2MASS 1404AB system can resolve if this brightening is intrinsic to the atmospheres as they cool or if higher-order multiplicity is responsible for this peculiar flux reversal at 1–1.2 m.
3.4. Physical Parameters of 2MASS 1404AB
To estimate the physical parameters of 2MASS 1404AB (see Table 2), we first rederived MKO -band bolometric corrections (BCK) versus spectral type and Teff versus spectral type relations, using M9–T8 data from Golimowski et al. (2004) and references there-in, excluding known binaries. In both relations, we classify L dwarfs on the Kirkpatrick et al. (1999) optical classification scheme, and T dwarfs on the Burgasser et al. (2006a) NIR classification scheme. Our choice of optical L dwarf spectral classification for these fits is further strengthened because the far-optical spectrum of mid-to late-type L dwarfs is less influenced by cloud opacities than the Geballe et al. (2002) 1.5 m H2O index (Knapp et al., 2004). The coefficients to the fourth-degree weighted BCK polynomial fit and to the sixth-degree unweighted Teff polynomial fit are given in Table 3 and shown graphically in Fig. 8. The rms in this fit (87 K) compared to that of Golimowski et al. (2004) (124 K) is less because of the elimination of objects found to be binary between the time of that publication and this paper. Using the Teff-SpT relation, we estimate effective temperatures of 1390 90 K and 1180 90 K for the primary and secondary, respectively, assuming an age of 3 Gyr. We also find BCK values of 2.91 0.16 and 2.34 0.16 for the primary and secondary, respectively. In both cases, the error is the RMS in the fit and does not include the error in spectral typing.
To determine Mbol for each component, we used the BCK corrections, a distance estimate of d23 pc, and the MKO component photometry (see Table 5). This yielded Mbol = 15.96 0.19 mag and 16.59 0.25 mag for the primary and secondary, respectively. The ratio of bolometric luminosities, Lbol,A/Lbol,B, is 1.79 0.52, with the primary having the higher luminosity. We use the mass-luminosity relation Lbol M2.64 (Burrows et al., 2001), which assumes solar metallicities, and the ratio of bolometric luminosities to find the mass-ratio: q MB/MA = 0.80 0.09. This mass ratio is typical for known brown dwarf binaries, which tend to peak at q1 (73% of observed binaries have q 0.8, although, observational bias would favor high-q ratios; Burgasser et al. 2006b). Using the age-luminosity relation from Burrows et al. (2001), we find a total mass for the system of 50, 70, and 80 MJup, corresponding to ages of 0.5, 1.0, and 5.0 Gyr, typical for local disk dwarfs (Reid & Hawley, 2000). This corresponds to individual masses of 28 and 22 MJup, 39 and 31 MJup, and 44 and 36 MJup for these respective ages.
Finally, this allows determination of the orbital parameters of this system. At an estimated distance of 23 pc and with an apparent separation of 0134, the projected physical separation is 3.1 AU. Statistically, the true semi-major axis can then be estimated as a = 1.26 3.9 AU (Fischer & Marcy, 1992). This implies an orbital period of roughly 2835 yr, assuming a total system mass of 5080 MJup.
4. Conclusions
We have presented high resolution imaging of two T2.5 dwarfs – 2MASS 1106 and 2MASS 1404 – and resolved the latter into a 013 binary. 2MASS 1404AB is an intriguing binary as its presumably cooler secondary is brighter in -band than the primary by 2MASS = 0.45 mags but fainter in both 2MASS - (by 0.49 mags) and 2MASS -bands (by 1.13 mags). This secondary brightening in -band is much more pronounced than that seen in the other two known flux reversal binaries with resolved -band photometry – SDSS 1021 (2MASS = 0.05, MKO = 0.04) and SDSS 1534 (2MASS = 0.03, MKO = 0.17). Zapatero Osorio et al. (2007) have found no companions in their radial velocity monitoring of the T4.5 dwarf 2MASS 0559, which lies 0.9 mag above the 2MASS MJ versus spectral type relation we derive. This result in conjunction with ours suggest that a brightening of at least 0.5 mag and likely as high as 1 mag in the -band bump is real and intrinsic to the atmospheres of these objects as they cool across early-to mid-type T classes.
5. Acknowledgments
We thank our anonymous referee for comments which improved this manuscript. We would like to thank our telescope operators on Keck: Jim Lyke, Cynthia Wilburn, Chuck Sorenson, and the rest of the Keck LGS AO team and our telescope operator on Magellan: Mauricio Martinez. We thank Michael Liu for the LGS AO data on these two sources, and Michael Cushing and Mark Pitts for helpful discussions. D.L.L. thanks Michael Liu and John Rayner for advising her for this project, and David Sanders for financial support. This research has made use of the SIMBAD database, operated at CDS, Strasbourg, France. This research has benefitted from the M, L, and T dwarf compendium housed at DwarfArchives.org and has used data products from the SpeX Prism Spectral Libraries (http://www.browndwarfs.org/spexprism). This publication also makes use of data products from the Two Micron All Sky Survey (2MASS), which is a joint project of the University of Massachusetts and the Infrared Processing and Analysis Center/California Institute of Technology, funded by the National Aeronautics and Space Administration and the National Science Foundation. This research has also made use of the NASA/IPAC Infrared Science Archive (IRSA), which is operated by the Jet Propulsion Laboratory, California Institute of Technology, under contract with the National Aeronautics and Space Administration. As all data were obtained from the summit of Mauna Kea, the authors wish to recognize and acknowledge the very significant cultural role and reverence that this mountaintop has always had within the indigenous Hawaiian community. We are most fortunate to have the opportunity to conduct observations on the summit.
Facilities Used: Keck:II, Magellan:Clay.
References
- Ackerman & Marley (2001) Ackerman, A. S., & Marley, M. S. 2001, ApJ, 556, 872
- Allington-Smith et al. (1994) Allington-Smith, J., et al. 1994, PASP, 106, 983
- Burgasser et al. (2008) Burgasser, A. J., Liu, M. C., Ireland, M. J., Cruz, K. L., & Dupuy, T. J. 2008, ArXiv e-prints, 803, arXiv:0803.0295
- Burgasser (2007) Burgasser, A. J. 2007, ApJ, 659, 655
- Burgasser et al. (2007) Burgasser, A. J., Reid, I. N., Siegler, N., Close, L., Allen, P., Lowrance, P., & Gizis, J. 2007, Protostars and Planets V, 427
- Burgasser et al. (2006c) Burgasser, A. J., Burrows, A., & Kirkpatrick, J. D. 2006c, ApJ, 639, 1095
- Burgasser et al. (2006b) Burgasser, A. J., Kirkpatrick, J. D., Cruz, K. L., Reid, I. N., Leggett, S. K., Liebert, J., Burrows, A., & Brown, M. E. 2006b, ApJS, 166, 585
- Burgasser et al. (2006a) Burgasser, A. J., Geballe, T. R., Leggett, S. K., Kirkpatrick, J. D., & Golimowski, D. A. 2006a, ApJ, 637, 1067
- Burgasser et al. (2004) Burgasser, A. J., McElwain, M. W., Kirkpatrick, J. D., Cruz, K. L., Tinney, C. G., & Reid, I. N. 2004, AJ, 127, 2856
- Burgasser et al. (2003b) Burgasser, A. J., Kirkpatrick, J. D., Liebert, J., & Burrows, A. 2003b, ApJ, 594, 510
- Burgasser et al. (2003a) Burgasser, A. J., Kirkpatrick, J. D., Reid, I. N., Brown, M. E., Miskey, C. L., & Gizis, J. E. 2003a, ApJ, 586, 512
- Burgasser et al. (2002) Burgasser, A. J., Marley, M. S., Ackerman, A. S., Saumon, D., Lodders, K., Dahn, C. C., Harris, H. C., & Kirkpatrick, J. D. 2002, ApJ, 571, L151
- Burrows et al. (2006) Burrows, A., Sudarsky, D., & Hubeny, I. 2006, ApJ, 640, 1063
- Burrows et al. (2001) Burrows, A., Hubbard, W. B., Lunine, J. I., & Liebert, J. 2001, Reviews of Modern Physics, 73, 719
- Chiu et al. (2006) Chiu, K., Fan, X., Leggett, S. K., Golimowski, D. A., Zheng, W., Geballe, T. R., Schneider, D. P., & Brinkmann, J. 2006, AJ, 131, 2722
- Cruz et al. (2004) Cruz, K. L., Burgasser, A. J., Reid, I. N., & Liebert, J. 2004, ApJ, 604, L61
- Dahn et al. (2002) Dahn, C. C., et al. 2002, AJ, 124, 1170
- Fischer & Marcy (1992) Fischer, D. A., & Marcy, G. W. 1992, ApJ, 396, 178
- Geballe et al. (2002) Geballe, T. R., et al. 2002, ApJ, 564, 466
- Gelino et al. (2006) Gelino, C. R., Kulkarni, S. R., & Stephens, D. C. 2006, PASP, 118, 611
- Gizis et al. (2003) Gizis, J. E., Reid, I. N., Knapp, G. R., Liebert, J., Kirkpatrick, J. D., Koerner, D. W., & Burgasser, A. J. 2003, AJ, 125, 3302
- Golimowski et al. (2004) Golimowski, D. A., et al. 2004, AJ, 128, 1733
- Hamuy et al. (1994) Hamuy, M., Suntzeff, N. B., Heathcote, S. R., Walker, A. R., Gigoux, P., & Phillips, M. M. 1994, PASP, 106, 566
- Kirkpatrick (2005) Kirkpatrick, J. D. 2005, ARA&A, 43, 195
- Kirkpatrick et al. (1999) Kirkpatrick, J. D., et al. 1999, ApJ, 519, 802
- Knapp et al. (2004) Knapp, G. R., et al. 2004, AJ, 127, 3553
- Liebert & Burgasser (2007) Liebert, J., & Burgasser, A. J. 2007, ApJ, 655, 522
- Liu et al. (2006) Liu, M. L., Leggett, S. K., Golimowski, D. A., Chiu, K., Fan, X., Gellae, T. R., Schneider, D. P., & Brinkmann, J. 2006, ApJ, 647, 1393
- Liu & Leggett (2005) Liu, M. C., & Leggett, S. K. 2005, ApJ, 634, 616
- Looper et al. (2007) Looper, D. L., Kirkpatrick, J. D., & Burgasser, A. J. 2007, AJ, 134, 1162
- Monet et al. (2003) Monet, D. G., et al. 2003, AJ, 125, 984
- Zapatero Osorio et al. (2007) Osorio, M. R. Z., Martín, E. L., Béjar, V. J. S., Bouy, H., Deshpande, R., & Wainscoat, R. J. 2007, ApJ, 666, 1205
- Perryman et al. (1997) Perryman, M. A. C., et al. 1997, A&A, 323, L49
- Reid et al. (2006) Reid, I. N., Lewitus, E., Burgasser, A. J., & Cruz, K. L. 2006, ApJ, 639, 1114
- Reid & Hawley (2000) Reid, N., & Hawley, S. L. 2000, New light on dark stars : red dwarfs, low mass stars, brown dwarfs / Neill Reid and Suzanne L. Hawley. New York : Springer, 2000. (Springer-Praxis series in astronomy and astrophysics)
- Siegler et al. (2007) Siegler, N., Close, L. M., Burgasser, A. J., Cruz, K. L., Marois, C., Macintosh, B., & Barman, T. 2007, AJ, 133, 2320
- Skrutskie et al. (2006) Skrutskie, M. F., et al. 2006, AJ, 131, 1163
- Stephens & Leggett (2004) Stephens, D. C., & Leggett, S. K. 2004, PASP, 116, 9
- Tinney et al. (2003) Tinney, C. G., Burgasser, A. J., & Kirkpatrick, J. D. 2003, AJ, 126, 975
- Tokunaga et al. (2002) Tokunaga, A. T., Simons, D. A., & Vacca, W. D. 2002, PASP, 114, 180
- van Altena et al. (1995) van Altena, W. F., Lee, J. T., & Hoffleit, D. 1995, VizieR Online Data Catalog, 1174, 0
- van Dam et al. (2006) van Dam, M. A., et al. 2006, PASP, 118, 310
- Vrba et al. (2004) Vrba, F. J., et al. 2004, AJ, 127, 2948
- Wizinowich et al. (2006) Wizinowich, P. L., et al. 2006, Proc. SPIE, 6272, 7

| Designation | bbRelative 2MASS photometry calculated in this paper. | ccRelative MKO photometry from references. | SpT ABddNIR spectral types on Burgasser et al. (2006a) scheme. | SpT AddNIR spectral types on Burgasser et al. (2006a) scheme. | SpT BddNIR spectral types on Burgasser et al. (2006a) scheme. | RefeeReferences – (1) Burgasser et al. (2006b), (2) Liu et al. (2006), (3) this paper. | |
|---|---|---|---|---|---|---|---|
| SDSS 1021AB | 16.25 0.09 | 0.05 | 0.04 | T3 | T1 | T5 | 1 |
| SDSS 1534AB | 16.75 0.13 | 0.03 | 0.17 | T3.5 | T1.5 | T5.5 | 2 |
| 2MASS 1404AB | 15.56 0.09 | 0.45 | 0.53 | T2.5 | T1 | T5 | 3 |
| Property | Value |
|---|---|
| MKO (mags) | 15.41 0.07 |
| MKO (mags) | 15.02 0.08 |
| MKO (mags) | 14.55 0.10 |
| MKO (mags) | 0.53 0.16 |
| MKO (mags) | 0.48 0.11 |
| MKO (mags) | 1.20 0.21 |
| 2MASS (mags) | 15.58 0.07 |
| 2MASS (mags) | 14.96 0.08 |
| 2MASS (mags) | 14.54 0.10 |
| 2MASS (mags) | 0.45 0.15 |
| 2MASS (mags) | 0.49 0.13 |
| 2MASS (mags) | 1.13 0.22 |
| Composite Optical SpT | T0 |
| Composite NIR SpT | T2.5aaMeasurements are from Looper et al. (2007). |
| ( yr-1) | 0.35 0.03aaMeasurements are from Looper et al. (2007). |
| (deg) | 275.3 0.2aaMeasurements are from Looper et al. (2007). |
| (mas) | 133.6 0.6 |
| (deg) | 311.8 0.7 |
| log (LA/LB)bb = 100, where Mbol⊙ = +4.76. | 0.25 0.13 |
| q MB/MA | 0.80 0.09 |
| Mtot (MJup) for 0.5, 1.0 & 5.0 Gyr | 50, 70 & 80 |
| Est. distance (pc) | 23 |
| Est. projected separation (AU) | 3.1 |
| Est. actual separation (AU) | 3.9 |
| Orbital Period (yr) | 28 – 35 |
| R | c0 | c1 | c2 | c3 | c4 | c5 | c6 | RMS |
|---|---|---|---|---|---|---|---|---|
| MJbbPhotometry is on the 2MASS system. (mag) | 11.817 | 1.255e-1 | 3.690e-2 | 1.663e-2 | 3.915e-3 | 2.595e-4 | 5.462e-6 | 0.29 |
| MHbbPhotometry is on the 2MASS system. (mag) | 11.010 | 1.125e-1 | 3.032e-2 | 1.261e-2 | 2.970e-3 | 1.987e-4 | 4.218e-6 | 0.29 |
| MbbPhotometry is on the 2MASS system. (mag) | 10.521 | 7.369e-2 | 2.565e-2 | 1.299e-2 | 2.864e-3 | 1.911e-4 | 4.104e-6 | 0.33 |
| BCKc,dc,dfootnotemark: (mag) | 3.221 | 2.371e2 | 6.428e3 | 1.631e3 | 5.579e5 | 0.16 | ||
| TeffddData are from Golimowski et al. (2004) and references therein. (K) | 2319.920 | 108.094 | 1.950 | 3.101 | 6.414e1 | 4.255e2 | 9.084e4 | 87 |
| Quantity | L6 | L7 | L8 | L9 | T0 | T1 | T2 | AVG |
|---|---|---|---|---|---|---|---|---|
| 2MASS MKO | 0.03 0.01 | 0.02 | 0.02 0.01 | 0.01 0.01 | 0.01 | 0.01 0.02 | 0.03 0.02 | 0.01 0.04 |
| Number of ObjectsaaThe number of objects available per spectral type class, where a class also includes a half-subtype - i.e., L6.0 and L6.5. Note that the T2 spectral class only includes T2.0 objects and no T2.5 objects. | 4 | 1 | 2 | 2 | 1 | 7 | 8 | 25 |
| Property | 2MASS 1404A | 2MASS 1404B |
|---|---|---|
| MKO (mags) | 16.46 0.12 | 15.93 0.09 |
| MKO (mags) | 15.56 0.09 | 16.04 0.10 |
| MKO (mags) | 14.86 0.11 | 16.06 0.19 |
| 2MASS (mags) | 16.65 0.12 | 16.20 0.09 |
| 2MASS (mags) | 15.51 0.09 | 16.00 0.10 |
| 2MASS (mags) | 14.83 0.11 | 15.96 0.19 |
| MKO (mags) | 0.90 0.15 | 0.11 0.13 |
| MKO (mags) | 0.70 0.14 | 0.02 0.21 |
| MKO (mags) | 1.60 0.16 | 0.13 0.21 |
| 2MASS (mags) | 1.14 0.15 | 0.20 0.13 |
| 2MASS (mags) | 0.68 0.14 | 0.04 0.21 |
| 2MASS (mags) | 1.82 0.16 | 0.24 0.21 |
| Est. NIR SpTaaComponent NIR spectral types are derived in 3.2. | T1 1 | T5 1 |
| Est. Teff (K)bbBased on the Teff vs. SpT relation defined in Table 3, using the component spectral types listed and assuming an age of 3 Gyr. | 1390 90 | 1180 90 |
| Mbol (mags) | 15.96 0.19 | 16.59 0.25 |