e-mail: miguelsg@iac.es; amr@iac.es 22institutetext: Isaac Newton Group of Telescopes, Ap. de Correos 321, 38700 Sta. Cruz de la Palma, Spain
e-mail: msantander@ing.iac.es; rcorradi@ing.iac.es; mischa@ing.iac.es 33institutetext: Instituto de Astronomía, Universidad Nacional Autónoma de México, México, D. F., México
e-mail: morisset@astroscu.unam.mx 44institutetext: INAF Osservatorio Astronomico di Padova, via dell’Osservatorio 8, 36012 Asiago (VI), Italy
e-mail:munari@pd.astro.it 55institutetext: Department of Astronomy, University of Washington, Seattle, Washington 98195-1580, USA
e-mail: balick@astro.washington.edu 66institutetext: Space Telescope Science Institute (STScI), 3700 San Martin Drive, Baltimore, MD 21218, USA
e-mail: mlivio@stsci.edu
Hen 2–104: A close-up look at the Southern Crab††thanks: Based on observations with the NASA/ESA Hubble Space Telescope, obtained at the Space Telescope Science Institute, which is operated by the Association of Universities for Research in Astronomy, Inc. under NASA contract No. NAS5-26555; on observations obtained at the 4 m NTT and the 8 m VLT telescopes of the European Southern Observatory in Chile.
Abstract
Aims. The kinematics, shaping, density distribution, expansion distance, and ionized mass of the nebula Hen 2–104, and the nature of its symbiotic Mira are investigated.
Methods. A combination of multi-epoch HST images and VLT integral field high-resolution spectroscopy is used to study the nebular dynamics both along the line of sight and in the plane of the sky. These observations allow us to construct a 3-D spatio-kinematical model of the nebula, which together with the measurement of its apparent expansion in the plane of the sky over a period of 4 years, provides the expansion parallax for the nebula. The integral field data featuring the [Sii] 671.7,673.1 emission line doublet provide us with a density map of the inner lobes of the nebula, which together with the distance estimation allow us to estimate its ionized mass.
Results. We find densities ranging from ne=500 to 1000 cm-3 in the inner lobes and from 300 to 500cm-3 in the outer lobes. We determine an expansion parallax distance of 3.30.9 kpc to Hen 2–104, implying an unexpectedly large ionized mass for the nebula of the order of one tenth of a solar mass.
Key Words.:
symbiotic stars: Hen 2–104 – planetary nebulae – interstellar medium: kinematics and dynamics1 Introduction
Symbiotic stars are valuable laboratories for studying the physics of a variety of astrophysical processes, like mass transfer, accretion and outflow, thermonuclear runaways, photo-ionization and shock-ionization, and the physico-chemistry of gas and dust in complex environments containing both hot and cold stars.
The formation of the nebulae that surrounds some of them, especially those containing a Mira variable, is one example of these complex interactions, and the key to understand crucial aspects of the mass loss history and geometry from these systems. A small fraction of the Mira wind is believed to be accreted by the white dwarf companion (Kenyon & Webbink KW84 (1984)), resulting in quasi-stable thermonuclear burning at its surface (e.g. Sokoloski So02 (2002)) which sometimes ends in thermonuclear outbursts (e.g. Kenyon Ke86 (1986), Livio et al. Li89 (1989)) lasting for hundreds of years (e.g. Munari Mu97 (1997)). The fast winds from the white dwarf collide with the slower, non-accreted Mira wind, and shape complex circum-binary nebulae. Currently, about a dozen of these nebulae have been optically resolved (Corradi Co03 (2003)). Most of them show bipolar morphologies, similar to those of many planetary nebulae (PNe) and protoplanetary nebulae (PPNe) (Corradi & Schwarz Co95 (1995), Sahai Sa02 (2002)).
The distance of these system is generally poorly known, in spite of being a basic parameter to determine their overall physical properties, like their total luminosities, the mass of their ejecta or their kinematical ages. Recently, the advent of high spatial resolution instruments like the HST allows to face this problem by measuring the expansion parallax of some of these nebulae. The procedure is to measure the growth of the nebula in the plane of the sky via multi-epoch imaging, and combining this information with the expansion velocity, once the Doppler shifts have been measured and deprojected according to the adopted 3-D morphology. It has been applied to several relatively close PNe (NGC 6543, Reed et al. Re99 (1999); IC 2448, NGC 6578, NGC 6884, NGC 3242 and NGC 6891, Palen et al. Pa00 (2000)) and to one symbiotic nebula (Hen 2-147, Santander-García et al. 2007a ).
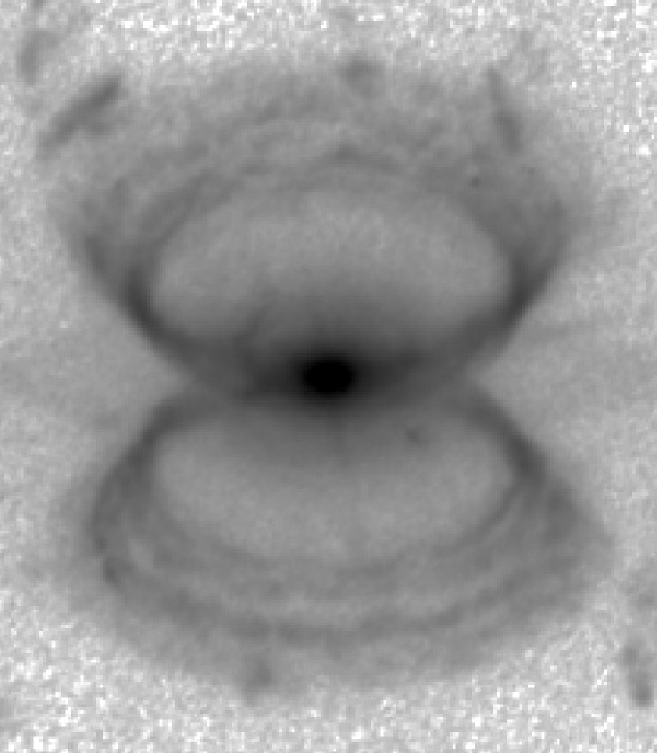
Named the Southern Crab after its resemblance to the legs and claws of that animal, the nebula around Hen 2–104 (also, PN G315.4+09.4, and V852 Cen) was discovered by Schwarz et al. (Sc89 (1989)). Although similar, in morphology and kinematics, to several bipolar planetary nebulae (Corradi & Schwarz 1993b ), the system has been unequivocally recognized as a genuine symbiotic star after Whitelock (Wh87 (1987)) detected a Mira in its core by means of long-term photometric monitoring. The dynamics of this magnificent nebula, which spans 70”35” in the plane of the sky, has been studied by Corradi & Schwarz (1993a ) and then analysed in great spatial and spectral detail by Corradi et al. (Co01 (2001)).
The distance to Hen 2–104 is very controversial. While Wright and Allen (Wr78 (1978)) found a distance of 7.92 kpc, Schwarz et al. (Sc89 (1989)) estimated 0.8 kpc. Whitelock (Wh87 (1987)) and then Corradi et al. (Co01 (2001)) used the Period–Luminosity relation for Mira stars to derive an intermediate distance of 4.7 kpc and 4.4 kpc, respectively.
In this paper, we present the results of the analysis of an NTT+SOFI NIR spectrum, integral-field high-resolution VLT spectra, as well as of an 2003 HST [Nii] image of the nebula which is compared to the one obtained on 1999. With these, we present the first spectroscopic detection of the Mira, the determination of the expansion parallax of the nebula, its density map, and an estimation of its ionized mass and total luminosity of the system.
2 Observations and Data reduction
2.1 Imaging
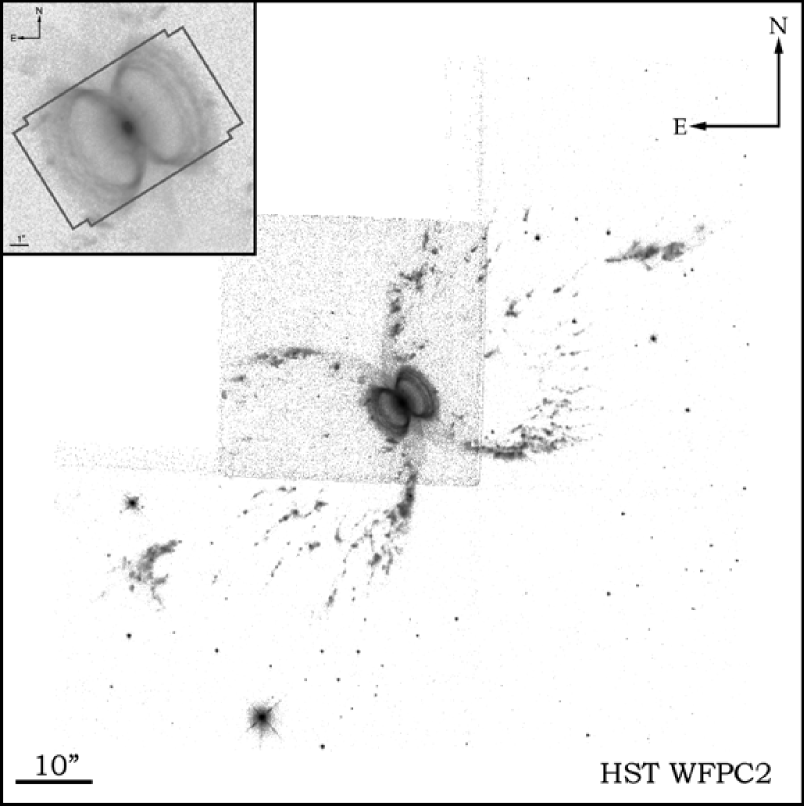
Two sets of [Nii] 658.3 nm images of Hen 2–104 were obtained using the Wide Field Planetary Camera 2 (WFPC2) on the Hubble Space Telescope (HST) on May 22, 1999 (programme GO7378) and May 10, 2003 (programme GO9336) respectively (see Fig. 1). Images from both epochs were obtained through the F658N filter (central wavelength/bandpass = 659.0/2.2 nm), which, assuming no significant degradation between epochs, transmits the [Nii] line with 78% efficiency and the H line with 1% efficiency at the heliocentric systemic velocity of Hen 2–104. An additional set of WFPC2 images was taken in May 20, 2001 (programme GO9050), in the F656N filter (central wavelength/bandpass = 656.4/2.2 nm). In this case, the transmission efficiency is 78% in H, 11% in [Nii] 654.8 and 6% in [Nii] 658.3.
We computed the observed total fluxes from the nebula in both H and [Nii] 658.3 nm following the procedure described by Luridiana et al. (Lu03 (2003)). After subtraction of the central unresolved core and decontamination from continuum and neighbour emission lines, the observed total fluxes from the nebula were estimated to be 3.6 10-12 in H and 2.1 10-12 erg cm-2 s-1 in [Nii] 658.3 nm. These are consistent with the values given by Shaw & Kaler (Sh89 (1989)) for a 10′′ diameter aperture centered on the star.
The HST images (one dataset per epoch) were obtained using a 4-point dithering pattern in order to properly sample the HST point spread function (PSF). They were then reduced using the “multidrizzle package” (Koekemoer et al. Ko02 (2002)), an automated dithered image combination and cleaning task in PyRAF (Python IRAF). This routine first creates a bad-pixel mask using calibration reference files, and performs the sky subtraction. Next, the software arranges the four WFPC2 CCDs into a mosaic, where geometric distortion effects are corrected, including time dependent distortions due to CCD rotations and flexure. Then it removes cosmic rays and creates, for each epoch, a combined and drizzled image with a sampling scale of 0′′.045 pix-1.
In order to extract the expansion on the sky of Hen 2–104 from these two images, they need to be brought to exactly the same astrometric grid. This is not the case due to slightly different roll angles and pointings, and possible residuals in the distortion correction done with multidrizzle for the two epochs. We used THELI111ftp.ing.iac.es/mischa/THELI/ (Erben et al. esd05 (1995)) to define an astrometric reference frame based on the stellar sources in the field. Given the small rotation and distortion corrections, the images were then resampled to the new grid, using the coordinates of the central star of Hen 2–104 as the reference projection point. The relative astrometric accuracy between the two images is on the order of 0.2 pixel.
2.2 Integral Field Spectroscopy
Integral Field Spectroscopy was obtained at Kueyen, Telescope Unit 2 of the 8 m VLT at ESO’s observatory on Paranal, on April 2, 2004. The inner lobes of the nebula were covered by the ARGUS IFU at PA=122∘ using the lowest spatial resolution (314 fibres each with a size of projected onto the sky, giving a total of 11′′.4 by 7′′.3 field of view). Two 300 s exposures were taken with the H679.7 grating, covering the region between 660 and 690 nm, and then co-added. The resolving power was R=30000, corresponding to a line FWHM of 10.5 km s-1. The seeing was 0′′.7. The VLT data were kindly reduced by Reinhard Hanuschik through the ESO pipeline, and then further analysed using standard IRAF routines.
2.3 Near-infrared spectroscopy
A 120 s near-IR spectrum of the core of Hen 2–104 was taken with SOFI at the ESO New Technology Telescope (NTT) on May 2, 2004, in the 0.95-2.5 m range, with a resolving power of =930 for a slit width of 0′′.6. The spectrum was reduced following standard IRAF procedures.
3 An improved spatio-kinematical modelling
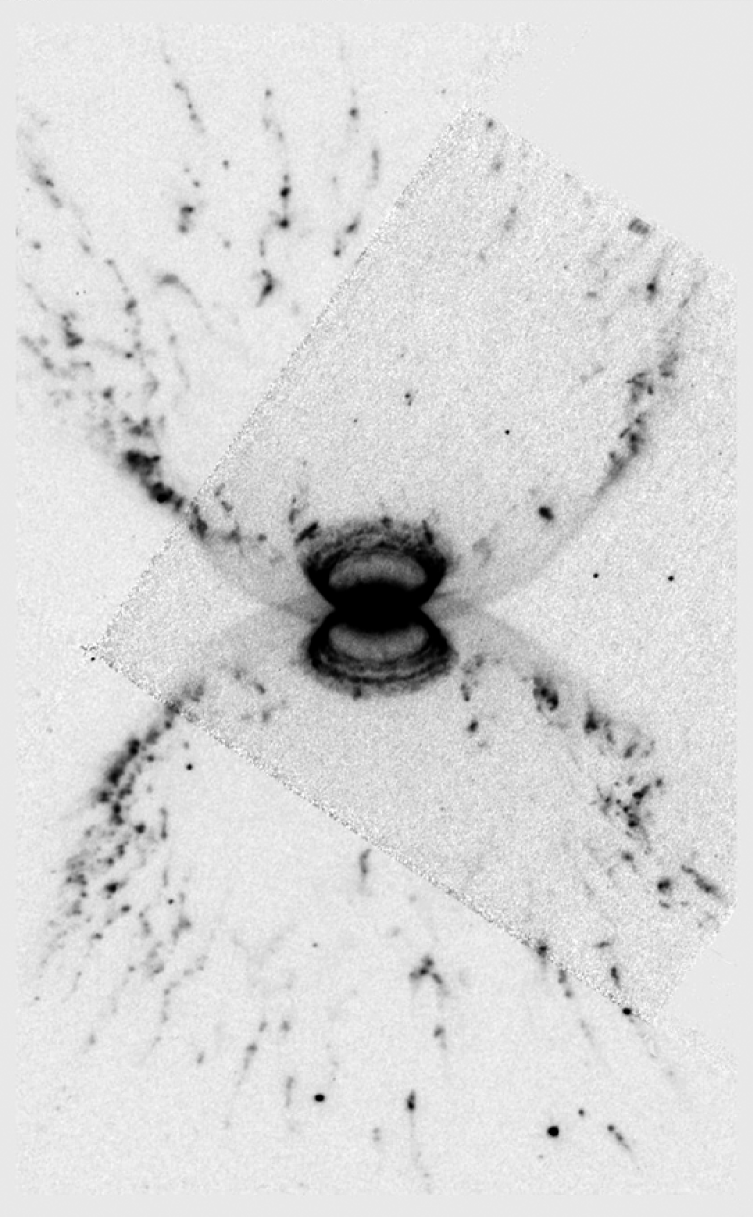
The image of the nebula surrounding Hen 2–104 is shown in Fig. 1. It consists of two pair of nested, emitting gas lobes. According to Corradi et al. (Co01 (2001)), the two pairs of lobes are likely coeval, and not the result of two similar consecutive outbursts (with the inner lobes being a younger version of the outer ones) since their expansion velocities are (dramatically) different, and their kinematical ages are very similar. Also the polar jets of the nebula are roughly coeval with the inner and outer lobes. The inner lobes show latitude dependent surface brightness variations, which produce the systems of ellipses observed in the HST images (Corradi et al. Co01 (2001)). The outer lobes, on the other hand, appear fragmented by Kelvin-Helmholtz instabilities into a myriad of clumpy and filamentary structures. Most of them, specially in the furthest regions, have outward facing tails (see Contini & Formiggini CoFo01 (2001); González, Raga & Steffen Go05 (2005)).
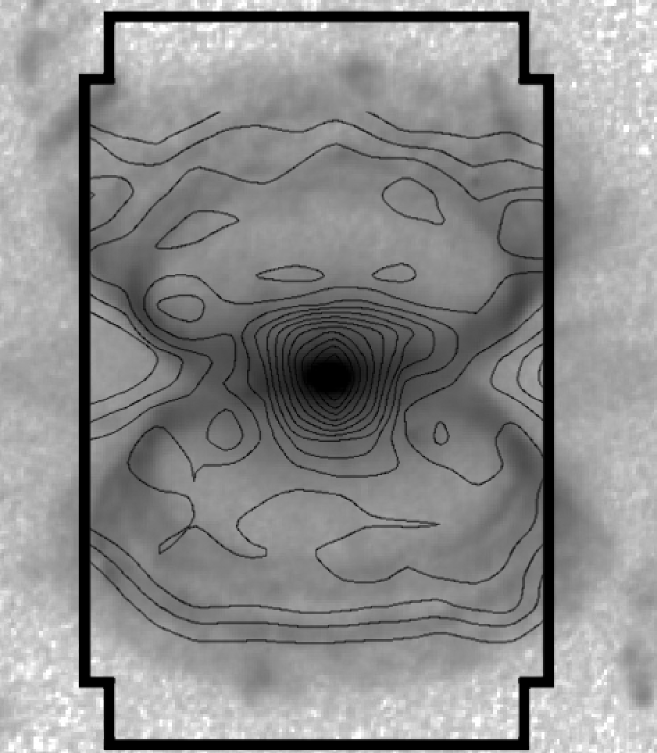
We used the VLT IFU to map the 2-D distribution and Doppler shifts of the emission from the core and the whole inner lobes. The core shows a bright Hei 667.8 emission line, which is also visible throughout the inner nebula. The [Sii] 671.7,673.1 emission lines present a high S/N ratio over the whole inner lobes, while are somewhat weaker in the portion of the outer lobes contained in the small field of view of the IFU. This, together with a wavelength dispersion large enough to separate the emission from the two system of lobes wherever their respective radial velocities differ in more than 40 km s-1, allows us to make a 3-D analysis of the two structures separately.
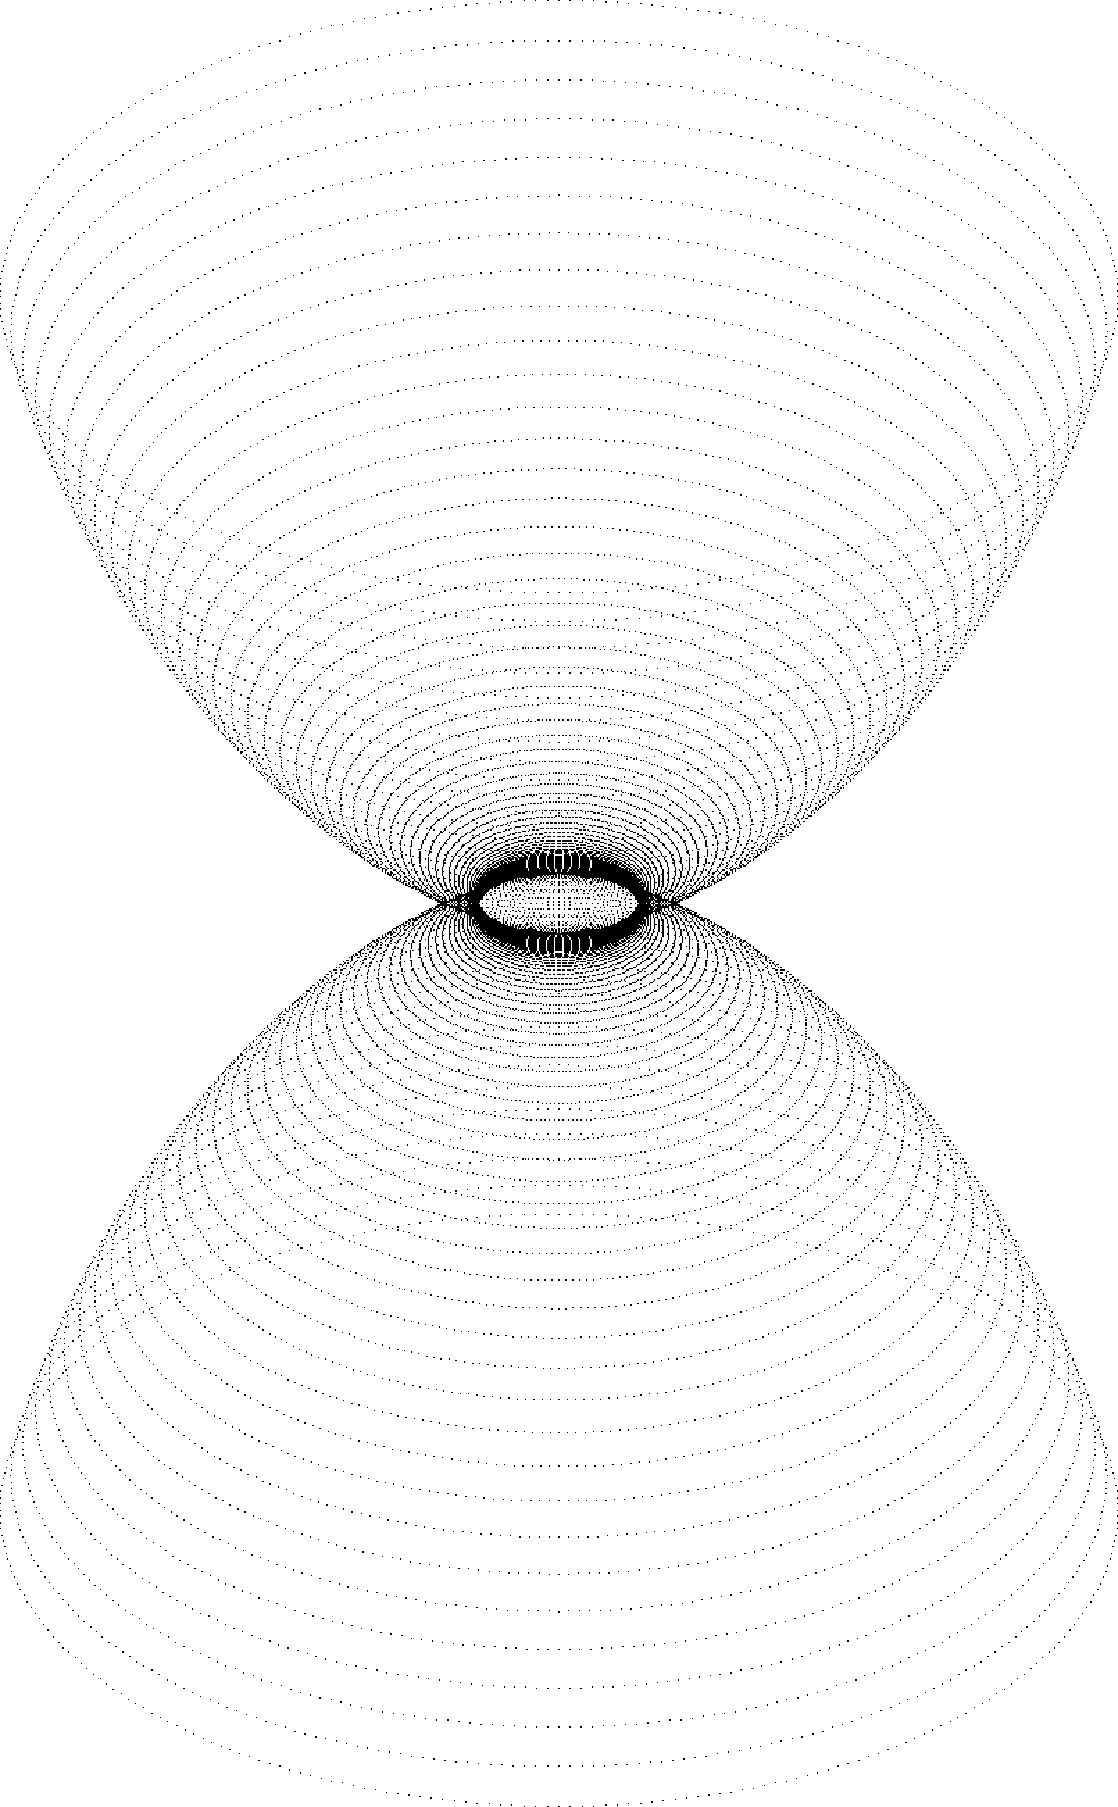
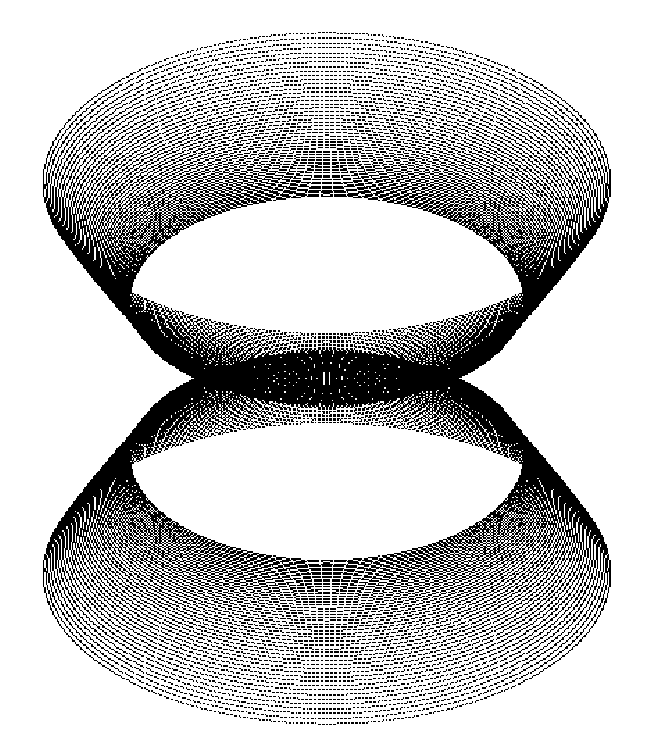
The IFU [Sii] 2214 fiber-array was rearranged in columns and rows to construct a grid of pseudo long-slit spectra, with length 11.′′4 and 7.′′28 respectively, and slit width 0.′′52. A spatio-kinematical model was then built and fit to the spectral data and to the shape of the inner lobes and base of the outer lobes in the [Nii] HST image (see Santander-García et al. Sa04 (2004) for a detailed description of the method). An analytical description assuming axial symmetry and using the formula in Solf & Ulrich (So85 (1985)) was adopted, with a surface, described in spherical coordinates by:
where is the apparent distance to the central source, the kinematical age of the outflow per unit of distance to the nebula, and the velocities of the model at the pole and equator respectively, the latitude angle of the model, and a dimensionless shaping factor. This assumes that each gas particle travels in the radial direction from the central star with a velocity proportional to its distance to the central source. For the inner lobes, emission is also restricted to the latitudes that correspond to the observed system of ellipses. In both cases, the resulting two-dimensional model was scaled to fit the size of the object, rotated around the symmetry axis to produce a three dimensional figure, and inclined to the plane of the sky. The resulting geometrical shape and velocity field is used to generate simplified model images and velocity plots for direct comparison with the real image and spectra.
| Parameter | Value | Range |
|---|---|---|
| (yrs kpc-1) | 1300 | (1200-1400) |
| (km s-1) | 230 | (210-250) |
| (km s-1) | 12 | (8-15) |
| 3.2 | (2.8-3.8) | |
| (∘) | 52 | |
| i (∘) | 58 |
| Parameter | Value | Range |
|---|---|---|
| (yrs kpc-1) | 1100 | (900-1300) |
| (km s-1) | 90 | (210-250) |
| (km s-1) | 11.3 | (7-15) |
| 4.5 | (3.5-5.0) | |
| (∘) | 25 | |
| (∘) | 39 | |
| i (∘) | 58 |
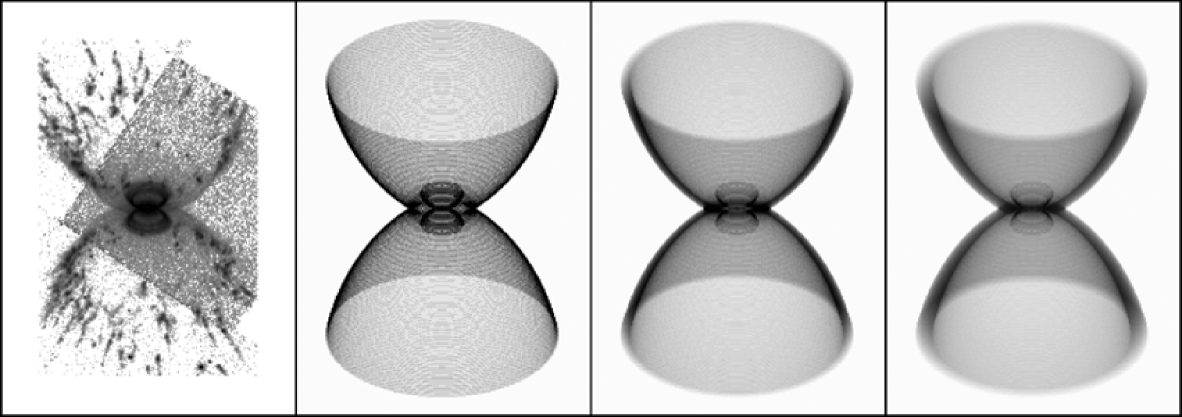
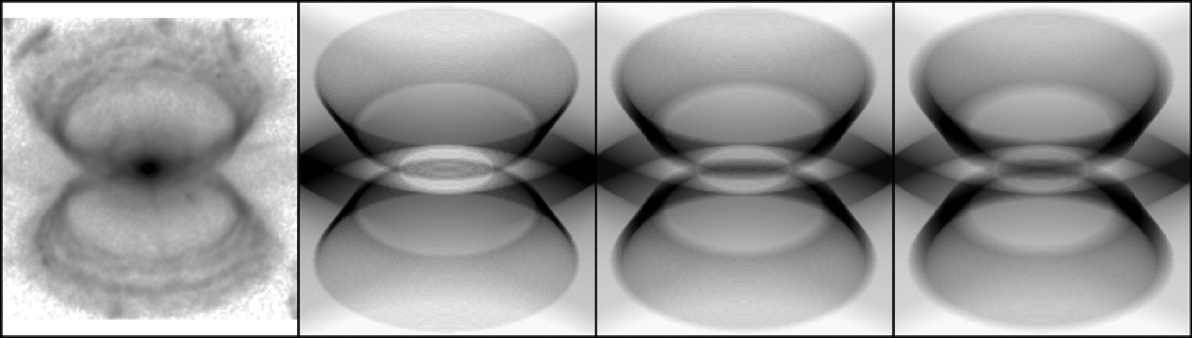
The fit to the data is performed by allowing the different parameters of the model to vary over a large range of values and visually comparing each resulting model to the image and spectra, until the optimal model is found. The results are shown in Figs. 3, 4, 5 and 6 and the corresponding parameters in Tables 1 and 2.
Almost all the emission from the inner lobes, both in the [Nii] image and the [Sii] spectra, was found to be faithfully accounted for by a series of rings inscribed on the walls of a truncated Solf & Ulrich (So85 (1985)) model at the highest latitudes, from 25∘ to 39∘, and expanding at a maximum velocity of 25 km s-1. The outer lobes, on the other hand, were found to share the symmetry axis of their smaller counterpart, 582∘ inclined with respect to the line of sight, and with a similar, within uncertainties, age of the nebula. We thus confirm the overall results by Corradi et al. (Co01 (2001)), while refining the value of the fitting parameters for the inner lobes thanks to the complete coverage of this region of the nebula by the ARGUS IFU. A systemic velocity vLSR = -85 km s-1 was derived, in agreement with the measurement of Corradi & Schwarz (1993a ).
4 The distance
The distance to the nebula of Hen 2–104 has been determined by means of its expansion parallax. This method calculates the distance by computing the apparent expansion in the plane of the sky between two images taken in two different epochs, and combining it with a 3-D model of the expansion pattern, in turn usually recovered from the analysis of the images and the radial velocity field.
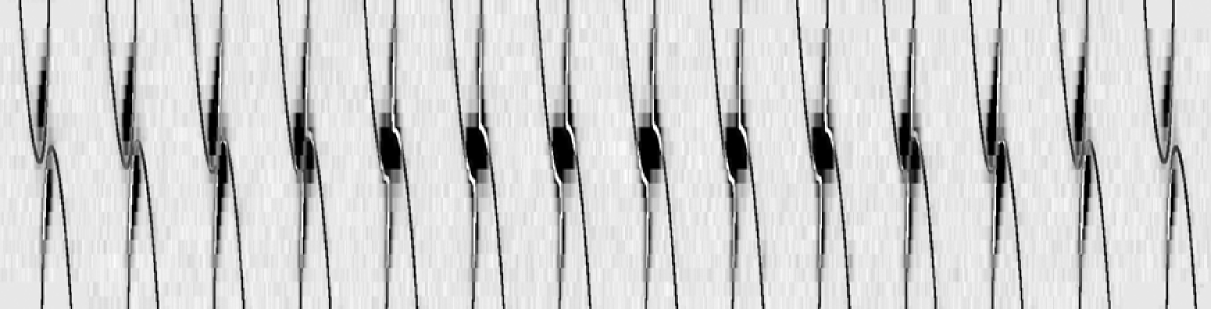
The apparent expansion of both the outer lobes and polar jets of Hen 2–104 is immediately visible by blinking the aligned 1999 and 2003 HST images. The amount of expansion of the outer lobes and jets was quantified in two different ways (Reed et al. Re99 (1999)): 1) deriving the growth of the whole outer lobes and jets with the so-called magnification method; and 2) working out the expansion of several individual knots via cross-correlation of the corresponding surface brightness radial profiles.
4.1 Expansion parallax via the magnification method
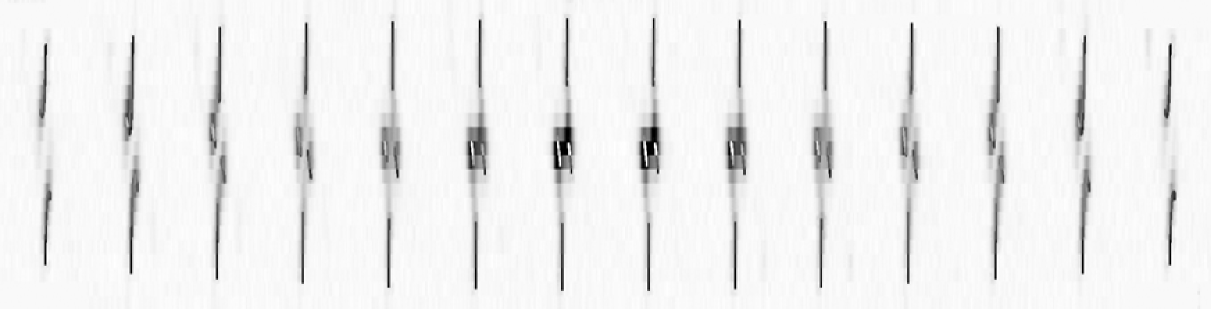
A residual image of the nebula was obtained by subtracting the 1999 image from the 2003 one, once the images have been registered and aligned with respect to the central core. A generalized pattern can be seen in the jets and edges of the outer lobes, with positive residuals on the outside and negative ones on the inside, indicating the expansion of the nebula in the period from 1999 to 2003.
In order to quantify the growth of the nebula, we determined the magnification factor, , to be applied to the 1999 image, which minimizes the rms of the residual image obtained by subtracting the magnified image from the 2003 image. In practice, though, the complex structure of the nebula, the evolution of the brightness and shape of individual knots and the small, non-radial components of movement of each knot (Rayleigh-Taylor instabilities, diffusion into the medium, etc.) complicate the analysis.
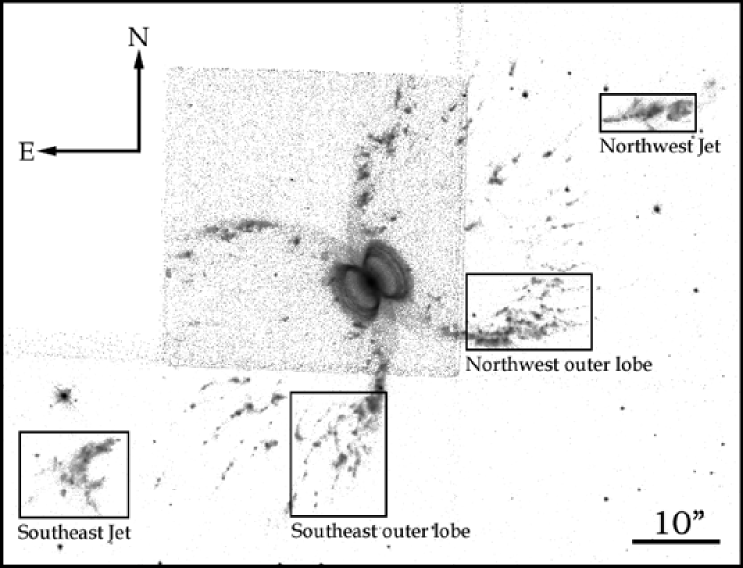
Each jet, as well as two well exposed regions of the outer lobes (see Fig.7), were independently analysed. The minimum rms of the residual images of the Northwest and Southeast jets were found to correspond to magnification factors equal to 1.0009 and 1.0010 respectively; both with an uncertainty of 0.0002. On the other hand, the factors which minimized the residual images of the Northwest and Southeast regions of the outer lobes were 1.0008 and 1.0012 respectively, while the uncertainty in these cases was 0.0003. Independent comparisons of the residual images by eye confirmed all these results. Thus, the growth of both the jets and outer lobes is uniform, within the errors, with average values of =1.000950.00020 and =1.001000.00030, respectively.
Given the magnification factor for the jets and outer lobes, and the kinematical age-distance parameter tD-1 (1300 yrs kpc-1 for the outer lobes, from Tab. 1, and 1200 yrs kpc-1 for the jets, Corradi et al. 1993a ), the expansion parallax can be determined by comparing the amount of growth of each feature in the lapse of time between 1999 and 2003, , with the features’ kinematical age. Hence:
We then found that the magnification method applied to the jets and outer lobes of Hen 2–104 gives consistent values of =3.50.7 kpc and =3.10.9 kpc, respectively.
4.2 Expansion parallax via radial profile method
While not providing a global, intuitive vision of the growth of the nebula and of deviations from pure radial expansion, the method that involves the study of radial profiles allows us to trace the radial expansion of individual features.
Essentially, this procedure consists of the analysis of one-dimensional surface brightness radial profiles passing through a given bright and sharp knot. Ideally, any profile from the 2003 image will be similar to the one from 1999, except that the feature will be shifted outwards. In order to measure the angular expansion of the feature in the plane of the sky, the 1999 and 2003 profiles are cross–correlated.

Fig. 8 shows the angular expansion (in milliarcseconds) of 45 well-defined knots chosen in the outer lobes and jets.
Assuming pure radial motion of the features, the distance to the nebula is computed by comparing the angular expansion of each knot to its velocity in the plane of the sky:
For each knot in the jets, its radial velocity from the major axis spectrum at P.A.=122∘ from Corradi et al. (Co01 (2001)), was coupled with the expansion in the plane of the sky derived from the cross-correlation of the radial profile. The inclination is assumed to be the same as for the inner and outer lobes (Sect. 3). For the outer lobes, the velocity in the plane of the sky is computed according to the spatio-kinematical model in Sect. 3.
After averaging the results for all the knots in the outer lobes, we obtained = 3.11.0 kpc, whereas = 3.41.0 kpc for the knots in the jets.
The distance found through radial fitting is therefore fully consistent with the one found through the magnification method; in the following, we will adopt an average distance of = 3.30.9 kpc. Note the considerable size of the nebula at this distance, amounting to 2.0 pc, and the large kinematical ages of the inner and outer lobes, which would be 37001200, and 4200 1200 years, respectively.
5 The NIR spectrum
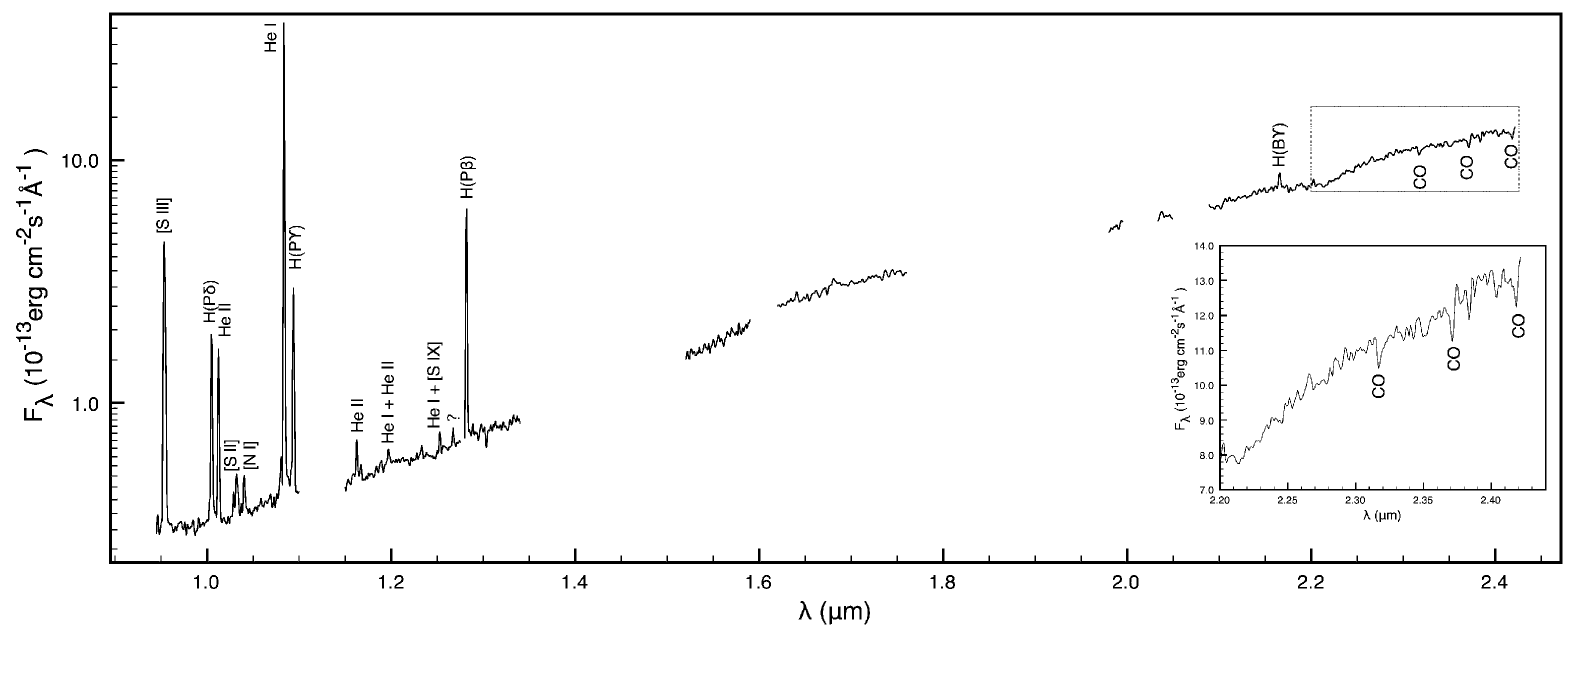
The NIR spectrum of the core (see Fig. 2) shows a variety of emission lines over an almost featureless rising continuum.
The region between 0.95 and 1.3 m shows Hydrogen and Helium atomic recombination lines, as well as [SII], [SIII], [NI], and H2. The region onward 2.1 m shows three CO absorption bands typical of late AGB stars (e.g. Kamath & Ashok Ka03 (2003)). These bands, although barely visible in the dominant continuum presumably produced by hot circumstellar dust, show for the first time some photospheric spectral features of the Mira in the system, so far only detected thanks to its characteristic NIR photometric light curve (Whitelock Wh87 (1987)).
The emission lines and absorption band CO identifications are shown in Table 3.
The featureless NIR continuum of Hen 2–104 is quite peculiar for symbiotic stars (cf. Whitelock Wh03 (2003)), where in general this part of the spectrum is dominated by deep absorption bands of the red giant. Note that Mz 3 and M 2-9, two nebulae suspected of having a symbiotic binary nucleus, show a similar spectrum. It is likely that the rising continuum is emission produced by a significant amount of hot circumstellar dust, but a detailed modelling of the spectrum is beyond the scope of these paper. What is instead relevant for the present discussion, is the fact that it is clear that the emission in the K-band is not always a good measure of the luminosity of the red giant of the system, so that distances computed from the Mira period-luminosity relationship using the K magnitude, are necessarily subject to large uncertainties.
| Element | Flux | error | |
| (Å) | (emission) | (10-13 | (%) |
| 9463.61 | He i 33S-53P0 | 2.11 | 14 |
| 9532.55 | [Siii] | 106.0 | 1 |
| 10027.73 | He i 33D-73F0 | 0.7 | 17 |
| 10049.37 | H(P) | 28.6 | 1 |
| 10123.61 | He ii 4-5 | 23.1 | 1 |
| 10286.5 | [Sii] | 1.32 | 10 |
| 10320.3 | [Sii] | 4.83 | 7 |
| 10370.5 | [Sii] | 0.44 | 20 |
| 10397.7+10398.2 | [Ni] | 3.62 | 7 |
| 10830.2 | He i | 640.0 | 1 |
| 10912.0 | He i | 1.85 | 18 |
| 10938.1 | H(P) | 44.9 | 1 |
| 11626.2 | He ii 5-7 | 3.85 | 10 |
| 11673.24 | He ii 6-11 | 1.17 | 31 |
| 11970.0 | He i+He ii | 2.19 | 36 |
| 12329.0 | H2(3,1)S(1) | 1.8 | 18 |
| 12528.0 | He i | 2.67 | 10 |
| 12673. | ? | 2.3 | 10 |
| 12785.0 | He i | 5.2 | 7 |
| 12818.08 | H(P) | 97.0 | 1 |
| 16407.19 | H(Br12) | 6.98 | 39 |
| 16806.52 | H(Br11) | 10.2 | 52 |
| 21655.29 | H(Br) | 28.9 | 15 |
| Molecule | Flux | error | |
| (m) | (absorption) | (10-13 | (%) |
| 2.32 | CO | 0.34 | 28 |
| 2.37 | CO | 0.35 | 46 |
| 2.42 | CO | 0.59 | 27 |
6 Nebular density and mass
6.1 Density map
The integral field spectroscopy data, featuring the [Sii] 671.7,673.1 emission line doublet, allow to build a density map covering the whole inner lobes and the base of the outer lobes (Fig.9). As mentioned previously, the large resolving power (R=30000) of the spectra was high enough to separate the inner lobes from the outer lobes wherever their respective radial velocities differed more than 40 km s-1.
In the absence of actual temperature measurements for the lobes, we assume =10000 K for both structures. The resulting densities range from =500 to 1000 cm-3 for the inner lobes, and from 300 to 500 cm-3 for the base of the outer lobes. The core shows the highest [Sii] densities, 2400 cm-3. However, the [Sii] lines seen towards the core probably arise in the outer layers of a very dense circumstellar envelope, as e.g. in the case of the other symbiotic Mira HM Sge (Corradi & Schwarz Co99 (1999)). Indeed, a core density larger than 2.5 106 cm-3 is estimated for Hen 2–104 from the [Oiii] lines (Freitas Pachecho & Costa Fr96 (1996)). At these densities, the [Sii] lines are collisionally quenched. These results confirm those given by Corradi & Schwarz (1993a ).
6.2 Ionized mass
The ionized mass of the nebula around Hen 2–104 can be estimated via the formula
where is the distance, the nebular electron density, F(H) is the total H flux, is the mass of the hydrogen atom, the energy of an H photon, and the effective recombination coefficient for case B (adopted from Osterbrock Os89 (1989)). After correcting the observed H flux for an extinction of Av=3.0 mag (average of the values found by Lutz et al. Lu89 (1989) and Freitas Pacheco & Costa Fr96 (1996)), and applying the theoretical H to H ratio of 2.85 (for an electron temperature of 10000 K), we obtain F(H)=1.3 10-11 erg cm2 s-1. Assuming an average density of 500 cm-3 and the distance found in this work, we compute an ionized mass of 0.16 M⊙. The extinction correction is very important in the above calculation, and, if we instead assume an interstellar extinction of 1.6 mag, as derived from the Galactic extinction model by Drimmel, Cabrera-Lavers & López-Corredoira (Dr03 (2003)) for the location of Hen 2–104 and the computed distance, the resulting ionized mass is 0.05 M⊙. These have to be considered as lower limits, as they neglect any local extinction due to dust around and inside the nebula.
A different mass estimate can be obtained by computing, both for the inner and outer lobes, the volume of each feature occupied by gas in the following manner. As the geometry of the surface of the lobes is known from our spatio-kinematical modelling (Sect. 3), and the electron density distribution is also known from the [Sii] line ratio, the only other parameter needed to compute the volume occupied by the emitting gas is the thickness of the walls of the lobes, if the filling factor (cf. Pottasch Pobook (1984)) is assumed to be around unity. 3-D models with different thickness have been produced using IDL (RSI) routines adapted from the VISNEB tools developed for the Cloudy 3D code (Morisset Mo06 (2006)). A cubic grid of 3003 cells was used to generate and rotate a 3D emissivity model (with the emissivity per unit volume ). The emission along the line of sight was then integrated in order to generate a synthetic image in collisionally excited lines (this also assumes that the ionic abundance and electron temperature are constant throughout the lobes). This procedure was repeated several times allowing the thickness of the 3D model to vary over a wide range.
In order to find the optimal thickness that accounts for the observed inner and outer lobes, residual images were obtained by subtracting each synthetic image from the real HST one. The regions around the edges of each lobe (i.e. where the walls of the structure are perpendicular to the plane of the sky and therefore its thickness is easier to estimate) were analysed in the residual images, both by visual comparison and by measuring the rms of each region. Illustrative samples of these synthetic images, both for the outer and inner lobes, are shown in Figs.10 and 11. The resulting best-fit thickness is 0′′.90′′.4 and 3′′.40′′.5 for the inner and outer lobes respectively. Finally, in order to account for the knotty appearance of the outer lobes, we computed the fraction of the total volume of the model occupied by gas. The procedure to do this was to count the number of pixels in the HST images whose surface brightness is larger than 3 times the statistical noise of the background, and compute which fraction of the area projected in the sky of the model nebula is effectively filled. The result was that 0.340.06 of the total volume of the outer lobes is filled by gas.
Therefore, using typical densities of ne=600 cm-3 and ne=350 cm-3 for the inner and outer lobes, respectively, and assuming a roughly solar abundance for the nebula, the resulting ionized mass for the two pairs of lobes is (4.60.9) 10-3 and 0.080.01 M⊙, respectively, for a total of roughly 0.1 M⊙ for the whole nebula. This value is midway, but broadly consistent, with the two previous estimates, 0.16 and 0.05 M⊙ obtained varying the adopted extinction, and is clearly pointing to a relatively large mass for the nebula.
7 Discussion
Schwarz et al (Sc89 (1989)) discovered the extended nebula around Hen 2–104, and they would probably have classified it as a planetary nebula, had Whitelock (Wh87 (1987)) not found, two years before, a long-period pulsation of the central star by means of NIR photometric monitoring. In fact, apart from indirect hints suggesting a symbiotic nature (e.g. a high density core, NIR colours unusual for a PN, and an articulated high-excitation spectrum), this was the only evidence for the presence of a cool giant. The NIR spectrum presented in Sect. 5 shows for the first time the spectral signature of the red giant in the spectrum. However, a strong featureless continuum, presumably from hot circumstellar dust, renders these bands barely visible. Thus, given the difficulties of direct detection of the Mira in some genuine symbiotic nebulae such as Hen 2–104, the already long debate on the nature of some bipolar nebulae with dust dominated NIR spectra and high density compact cores (e.g. Mz 3 and M2-9, see Schmeja & Kimeswenger Sc03 (2003), Phillips Ph07 (2007) and Santander-García & Corradi 2007b ) is not a surprise.
In this work, we derive a distance for Hen 2–104 of 3.30.9 kpc by means of the expansion parallax method. It is known that the expansion parallax determinations can be affected by shocks. This is for example the case of the symbiotic Mira Hen 2–147, in which Santander-García et al. (2007a ) found that distance is understimated if shocks are not properly taken into account. The main evidence for shocks in that nebula are the broad and asymmetrical line profiles, amounting to up 200 km s-1 full width at zero intensity (cf. Hartigan et al. Ha87 (1987)). This is not the case for Hen 2–104, where line widths in the jets and lobes are of the order of 15 km s-1, only slightly larger than the gas thermal broadening. We therefore conclude that shocks do not strongly affect the expansion parallax determination of Hen 2-104, as also suggested by the consistent distance estimate for the lobes and the jets (shocks would a priori act differently on the two components)222Note, however, that even if the actual distance were somewhat larger, the conclusions below would still hold, as the ionized mass would increase accordingly.. We consider our expansion parallax determination to be more robust than the distance obtained through the period-luminosity relationship for the Mira (Whitelock Wh87 (1987)), because our spectra show that the K band magnitude does not provide a reliable measure of the luminosity of the Mira.
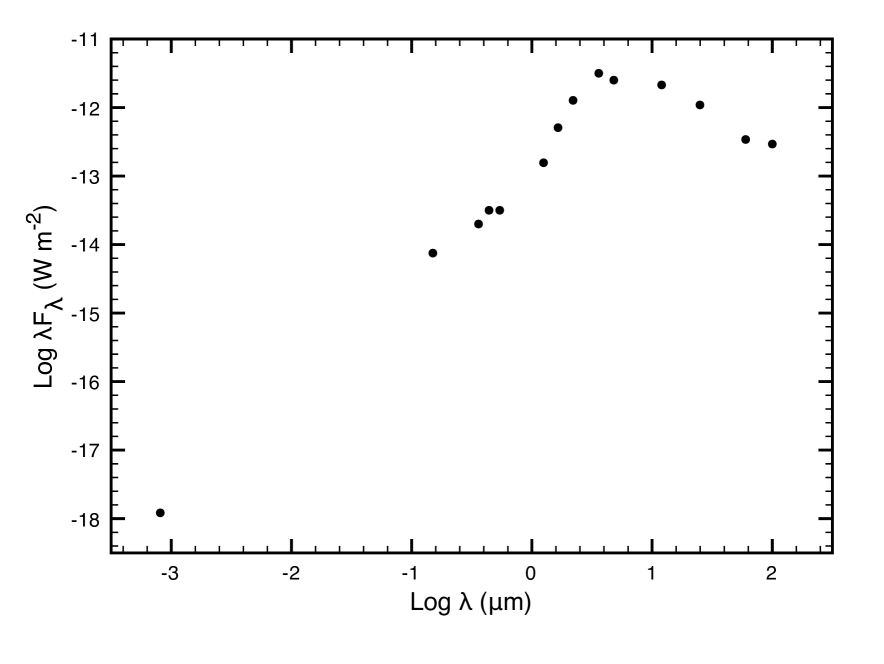
Application of period-luminosity relation (Feast et al. Fe89 (1989), Groenewegen & Whitelock Gr96 (1996), and Whitelock et al. Wh94 (1994)) to the Mira of Hen 2–104 (P=400 days, Whitelock Wh87 (1987)), would imply a bolometric luminosity of the AGB star of 6000 L⊙. This can be compared with the total luminosity of the system derived from the spectral energy distribution presented in (Fig. 12), at the computed distance of 3.3 kpc. From the latter, in order to obtain a luminosity larger than 6000 L⊙ (the luminosity of the white dwarf companion should also be considered), the interstellar extinction must be 2.9 mag. This value is significantly larger than the one obtained using the Galactic model by Drimmel, Cabrera-Lavers & López-Corredoira (Dr03 (2003), see Sect. 6.2), and closer to the determinations by Lutz et al. (Lu89 (1989)), =2.23 mag, and Freitas Pacheco & Costa (Fr96 (1996)), =3.7 mag.
Another result of this work that deserves some discussion is the remarkable ionized mass of the extended nebula, amounting to about a tenth of a solar mass (see section 6.2). Given such a large value, and considering that only a negligible fraction of the Mira wind is captured by the white dwarf, it seems clear that the main donor of mass for the nebula is the Mira. As Corradi et al. (Co01 (2001)) suggested, this kind of nebulae are likely to be the result of the interaction of the slow winds from the Mira with the fast winds from an outbursting white dwarf. Given the articulated structure of these nebulae, it is not easy to understand how the different winds contribute to each morphological component, but it seems natural to associate the high velocity features (like the polar jets) directly with the fast winds from the hot white dwarf and its accretion disc. Many of the features of the nebula around Hen 2–104 could be explained by the weak-jet model of the hydro-dynamic calculations by García-Arredondo & Frank (Ga04 (2004)). Although the initial conditions they assumed for the two case studies are different, the conclusions of their model are applicable. This emphasizes the key role of the Mira in supplying the material and the essential role of the white dwarf companion in accelerating and, in all probability, deflecting the streamlines of the Mira’s wind to shape the bipolar morphology that we see today. Our spatio-kinematic fit clearly shows that the outflow speeds are slowest at low latitudes and highest along the polar direction. This is the same pattern as found in most bipolar PNe (e.g. Corradi Co04 (2004)), as well as in other classes of objects like in the homologously expanding bipolar homunculus of Carina (Smith & Gehrz Sm98 (1998)). Thus, the mechanisms that may have formed Hen 2–104 are not limited to symbiotic stars and PNe, and may be common when the mass loss rate of the source is high.
We have also found that the walls of the two lobe pairs of Hen 2–104 are very thin compared to their radial distance from the star. A comparison to the sound crossing time allows for some speculation about the mechanism holding the walls tightly together. If the gas temperature is (and has been) 104 K since the ejection 4000 yrs ago (at the computed distance), the sound speed is 10 km s-1, so it travels 1.2 1012 km in 4000 yrs. The wall thickness of the inner lobes (0′′.9), 3.5 1011 km, is less than the sound travel distance, implying that something like an outside pressure or an embedded magnetic field is holding the walls of the inner lobes together, perhaps accounting for their relatively smooth and structured appearance and high emission density. The outer walls are 1.3 1012 km thick (3′′.4), which is roughly the sound crossing distance. This means that the walls of the outer lobes are expanding at their sound speed (i.e. driven by their own thermal pressure).
For a typical AGB wind speed of 15 km s-1 (Habing, Tignon & Tielens Ha94 (1994)), it would take 2.6 104 yrs to the gas lost by the Mira of Hen 2–104 to fill the volume presently occupied by the nebula (0.4 pc in radius at the adopted distance). During this lapse of time, an average mass loss rate of 3.5 10-6 M⊙ yr-1 would be needed to accumulate the total mass of the nebula (0.1 M⊙) around the system, that later would be shaped by fast winds from the outbursting white dwarf companion. This mass loss rate is in good agreement with the one expected from a 6000 L⊙ Mira variable (Alard et al. Al01 (2001)), making the depicted scenario a coherent one and reinforcing our distance and mass estimates.
In any case, the mass of the nebula of Hen 2–104 is remarkably larger than previously thought for this class of objects, and more similar to the ionized masses of genuine PNe (Pottasch Pobook (1984)). Thus the Mira in Hen 2–104 would be in a quite evolved stage, close to the tip of the AGB, where due to strong mass loss a massive circumstellar envelope can be built up. The ionized nebula that we observe can therefore be seen as a sort of “premature” PN, in which the nebular shaping and excitation is done by the WD companion, which “anticipates” the post-AGB evolution of the Mira. Note that the kinetic energy of the nebula of Hen 2–104 (8 1044 erg) and its momentum (1039 g cm s-1) are similar to those of regular PNe, and significantly lower than the momentum computed by Bujarrabal (Bu01 (2001)) for a number of multi-polar young and proto-PNe. The energetics of the outflow of Hen 2–104 can be accounted by the Mira luminosity and the energy released by a slow-nova explosion on the WD companion.
In the past, it has been often stated that a distinctive characteristic of the nebulae around symbiotic stars is that they are one or two orders of magnitude less massive than PNe. Hen 2–104 shows that this is not the rule, so that the line dividing PNe from symbiotic nebulae might actually be more blurred than previously thought.
Acknowledgements.
The authors wish to thank Vera Kozhurina-Platais, Warren Hack, Anton Koekemoer, and Richard Hook from STScI for their kind help in multidrizzle usage, and Reinhard Hanuschik for the FLAMES dataline processing.References
- (1) Alard, C., Blommaert, J. A. D. L., Cesarsky, C., Epchtein, N., Felli, M., Fouque, P., Ganesh, S., Genzel, R., Gilmore, G., Glass, I. S., and 31 coauthors, 2001, ApJ, 552, 289
- (2) Bujarrabal, V., Castro-Carrizo, A., Alcolea, J., & Sánchez-Contreras, C., 2001, A&A, 377, 868
- (3) Contini, M., & Formiggini, L., 2001, A&!A, 375, 579
- (4) Corradi, R. L. M., & Schwarz, H., 1993a, A&A, 268, 714
- (5) Corradi, R. L. M., & Schwarz, H., 1993b, A&A, 269, 462
- (6) Corradi, R. L. M., & Schwarz, H., 1995, A&A, 293, 871
- (7) Corradi, R. L. M., Ferrer, O. E., Schwarz, H. E., Brandi, E. & Garc ía, L., 1999, A&A, 348, 978
- (8) Corradi, R. L. M., Livio, M., Balick, B., Munari, U., Schwarz, H. E., 2001, ApJ 553, 211
- (9) Corradi, R.L.M., 2003, in ‘Symbiotic stars probing stellar evolution’, Corradi R.L.M., Mikolajewska J. & Mahoney T.J. eds., ASP Conf. Ser., Vol. 303, p. 393
- (10) Corradi, R.L.M., 2004, in ‘Asymmetrical Planetary Nebulae III: Winds, Structure and the Thunderbird’, Meixner, M., Kastner, J. H., Balick, B. & Soker, N. eds., ASPC, 313, 148
- (11) García-Arredondo, F., & Frank, A., 2004, ApJ, 600, 992
- (12) Drimmel, R., Cabrera-Lavers, A., & López-Corredoira, M., 2003, A&A, 409, 205
- (13) Erben, T., Schirmer, M., Dietrich, J. P., Cordes, O., Haberzettl, L., Hetterscheidt, M. et al., 2005, AN, 326, 432
- (14) Feast, M. W., Glass, I. S., Whitelock, P. A., & Catchpole, R. M., 1989, MNRAS, 241, 375
- (15) Freitas Pacheco, J. A. & Costa, R. D. D., 1996, A&A, 309, 629
- (16) González, R. F., Raga, A. C., & Steffen, W., RMxAA, 41, 443
- (17) Groenewegen, M. A. T., & Whitelock, P. A., MNRAS, 281, 1347
- (18) Habing, H. J., Tignon, J., Tielens, A. G. G. M., 1994, A&A, 286, 523
- (19) Hartigan, P., Raymond, D., & Hartmann, L., 1987, ApJ, 316, 323
- (20) Kamath, U. S., & Ashok, N. M., 2002, in ‘Symbiotic stars probing stellar evolution’, Corradi R.L.M., Mikolajewska J. & Mahoney T.J. eds., ASP Conf. Ser., Vol. 303, p. 133
- (21) Kenyon, S.J., & Webbink, R. F., 1984, ApJ 279, 252
- (22) Kenyon, S.J., 1986, The Symbiotic Stars, Cambridge University Press
- (23) Koekemoer, A., Fruchter, A., Hook, R., & Hack, W., 2002, HST Calibration Workshop, p. 337
- (24) Livio, M., Prialnik, D., & Regev, O., 1989, ApJ, 341, 299
- (25) Luridiana, V., Pérez, E., & Cerviño, M., 2003, AJ, 125, 3196
- (26) Lutz, J. H., Kaler, J. B., Shaw, R. A., Schwarz, H. E., & Aspin, C., 1989, PASP, 101, 966L
- (27) Mellema, G., A&A, 2004, 416, 623
- (28) Morisset, C., 2006, in ‘Planetary Nebulae in our Galaxy and Beyond’, Barlow, M. J. and Méndez, R. H., Proceedings of the International Astronomical Union, Symposium #234, p. 467
- (29) Munari, U. & Zwitter, T., 1997, A&A, 318, 269
- (30) Osterbrock D., 1989, ‘Astrophysics of Gaseous Nebula and Active Galactic Nuclei’, University Science Books, 20 Edgehill Road, Mill Valley, CA 94941
- (31) Palen, S. E., Hajian, A. R., & Balick, B., 2000, AAS, 196, 6101
- (32) Phillips, J. P., 2007, MNRAS, 376, 1120
- (33) Pottasch, S. R., 1984, ‘A study of Late Stages of Stellar Evolution’, Astrophysics and Space Science Library, Volume 107
- (34) Reed, D. S., Balick, B., Hajian, A. R., Klayton, T. L., Giovanardi, S., Casertano, S., & Panagia, N., 1999, AJ, 118, 2430
- (35) Sahai, R., 2002, RMxAC, 13 ,133
- (36) Santander-García, M., Corradi, R. L. M., Balick, B., & Mampaso, A., 2004, A&A, 426, 185
- (37) Santander-García, M., Corradi, R. L. M., Whitelock, P. A., Munari, U., Mampaso, A., Marang, F., Boffi, F., & Livio, M., 2007a, A&A, 465, 481
- (38) Santander-García, M., & Corradi, R. L. M. & Mampaso, A., 2007b, in ‘Asymmetrical Planetary Nebulae IV’, in press
- (39) Schmeja, S., & Kimeswenger, S., 2003, in ‘Symbiotic stars probing stellar evolution’, Corradi R.L.M., Mikolajewska J. & Mahoney T.J. eds., ASP Conf. Ser., Vol. 303, p. 446
- (40) Schönberner, D., Jacob, R., & Steffen, M., 2005, A &A, 441, 573
- (41) Schwarz, H. E., Aspin, C., Lutz, J.H., 1989, ApJ 344, L29
- (42) Shaw, R. A., & Kaler, J. B., 1989, ApJS 69, 495
- (43) Smith, N., & Gehrz, R. D., 1998, AJ, 116, 823
- (44) Sokoloski, J.L. 2002, in Symbiotic Stars Probing Stellar Evolution, R.L.M. Corradi et al. eds., ASP Conf. Ser. 303, 202
- (45) Solf, J., & Ulrich, H., 1985, A&A, 148, 274
- (46) Whitelock, P. A., 1987, PASP, 99, 573
- (47) Whitelock, P. A., Menzies, J., Feast, M., Marang, F., Carter, B., Roberts, G., Catchpole, R., & Chapman, J., MNRAS, 267, 711
- (48) Whitelock, P. A., 2003, in ‘Symbiotic stars probing stellar evolution’, Corradi R.L.M., Mikolajewska J. & Mahoney T.J. eds., ASP Conf. Ser., Vol. 303, p. 41
- (49) Wright, A. E. & Allen, D. A., 1978, MNRAS, 184, 893