Ordered, disordered and coexistent stable vortex lattices in single crystals.
Abstract
It is commonly accepted that the peak effect (PE) in the critical current density of type II superconductors is a consequence of an order-disorder transition in the vortex lattice (VL). Examination of vortex lattice configurations (VLCs) in its vicinity requires the use of experimental techniques that exclude current induced VL reorganization. By means of linear susceptibility experiments in the Campbell regime, where vortices are forced to oscillate (harmonically) around their effective pinning potentials, we explore quasi-static stable and metastable VLCs in single crystals near the PE. We identify three different regions: for , stable VLCs are maximally ordered. For configurations are fully disordered and no metastability is observed. In the region we find temperature dependent stable configurations with intermediate degree of disorder, possibly associated to coexistence of ordered and disordered lattices throughout the PE. A simple estimation of the equilibrium proportion of ordered and disordered domains is provided.
The behavior of systems under the influence of both, thermal and quenched disorder has been an issue of intense research over the last 50 years in different areas of condensed matter physics. Quenched disorder can broaden first order phase transitions inducing phenomena as phase separation (under active study in the context of manganites for instance) and if sufficiently strong can even change completely the properties of this system producing the appearance of new phases (as it is the case in many glassy states) [2].
In this context, the vortex lattice (VL) in superconductors provides models systems where elastic and pinning interactions together with thermal fluctuations compete. A fingerprints of complex behavior in this system is the Peak Effect (PE), an anomalous non-monotonous dependence of the critical current density with both temperature and magnetic field [3]. The origin and nature of this behavior are still controversial issues.
Phenomenological pictures based in an order-disorder (O-D) transition from a quasi-ordered Bragg glass (BG) [4] to a disordered phase with proliferation of topological defects [5] explain a broad amount of related experimental results. However, the underlying physics of the transition, the structural symmetry of the disordered phase [6] and its connection with a clean limit melting transition [8, 7] are issues that remain unsolved. While increasing amount of experimental evidence [9] suggests that the nature of the PE could depend on the various materials, the marked metastability and history effects are common facts reported both in low [10, 11, 12] and in high [13] materials.
In traditional superconductors, neutron diffraction experiments show a clear change in the structure factor lattice at the PE indicating an O-D transition [14]. In , metastable coexisting regions with different have been directly observed [15]; this fact as well as transport measurements in the Corbino geometry [12] and experiments of magnetization assisted by a shaking field [11], suggest a first order transition where the magnetic field assists an equilibration process from a supercooled disordered metastable phase to an ordered stable BG phase.
PE and history effects are often studied by means of transport experiments. In standard transport techniques, vortex undergo some type of current-induced reorganization and therefore the original vortex lattice configuration (VLC) is not accessible. To overcome this problem, Xiao et al. [8] have developed a sophisticated ultrafast transport technique and have shown the existence of an enlarged crossing phase boundary between ordered and disordered phases in crystals. A well known and appropriate technique to measure the pinned VL response without external disturbances is susceptibility restricted to the linear Campbell regime [16] where a very small field superimposed to the field is applied, forcing vortices to perform small (harmonic) oscillations inside their effective pinning potential wells.
In this letter we explore quasi-static VLCs in the Campbell regime in single crystals in the vicinity of the PE following different thermal, magnetic and dynamical histories. Essential to our work, we avoid any measurement induced VL reorganization. We are able to access the corresponding stable configuration at each temperature (field) by applying a shaking field. For the first time, the pinning potential curvature of stable quasi-static VLCs is measured throughout the PE, resulting in a clear identification of low temperature maximally ordered, high temperature maximally disordered and stable configurations with intermediate degree of disorder at intermediate temperatures. In the last case, the stable VLCs are separated by energy barriers, possibly related with surfaces between coexisting ordered and disordered VL domains. We can also observe the evolution of the pinning potential with temperature in metastable VLCs and confirm the spontaneous ordering in cooling processes [17].
Results shown here correspond to a single crystal [18] of approximate dimensions , with (defined as the mid point of the susceptibility linear transition at ) and . susceptibility has been measured with a home made susceptometer based in the mutual inductance technique. All fields are parallel to the axis of the sample.
In the Campbell limit, the inductive component of susceptibility is determined by the geometry and the dimensionless parameter ( is the real penetration depth and is a characteristic sample dimension). In this regime the imaginary penetration depth . The curvature of the effective pinning potential well is the Labusch constant that can be numerically estimated from , where is the London penetration depth (for references and details of the numerical procedure see Ref.[19]).
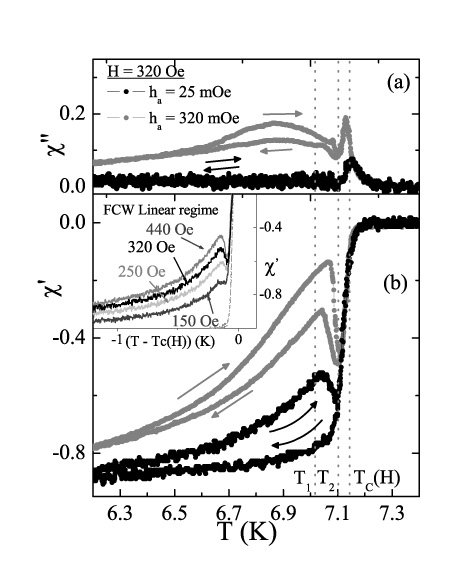
Fig. 1 shows typical (panel a) and (panel b) field cool cooling (FCC) and field cool warming (FCW) curves in the linear ( , black) and non-linear regime ( , gray) at . The temperatures at which shows a maximum or a minimum (and in Ref. [20]) slightly depend on or history . Above a temperature FCW and FCC curves merge. Below , so dissipation is very small () and is frequency independent in the kHz range, indicating a Campbell regime. In the non-linear regime, where vortices are forced out of their pinning sites, both FCC and FCW curves display PE whereas in the linear Campbell regime it appears only in the warming process. As the PE is a signature of an O-D transition, its absence in the FCC Campbell regime indicates that the VL nucleates at high T and remains trapped in a metastable disordered and strongly pinned configuration. On the other hand, even if induced currents are not able to assist the VL, the system warms with lower pinning potential (larger penetration depth). In this framework, the hysteresis displayed in the Campbell regime must imply some kind of spontaneous re-ordering at low temperatures. This ordering during FCC was recently observed by using a time resolved transport technique [17]. In the inset of Fig. 2, recorded in various warming processes from different low temperatures is shown. A lower initial temperature results in a less pinned (more ordered) VLC. We have tested that the warming curves are independent on the cooling/warming rate, and are identical if the cooling process is performed without measurement.
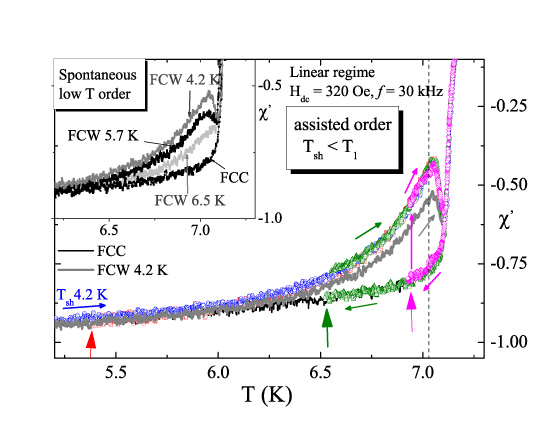
This spontaneous ordering at low temperatures, can be enhanced by applying a large shaking field. This shaking field allows the system to explore the free-energy landscape and to reach a more ordered and stable VLC. This feature is illustrated in the main panel of Fig. 2. The result of the FCW process from shown in the inset (gray line curve in both panels ) is compared with various warming curves (symbols) recorded after shaking the lattice at different temperatures (large vertical arrows). The following process has been performed: the system has been measured in the linear regime during FCC procedure and stabilized at . Then the measurement was interrupted and a sinusoidal shaking field of - was applied during . The measurement () was resumed in a warming procedure starting from leading to a drastic decrease of pinning (vertical color lines in the figure). The various symbols are hard to distinguish because all warming procedures collapse to the same curve. This curve has remarkable characteristics below a temperature (dotted line in the figure): first, it is reversible; second, after any additional shaking, with any waveform or amplitude, the system remains in this configuration [21]. These features constitute a first important result: below the stable VLCs (attained via smooth temperature changes) are continuously connected in a minimum of the free-energy landscape. These are the less pinned (more ordered) VLCs at each . This picture is consistent with a stable ordered BG below where changes in only produce elastic (reversible) deformations.
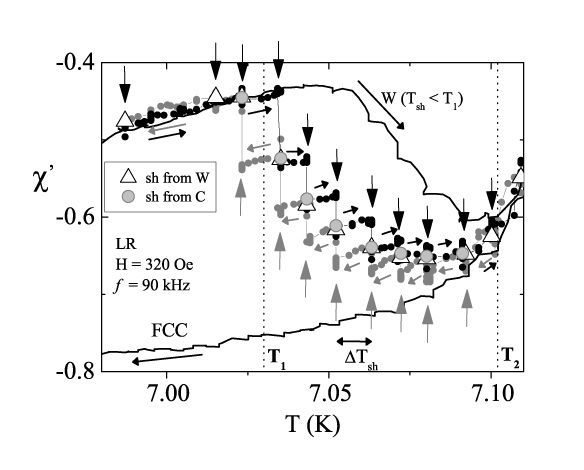
The description changes completely when : the more ordered VLCs become unstable and the PE develops. Again, the system does not reach spontaneously a stable VLC: warming (cooling) leads to metastable over ordered (disordered) configurations. In every case, a large shaking field assists the system in accessing a stable VLC. The qualitative difference observed above is that, once a stable VLC has been reached, any smooth temperature variation results in new metastable states: the stable configuration at the new temperature is only reached through shaking; consequently, no reversibility is possible. This remarkable feature is one of the central issues of this Letter, and is illustrated in Fig. 3 where values in the linear regime corresponding to the stable VLCs at various are plotted in large symbols. The complete experiment shown in Fig. 3 is the following: First a warming process (small black dots) was performed stabilizing temperature successively at very small intervals [22]. At each (indicated by black large vertical arrows) the measurement was interrupted and the same shaking protocol described above was performed, in way to reach the stable VLC (open triangles). At fixed temperature, additional perturbations do not modify the response and the system remains in this stable configuration. Then the measurement on warming was resumed (small black dots) until the next was reached. As increases the corresponding stable VLC is more disordered.
Once was reached, a cooling process (small gray dots) was performed and a similar protocol was followed, shaking the system at the same temperatures (gray vertical arrows). Notice that obtained after shaking in warming (hollow triangles) and cooling (gray circles) is the same (within experimental resolution). This central result supports the stability of VLCs with intermediate order, and rules out the possibility that they arise from a harder metastability or slow dynamics. The more ordered (warming curve after shaking at ) and the more disordered FCC curve are shown for reference in black line.
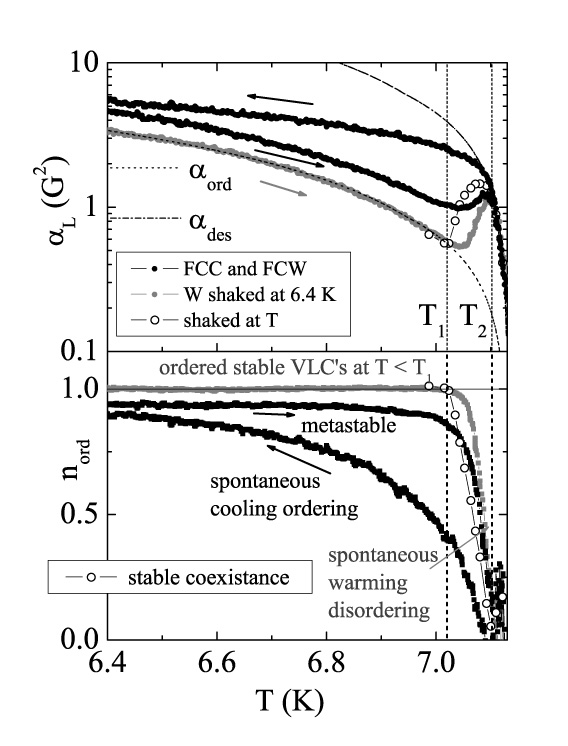
To quantify the pinning strength on the various VLCs, the effective Labush parameter corresponding to each VLC has been estimated from the values in the linear regime at in the region where . The result is shown in Fig. 4a. Black curves correspond to metastable VLCs evolving in FCC and FCW processes whereas the gray curve corresponds to ordered VLCs attained by shaking at . Hollow circles show corresponding to stable VLCs between and extracted from Fig. 3. It can be seen that all the curves approach at low . At the ordered VLCs (gray curve) become metastable. The corresponding to the stable VLC increases more than five times in the PE, indicating a huge increase of disorder, qualitatively different to the smooth and monotonically increasing observed in YBCO crystals [9, 21]. The ordered (reversible) gray curve below corresponds to a BG, free of dislocations, and the black (reversible) curve above corresponds to a completely disordered phase. The stable character of the VLCs with intermediate degree of disorder for , together with additional evidence of coexisting domains in [15], allows us to propose a scenario of equilibrium phase separation. In this framework, the metastability would arise from an exceeding proportion of ordered or disordered domains. To give a rough estimate of the proportion of ordered phase, we proceeded in the following way: we extrapolated the ordered Labusch parameter to zero at (dotted line in Fig. 4a) and we proposed to fit the black curve above (dash-dotted line in Fig. 4a). We then used the calculated to estimate the proportion of ordered phase corresponding to each VLC. The result is shown in Fig. 4b.
We arrive then to the following scenario. There are three different temperature regions along the PE: for , stable VLCs are maximally ordered and accessible by the application of a shaking field. We identify these ordered stable VLCs as a BG, continuously connected by elastic deformations in a minimum of the free-energy landscape. The robust metaestable states below show spontaneous ordering at low as elastic interactions overcome pinning forces, although remain separated from the BG by a finite barrier in all the experiemntal range, down to . For configurations are fully disordered and no metastability is observed. We identify with , the spinodal line in Ref [20].The evolution from the ordered BG to the high temperature disordered phase, in the small region, occurs by a gradual increase in the proportion of disorder. The equilibrium VLCs are only accessed from over-ordered or over-disordered configurations by a shaking field, that provides sufficient energy for plastic (irreversible) deformations to access the stable VLC. Plastic changes imply the creation or annihilation of dislocations, probably related to the movement of domain walls in a scenario of equilibrium phase separation. In conclusion, by measuring for the first time the pinning potential curvature of stable quasi-static VLCs, avoiding vortex lattice reorganization, we are able to present a consistent picture that describes the vortex lattice physics in the PE region in single crystals.
Acknowledgments We thank E. Fradkin, G. Borsi and C. Acha for discussions. This work was partially supported by UBACyT X142, UBACyT X200 and CONICET.
References
- [1]
- [2] Y. Imry and M. Wortis, Phys. Rev. B 19, 3580 (1979); E. Dagotto, T. Hotta and A. Moreo, Phys. Rep. 344 (2001) and references therein; P. Chaddah, cond-mat/0602128.
- [3] W. De Sorbo, Rev. Mod. Phys. 36, 90 (1964); A. I. Larkin and Yu. N. Ovchinnikov, J. Low Temp. Phys. 34, 409 (1979).
- [4] T. Giamarchi and P. Le Doussal, Phys. Rev. Lett. 72, 1530 (1994); Phys. Rev. B 52, 1242 (1995).
- [5] G. P. Mikitik and E. H. Brandt, Phys. Rev. B 64,184514 (2001); J. Kierfeld and V. Vinokur, Phys. Rev. B 69, 024501 (2004).
- [6] Y. Fasano et al., Phys. Rev. B 66, 020512(R) (2002).
- [7] N. Kokubo, K. Kadowaki and K. Takita, Phys. Rev. Lett. 95, 177005 (2005).
- [8] Z. L. Xiao et al., Phys. Rev. Lett. 92, 227004 (2004).
- [9] G. Pasquini and V. Bekeris; Supercond. Sci. Technol. 19, 671 (2006) and references therein.
- [10] See, e. g., W. Henderson, E. Y. Andrei, and M. J. Higgins, Phys. Rev. Lett. 81, 2352 (1998); Z. L. Xiao, E. Y. Andrei, and M. J. Higgins, ibid. 83, 1664 (1999).
- [11] G. Ravikumar et al.; Phys. Rev. B 61, 12490 (2000).
- [12] Y. Paltiel et al., Nature (London) 403, 398 (2000).
- [13] S. O. Valenzuela and V. Bekeris, Phys. Rev. Lett. 84, 4200 (2000); D. Stamopoulos, M. Pissas and A. Bondarenko, Phys. Rev. B 66, 214521 (2002).
- [14] X. S. Ling et al., Phys. Rev. Lett. 86, 712 (2001).
- [15] M. Marchevsky, M. J. Higgins and S. Battacharya, Nature 409, 591 (2001).
- [16] A.M. Campbell, J. Phys. C 4, 3186 (1971); E. H. Brandt, Phys. Rev. Lett. 67, 2219 (1991); Physica C 195, 1 (1992).
- [17] G. Li et al., Phys. Rev. Lett. 96, 17009 (2006).
- [18] Crystals provided by Bell Labs.
- [19] G. Pasquini et al., Phys. Rev. B 59, 9627 (1999) and references therein.
- [20] A. D. Thakur et al., Phys. Rev. B 72, 134524 (2005).
- [21] For a different phenomenology see S. O. Valenzuela and V. Bekeris, Phys. Rev. Lett. 86, 504 (2001).
- [22] This is very well determined by the smallest step in the setpoint of the temperature controller.