11email: [giampaolo.piotto; sandro.villanova]@unipd.it 22institutetext: Space Telescope Science Institute, 3700 San Martin Drive, Baltimore, MD 21218, USA
22email: [bedin; jander]@stsci.edu 33institutetext: INAF-Osservatorio Astronomico di Collurania, via M. Maggini, I-64100 Teramo, EU
33email: cassisi@oa-teramo.inaf.it 44institutetext: Grupo de Astronomía, Departamento de Física, Universidad de Concepción, Casilla 160-C, Concepción, Chile.
44email: svillanova@astro-udec.cl 55institutetext: Dept. of Physics and Astronomy, The Johns Hopkins University, Baltimore, MD 21218, USA
55email: imants@pha.jhu.edu 66institutetext: European Southern Observatory, Garching, Karl-Schwarzschild-Str. 2, D-85748, EU
66email: lpasquin@eso.org 77institutetext: INAF-Osservatorio Astronomico di Padova, Vicolo dell’Osservatorio 5, I-35132, EU
77email: yazan.almomany@oapd.inaf.it 88institutetext: Aryabhatta Research Institute of Observational Sciences, Manora Peak, Nainital 263 129, India
88email: sagar@aries.ernet.in
Ground-based CCD astrometry with wide field imagers.
Abstract
Context. The solar-age open cluster M 67 (C0847120, NGC 2682) is a touchstone in studies of the old Galactic disk. Despite its outstanding role, the census of cluster membership for M 67 at fainter magnitudes and their properties are not well-established.
Aims. Using the proprietary and archival ESO data, we have obtained astrometric, photometric, and radial velocities of stars in a 3433 arcmin2 field centered on the old open cluster M 67.
Methods. The two-epoch archival observations separated by 4 years and acquired with the Wide Field Imager at the 2.2m MPG/ESO telescope have been reduced with our new astrometric techniques, as described in the first paper of this series. The same observations served to derive calibrated photometry in M 67. Radial velocities were measured using the archival and new spectroscopic data obtained at VLT.
Results. We have determined relative proper motions and membership probabilities for 2,400 stars. The precision of proper motions for optimally exposed stars is 1.9 mas yr-1, gradually degrading down to 5 mas yr-1 at . Our relatively precise proper motions at are first obtained in this magnitude range for M 67. Radial velocities are measured for 211 stars in the same field. We also present a detailed comparison with recent theoretical isochrones from several independent groups.
Conclusions. For M 67 area we provide positions, calibrated photometry, relative proper motions, membership probabilities, and radial velocities. We demonstrate that the ground-based CCD mosaic observations just a few years apart are producing proper motions, allowing a reliable membership determination. We produced a catalogue that is made electronically available to the astronomical community.
Key Words.:
Galaxy: open clusters and associations: individual: M 67 - astrometry - catalogs1 Introduction
Open clusters are at the basis of our understanding of stellar evolution. Among them, M 67 (C0847+120) has a unique and special role. Due to their dynamical evolution and inevitable dissolution, old open clusters are rare. Only a handful open clusters are presently known with ages comparable to or older than the Sun. M 67 is one of them and having a solar chemical composition, being relatively nearby (900 pc) and with a low interstellar reddening is one of the most studied open clusters (see Tab. 1 for fundamental parameters). Among these studies we recall determination of the cluster proper-motion membership (Sanders 1977, Girard et al. 1989, Zhao et al. 1993), photometry (Montgomery et al. 1993, Sandquist 2004, Momany, Y., et al. 2001, Balaguer-Núñez et al. 2007), high resolution spectroscopy to determine chemical composition (Tautvaišiene et al. 2000, Randich et al. 2006).
In addition, M 67 harbors an array of interesting objects including blue stragglers (Shetrone & Sandquist 2000); one AM Her star (Gilliland et al. 1991, Pasquini et al. 1994); several X-ray active stars, detected as coronal sources by ROSAT (Pasquini & Belloni 1998, van den Berg et al. 1999); a red straggler and two sub-subgiants (Mathieu et al. 2003). Other studies have been devoted to the white dwarf cooling sequence (Richer et al. 1998), the evolution of chromospheric activity along the RGB (Dupree et al. 1999) and in solar-type stars (Pace & Pasquini 2004), and the evolution of angular momentum of stars close to the turnoff (Melo et al. 2001). The behavior of light elements such as lithium and beryllium and their implications for mixing theories have been studied by Pasquini et al. (1997), Jones et al. (1999) and Randich et al. (2007). Extensive radial velocity surveys have been carried out, resulting in discovery of many binaries (e.g., Mathieu et al. 1997). The attempts were made to determine stellar oscillations through a multi site accurate photometry (Gilliland et al. 1991, Stello et al. 2007). Given the uniqueness of this cluster and the similarity of its key properties to the Sun, new studies are under way to explore spectroscopically the main sequence stars, as it has been done in the other clusters (Pace et al. 2007, Biazzo et al. 2007).
Despite of the wealth of accumulated data on M 67, a fundamental question of complete cluster membership is still open. The existing high-quality proper motion surveys carried out by Sanders (1977), Girard et al. (1989), and Zhao et al. (1993) are based on photographic plates limited to 16. This is only three magnitudes below the main-sequence turnoff. However, dedicated and/or archival multi-epoch observations with wide-field CCD imagers offer new opportunities to derive precise proper motions within a short, few-year time-span, that are also deeper by several magnitudes than the photographic surveys. The techniques of ground-based CCD astrometry (and photometry) have been developed and validated on two nearby globular clusters using the observations with the MPG/ESO 2.2m telescope and its wide-field m camera (Anderson et al. 2006; hereafter Paper I). With this setup, just a 2.7 year time baseline yields proper motions as precise as 2 mas yr-1. The existing archival m CCD frames for M 67 made this open cluster a prime target for deep proper motions based on this techniques. There is one report on proper motions in M 67 for stars fainter than by Lattanzi (1993). No catalogues of data ever followed, therefore we consider this conference paper of little contribution to the membership studies in M 67. In this study we enlarge the number of stars with known proper motion determination by a factor of 2 over a 0.3 deg2 area down to which is 5 magnitudes deeper than the existing proper-motion studies of M 67.
In addition, we analyzed a large number of FLAMESGIRAFFE@VLT high resolution spectra and determined radial velocities for 211 stars in the M 67 field good to 0.5 km s-1, the accuracy which is suitable for reliable RV membership and identification of short-period binary systems. All new observational data are provided to the astronomical community with the aim of convenient access to these data for the follow-up studies.
The main goal of this study is to extend the membership analysis to much fainter magnituds and present a catalogue of objects in a wide-field () centered on the old open cluster M 67. The catalogue provides new positions, multi-band photometry, proper motions, membership probabilities, and radial velocities.
The structure of the paper is as follows. In Sect. 2 we describe observations and data reduction of both, the images and spectra. In Section 3 and 4 we present the cluster proper motion membership analysis in two different ways. In Section 5 we provide comparison with other photometric data available in the literature. In Sect. 6 a detailed comparison with available models from different groups is given. Finally, in Sect. 7 we present and describe the electronic catalogue and how to use it.
| Parameter | Value | Reference |
|---|---|---|
| (J2000) | 08h 51m 23.s3 | this work |
| (J2000) | +11∘ 49′ 02′′ | this work |
| 215.∘688 | this work | |
| 31.∘923 | this work | |
| Randich et al. (2006) | ||
| 0.041 | Taylor (2007) | |
| 9.56-9.72 | this work | |
| Age[Gyr] | 3.5-4.8 | this work |
| Filters | Exposure Time | Seeing | Airmass |
| first epoch: Feb. 16, 2000 | |||
| 930s | 1′′.0 | 1.4 | |
| 920s; 1130s; 3120s | 1′′.0 | 1.5 | |
| 930s | 1′′.0 | 1.4 | |
| second epoch: Feb. 12, 2004 | |||
| 160s; 1300s | 1′′.2 | 1.3 | |
2 Observational Data and Reductions
2.1 Astrometric and Photometric Reductions
All the images used in this study were obtained with the Wide Field Imager (hereafter simply ) at the MPG/ESO 2.2m telescope at La Silla, Chile. The consists of eight 20484096 EEV CCDs with a pixel scale of 238 milliarcsec (mas) which provides a total field-of-view 34. More details on the instrumental setup are given in Paper I.
In order to calculate proper motions, we searched the MPG/ESO 2.2m telescope archive for suitable CCD imager frames providing deep images obtained at separate epochs. We found that the open cluster M 67 was observed in 2000 and 2004 during the technical nights. Some details of the data-set used in this work are given in Table 2. These observations contain short and long exposures, allowing to sample both the red giant branch (RGB) and the relatively faint main-sequence (MS) stars. It should be noted that these archival datasets have not been taken with the goal of obtaining proper motions or well-calibrated photometry. The second epoch is represented only by two images and individual frames have not been properly dithered. As the result, the distribution of registered stars is not contiguous. Additional CCD imaging is planned, however its success is dependent upon a proven record of publications.
We closely followed the prescription on reductions of images given in Paper I. This include standard manipulations with the pixel data such as de-biasing, flat-fielding, and correction for cosmic rays. At the core of fitting the star positions and fluxes is the empirical Point Spread Function. In this concept, the PSF is represented by a look-up table on a very fine grid. It is well-documented that the shape of PSF changes with position on a chip. This variability can be captured by an array of PSFs across the chip. A fully automated code is developed to find appropriate stars which can adequately represent the PSF. For practical purposes the number of PSF stars per chip can vary from 1 to 15, depending on the richness of a star-field. An iterative process is designed to work from the brightest down to the faintest stars and find their precise position and instrumental flux. A reasonably bright star can be measured with a precision of 0.03 pixel (7 mas) from a single exposure. In this step of empirical PSF fitting we obtained precise instrumental magnitudes in filters.
Another issue in astrometry with reflectors is a large geometric distortion in the focal plane that effectively changes the pixel scale across the field-of-view. There are different ways to derive this geometric distortion. We opted for a element look-up table of corrections for each chip, derived from multiple optimally-dithered observations of the Galactic Bulge in Baade’s Window (Paper I). This look-up table provides the best currently available characterization of geometrical distortions for the m. At any given location on the detector, a bi-linear interpolation between the four closest grid points from a look-up table provided the corrections for the target point. The derived look-up table may have a lower accuracy of the edges of a field because of the way the self-calibration frames were dithered (see Paper I). An additional source of uncertainty is related to a possible instability of distortions for the m reported earlier. This prompted us to use the local-transformation method to derive proper motions (see Paper I for details).
In the local transformation approach (a linear adjustment with six parameters – three in each of the two coordinates) a small set of local reference stars is selected around each target object. It is advantageous to use pre-selected cluster members to form a local reference frame because of a much lower intrinsic velocity dispersion among the cluster members (see Sect. 2.1.2). Then, a least-squares adjustment is used to translate the coordinates from one frame into another, taken at different epochs. The residuals of this transformation are characterizing relative proper motions convolved with measurement errors. In essence, this is a classical “plate pair” method but extended to all possible combinations of the first and second epoch frames. Relative proper motion of a target object is an average of all displacement measurements in its local reference frame. The last step is to estimate the measurement errors from intra-epoch observations where proper motions have a zero contribution. A complete description of all steps leading to proper motions is given in Paper I. We did not consider the effect of differential chromatic refraction because all CCD frames have been obtained within a narrow range of zenith distance (see Sect. 2.1.3 for details).

2.1.1 Photometric Calibration
Initially, we transformed our instrumental magnitudes obtained in filters into the standard Johnson Kron-Cousins magnitudes using standard stars from Stetson’s111http://cadcwww.hia.nrc.ca/standards/ secondary standard star catalogue (Stetson 2000, 2005). Unfortunately, the color and magnitude intervals covered by these secondary standards are not ideal to properly calibrate our sample. Our RGB stars are saturated and the faint MS stars are not present in the secondary standard catalogue, thus confining us to a narrow range of colors for calibrations. Therefore for our calibrations, we chose the high-precision photometry of M 67 by Sandquist (2004). This photometry covering the entire color range of stars in M 67, is calibrated using the observations of Landolt’s standards (Landolt 1992) and, to some extent, also Stetson’s secondary standards. Sandquist (2004) also made use of photometric and spectroscopic data to select the objects most likely to be single stars. For these reasons and the ones outlined in Section 6 we link our photometry to that of Sandquist (2004)222http://www.blackwellpublishing.com/products/journals/ suppmat/MNR7174/MNR7174sm.htm. This calibrated photometry covers only the inner four m CCD chips. We used the common stars in dithered frames between the pairs of adjacent CCD chips to obtain individual photometric zero-points in magnitude. Then, we solved for the global zero-point and color term using one of the following transformation equations:
where is the instrumental magnitude and is the Sandquist’s calibrated magnitude; are the color terms (constants); and are the global zero-points. The quadratic color terms are negligible. Our color terms are consistent with those posted on the m webpage333http://www.ls.eso.org/lasilla/sciops/2p2/E2p2M/WFI/zeropoints/. A comparison of our photometry with the Sandquist and Stetson catalogues is presented in Sec. 5.
In Figure 1 we show our photometric errors for each filter, as function of the corresponding calibrated magnitude. The photometric errors (standard deviation) have been computed from multiple observations, all reduced to the common photometric reference frame in the chosen bandpass. On average, the errors are larger than 0.03 mag for stars fainter than 19 mag. The stars brighter than 12.5 mag show higher dispersion because of the image saturation.
2.1.2 Proper Motions
We first photometrically selected likely cluster members in the color-magnitude diagram and used only these stars as a local reference frame to transform the coordinates from one image into the system of the other image at different epoch and, thus derive relative proper motions. By using predominantly the cluster stars, we ensure that proper motions will be measured relative to the bulk motion of cluster stars. According to Girard et al. (1989), the intrinsic velocity dispersion in M 67 is 0.2 mas yr-1. Over the four-year epoch difference that would result in a displacement of only 0.8 mas which is by a factor of 10 smaller than the random measurement errors. Conversely, the tangential velocity dispersion of field stars is by a factor of larger than the cluster’s intrinsic velocity dispersion. For field stars, proper motions are clearly dominating over the measurement errors and this has an adverse effect on the coordinate transformations. We iteratively removed some stars from the preliminary photometric member list that had proper motions clearly inconsistent with cluster membership, even though their colors placed them near the fiducial cluster sequence.
In order to minimize the influence of any unaccounted for residual distortion and refraction effects on proper motions, we used local transformations based on the nearest 20 reference stars, typically extending over 300 arcsec. These are well-measured cluster stars of any magnitude selected on the same CCD chip, as long as their preliminary proper motion is consistent with cluster membership. No systematics larger than our random errors are visible close to the corners or edges of chips. In order to avoid possible filter-dependent systematic errors, we measured proper motions in the bandpass only, for which the geometrical distortion corrections were originally derived (Paper I). Individual errors of proper motions for single stars have been estimated as described in Section 7.3 of Paper I.
In a nutshell, we estimate the intra-epoch rms error from all first-epoch plates locally transformed into the same reference frame. Due to the lack of adequate statistics (too few images) we assumed that the second epoch frames have the same errors for a given instrumental magnitude. The proper motions errors have been computed as the rms of the proper motion, obtained from solving locally each first-epoch frame into second-epoch frame. These errors, however, are not totally independent because the same frame is used for a second epoch. Therefore, to obtain our best estimate of the proper motion standard error we added in quadrature initial proper motion error and the adopted error of the second epoch image.
Figure 2 shows the distribution of standard errors () in proper motions for both coordinates as a function of magnitude. The precision of our proper motion measurement is 0.05 pixels in 4 yrs down to 18 mag (i.e., 3 mas yr-1). At fainter magnitudes the errors gradually increase, reaching 6 mas yr-1 at =20. The stars brighter than 12.5 mag show a higher dispersion because of the image saturation.

2.1.3 Astrometric Calibration
One of our goals is to provide in the area of M 67 an astrometric frame on the International Celestial Reference System (ICRS). Our astrometric reductions leads us to the distortion-free cartesian coordinates of all objects. The positions of stars in each frame have been corrected for geometric distortion using a look-up table from Paper I, and then averaged into a common reference frame using a six-parameter linear transformation. The astrometric positions of this catalogue are still affected by differential chromatic refraction (DCR) effects and the limitations on the stability of derived geometrical distortions, as described in Sect. 5.2 of Paper I.
To link the present M 67 catalogue to ICRS, we used the UCAC2 catalogue (Zacharias et al. 2004) as a reference frame. It was trimmed down to the stars with positional accuracies better than 75 mas. Owing to the excellent geometric distortion solution and a reasonable stability of the intra-chip positions it was possible to apply a single plate model involving linear and quadratic terms and a small but significant cubic term in each coordinate. This solution also absorbes effects caused by differential refraction but not its chromatic component. The standard error of equatorial solution is only 30 mas in each coordinate, thus indicating a great potential of the WFI for astrometry.
A total of 489 reference stars were used in this solution. The provided J2000 coordinates in Table LABEL:catalogT are on the epoch 2000.13.
A compilation of kinematic and photometric data from a variety of sources (Platais, unpublished) allowed us to pre-select a fairly clean list of cluster members down to , which then was used to derive a better geometrical center of M 67. The marginal distributions of cluster members along right ascension and declination were fit with a Gaussian. This fit yielded a cluster center listed in Table 1, accurate to about .
The proper motions in this work have not been corrected for differential chromatic refraction effects (DCRE) as done in Paper I. Nonetheless, we verified the differential chromatic refraction effect and found it to be negligible in this data set owing to the very similar observing conditions at both epochs.
The only determination of absolute proper motion for M 67 is that from using two Hipparcos stars (HIP 43465, 43491) – apparent members of the cluster (Baumgardt et al. 2000). According to this study the absolute proper motion for M 67 is and mas yr-1. Although a few background galaxies are visible in our images, they are not suitable for deriving the correction needed to convert our relative proper motions into the absolute proper motions.
2.2 Radial Velocities: Reduction and Calibration
With the aim of obtaining additional membership information for stars in the region of M 67, we searched the ESO archive (http://archive.eso.org/) for sets of FLAMES+GIRAFFE@VLT (MEDUSA mode) observations taken simultaneously with calibration lamp. The MEDUSA mode allows obtaining about 130 spectra at once over a field-of-view of arcmin in diameter. We found observations performed with three different set-ups (HR02, HR14, HR15).
In addition to these data sets, we used the data (HR15N) obtained for a different project in DDT time (278.D-5027). They were collected to determine bona fide possible single solar-type members in M 67, closely resembling the Sun. The aim of this program is to find solar analogues among the M 67 solar type stars. Full analysis of the data is in progress and will be reported elsewhere (Biazzo et al., in preparation).
The instrumental set-up for each run is given in Table 3, indicating the wavelength range, resolution, the number of plates, and the date of observations.
| Set-up | (Å) | R | plates | OBS-DATE |
|---|---|---|---|---|
| HR02 | 3854-4049 | 19600 | 2 | 19/12/2002 |
| HR14 | 6383-6626 | 28800 | 5 | 26-28/02/03 |
| HR15 | 6607-6965 | 19300 | 6 | 26-28/02/03 |
| HRN15 | 6470-6790 | 17000 | 3 | 06-11-23/02/07 |

The spectroscopic data were reduced using the GIRAFFE pipeline GIRBLDRS444Blecha et al. (2000). See http://girbldrs.sourceforge.net/, for GIRAFFE pipeline, software and documentation., in which the spectra have been de-biased, flat-field corrected, extracted, and wavelength-calibrated, using both prior and simultaneous calibration-lamp spectra.
We also used the gyCrossC.py utility of the GIRAFFE pipeline to measure heliocentric radial velocity (). For each set-up, we used an appropriate K0 type template spectra developed by the GIRAFFE pipeline team.
The formal errors reported in the catalogue are merely the output of pipeline which is clearly underestimating the true errors. Nevertheless these estimates retain the information on the goodness of the fit of cross-correlation function.
There are signs of systematic errors in , if repeated measurements of radial velocity from different set-ups are considered. To estimate the amount of such errors, we computed the r.m.s. for all determinations of of the same star and averaged that estimate for all multiple measurements of radial velocity. As the result, a single measurement of radial velocity could be affected by systematics reaching up to 0.6 km s-1. Perhaps, this is an upper limit of systematic offsets because some stars may have a physical explanation of variations. To estimate the real uncertainty in radial velocities, we suggest to sum up in quadrature this estimate and the formal fitting error.
The heliocentric radial velocities and relative errors, are shown in Fig. 3 as a function of magnitude. Several stars have a radial velocity very different from the cluster’s mean velocity. This can be due to the field stars contaminating the spectroscopic sample, or short-period spectroscopic binaries which are bona fide cluster members. We determined the median of our sample of radial velocities and then estimated the dispersion around this median , assuming a Gaussian distribution and considering the 68th percentile from the median. Then we iteratively used a 3.5- clipping to achieve a convergence. The final mean heliocentric radial velocity for M 67 estimated from 141 cluster members is km s-1.
As indicated by Tab. LABEL:VRtab, our value of is consistent with those derived by the other authors.
| [km ] | Reference | |
|---|---|---|
| 34.07 0.10 | 144 | Mathieu et al. (1986) |
| 34.77 0.21 | 50 | Glushkova et al. (1990) |
| 33.54 0.13 | 27 | Glushkova, unpublished |
| 32.89 0.18 | 10 | Shetrone et al. (2000) |
| 33.85 0.16 | 26 | Melo et al. (2001) |
| 33.67 0.09 | 141 | this work |
3 Cluster CMD decontamination
In this section we probe the effectiveness of our proper motions in separating clusters stars from the field stars using a vector-point diagram (VPD) in combination with a color-magnitude diagram (CMD).
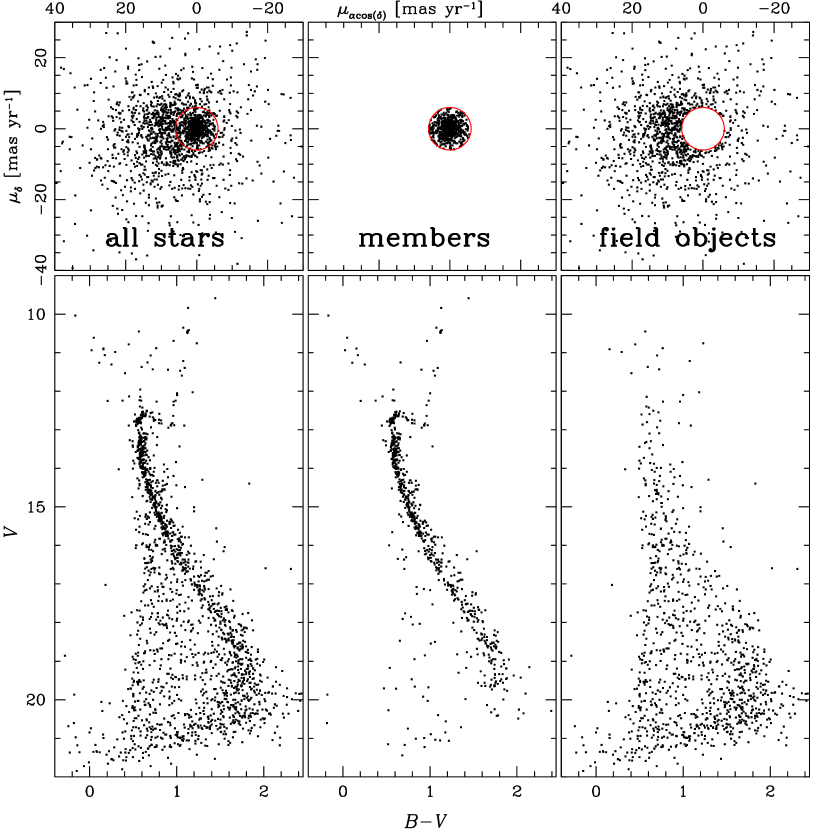
For stars with photometry, in Fig. 4 we show the vector-point diagram (top panels), and the CMDs in the plane (bottom panels). In the left panels there is the whole sample of stars; the middle panels display what we consider to be probable cluster members; the right panels show predominantly the field stars.
In vector-point diagrams around the cluster centroid we draw a circle with the radius of 6 mas yr-1. Provisionally, we define as cluster members all points in VPD within this circle. The chosen radius is a compromise between loosing cluster members with poor proper motions and including field stars sharing the cluster’s mean proper motion. Even this crude division into cluster and field stars is demonstrating the power of proper motions derived in this study. A formal determination of membership probability is given in Sect. 4.
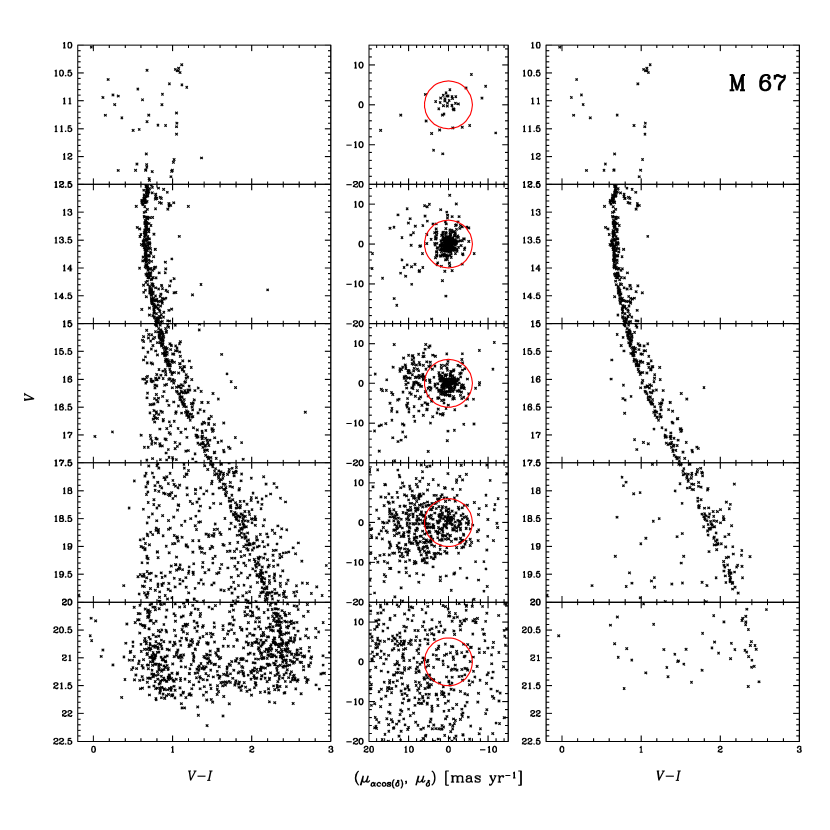
As expected, the fainter stars have less well measured proper motions because of rapidly decreasing signal-to-noise ratio. Figure 5 illustrates this fact in the plane binned along the magnitude axis. We note that an acceptable membership is established even for saturated stars at 12.5. Note that photometry for bright stars is derived only from short exposures and then adjusted via the zero-point correction to photometry from long exposures.
The separation between the cluster members and field stars is not as obvious as it is for the globular clusters presented in Paper I. In the case of M 67 the distributions of cluster and field proper motions have a substantial overlap, separated only by 8 mas y-1. Therefore it is not surprising that at the faint magnitudes where proper motion errors are large, the separation between the cluster and field is poor.
Finally, we note that our field star CMD (right lower panel in Fig. 4) shows no trace of the anomalous clump detected by Balaguer-Núñez et al. (2007) in in the and color-magnitudes diagrams . Perhaps, this is not surprising because these authors cover a larger area around M 67 than our study and, according to Balaguer-Núñez et al., the stars in this clump mysteriously avoid the central parts of M 67.
4 Determination of Membership Probability
The vector-point diagram (Fig. 4) of our proper motions clearly shows two populations: a tight clump at 0.0 mas yr-1 mainly representing the cluster stars and an overlapping broad distribution of field stars. Vasilevskis et al. (1958) were the first one to formulate the proper-motion membership probability as
| (1) |
where is the distribution of cluster stars and – the distribution of field stars in the vector-point diagram. Usually, these distributions are represented by elliptical normal frequency distributions, i.e., Gaussians, although in some special cases the field star distribution can locally be adopted as non-Gaussian (Jones 1997, Platais et al. 2001). There are numerous papers discussing various aspects of calculating the parameters of these distributions and membership probabilities in general, e.g., Jones (1997), Girard et al. 1989, Balaguer-Núñez et al. (2007) and references therein. For membership probability calculations, we have chosen the local sample method, which is equally reliable in rich open clusters such as NGC 188 (Platais et al. 2003) as well as in sparse clusters like IC 2391 (Platais et al. 2007). In this method, a local sample of stars is selected to represent the properties of a target star as close as possible. It assures a smooth transition of calculated membership probabilities as a function of magnitude and also accounts for the changes in the magnitude dependent cluster-to-field star ratio. It has been recognized that a star’s brightness and spatial location are the two critical parameters to be considered in the membership probability calculations (Girard et al. 1989, Jones 1997). To counter the effect of a changing cluster-to-field star ratio, we chose a sliding 2.5-mag-wide magnitude bin centered onto the target. The exception are the extremes of the magnitude range where a magnitude bin is fixed at 2.5 mag. The spatial distribution was ignored due to the relatively small size of our field () with respect to the radial extent of M 67 out to at least one degree (Sanders 1977). Another component of our approach is to parameterize the magnitude dependence of proper motion dispersions for cluster and field stars. That can be done using photometrically selected samples of cluster and field stars (Fig. 5). Finally, the center of proper-motion distribution for cluster stars was adopted at 0.0 mas yr-1 but for field stars it was estimated from the photometrically selected field stars and also parameterized as a function of magnitude. It should be noted that in -coordinate the center of field star distribution in the VPD is at mas yr-1 which is significantly larger than that reported by Girard et al. (1989). We made no effort to account for the individual proper-motion uncertainties other than the parameterizations mentioned above. Poorly measured proper motions, i.e, with uncertainties exceeding 10 mas yr-1 are insufficient for reliable membership determination in M 67. Nevertheless, we kept these stars for the sake of demonstration the achieved accuracies over the entire magnitude range.
Calculation of the two remaining parameters (heights of Gaussian peaks) needed to fully characterize the cluster and field distributions in the VPD is straightforward (Platais et al. 2003). We note that the distribution of field stars appears to be nearly circular that further simplifies the calculations. The distribution of membership probabilities (Fig. 6) in effect reflects the degree of reliability of our proper motions. Thus, the separation between the cluster and field is convincing for . In the range the decreasing maximum indicates a steadily growing contamination by field stars. The unexpected rise of maximum at is an artifact caused by a nearly total blending of both cluster and field proper motion distributions. In other words, in this magnitude range the accuracy of proper motions is inadequate for reliable calculations of membership probability.

5 Comparison with existing photometric data
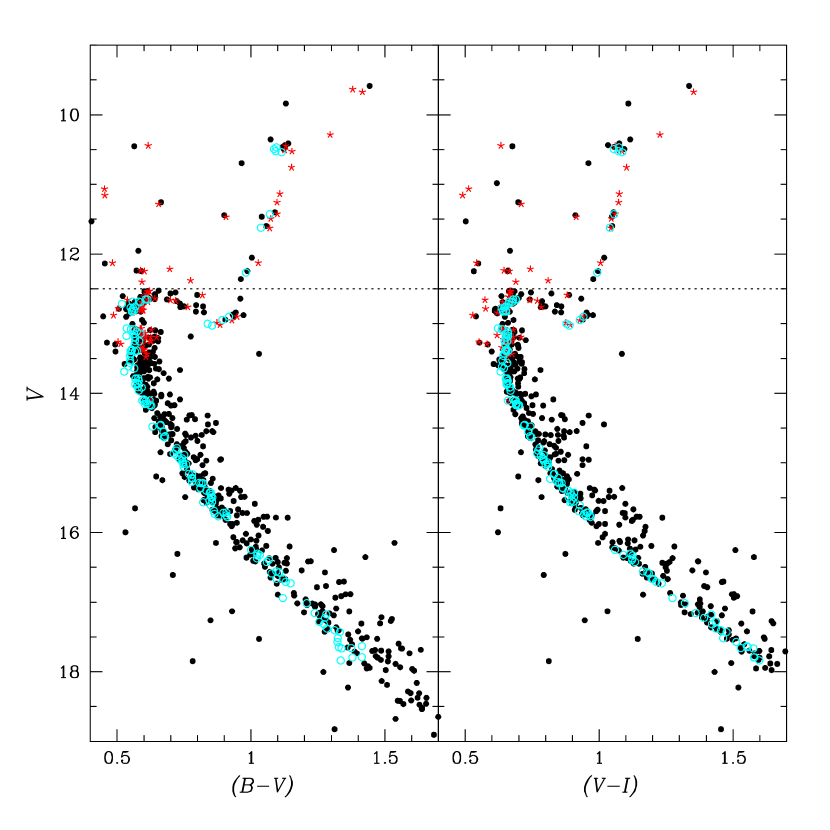
In Figure 7, we show color-magnitude diagram in the [], and [] planes for the stars of our sample which have a membership probability (see Sect. 4 for details). The saturation level of deep exposures is indicated by the dotted line. The stars from the secondary standard catalogue by Stetson (2000, 2005) are over-plotted as red asterisks. The cyan color-coded circles show the location of the Sandquist (2004) single stars. As expected, the location of main sequence from our photometry and that by Sandquist is nearly identical because our photometry was calibrated using Sandquist’s data. The upper main sequence and giant branch in [] have some small offsets, if different sources are considered. In part, that can be explained by retaining single stars only in the Sandquist photometry.
In Fig. 8 we show the photometric residuals as a function of magnitude and color for the common stars between Sandquist and our data. Sandquist (2004) presented extensive comparisons with other photometric data from the literature, in particular, with Montgomery et al. (1993). We refer the reader to this study for detailed comparisons. The referee suggested to make a request for the Ben Taylor’s new improved photometry and perform a direct comparison with this new catalogue. Ben Taylor kindly released his photmetry to us and this comparison is shown in Fig. 9, in the sense ‘ours-Taylor’ photometry. If there are any offsets, then certainly less than 0.01 mag in both, magnitude and color.


6 Comparison with theoretical isochrones
CMDs of Galactic open clusters have long been used as a tests of stellar models for intermediate-mass stars. The most important issue is related to the long-standing problem of the real extension of the convective core during the central H-burning stage. How much larger the convective core extension is with respect to the canonical prediction provided by the classical Schwarzschild criterion? [i.e. which is the amount of convective core overshooting, see e.g. Sandquist (2004), Cassisi (2002), and references therein].
Open cluster studies have shown that stellar models must allow for the occurrence of convective core overshooting in order to provide a satisfactory match to the observed CMDs (see Kalirai et al. 2001 and references therein). On the other hand, a still unsettled issue is related to how convective core overshooting has to decrease in real stars when the size of the canonical convective core decreases with the decreasing total stellar mass (e.g., Woo & Demarque 2001). In the majority of Galactic open clusters this is not an important problem. However, an age difference exceeding Gyr with respect to the age of M 67 is sufficient for stars to enter the evolutionary phase with a very extended convective core, even encroaching the mass range normally having a radiative core. In the case of M 67, the mass of stars at the main sequence turnoff (TO) is 1.2M⊙, which is in the critical mass interval where the amount of overshooting is decreasing with mass. Therefore, M 67 is crucial for exploring the efficiency of convective core overshoot in stars whose mass is large enough to have a convective core but not so large to allow the presence of a quite extended convective core.
For this reason, M 67 has been the subject of many detailed studies such as those recently performed by Sandquist (2004), Vandenberg & Stetson (2004), and Vandenberg et al. (2007). The work of VandenBerg & Stetson (2004) was specifically devoted to constraint the efficiency of convective core overshooting in stars whose mass is similar to that of the stars currently at the TO of M 67. Their main conclusion –also supported by the results shown by Pietrinferni et al. (2004)– is that the extension of overshooting region has to be very small but not zero for masses of about , at least for solar metallicity.
A detailed discussion of this issue is clearly out of the scope of this paper. Nonetheless, a comparison of our observational data for M 67 and the theoretical isochrones available in various independent libraries of stellar models should provide further insights about the capability of commonly-used sets of stellar models in reproducing empirical constraints by CMD of the old Galactic open clusters. For this purpose, we adopted the following sets of theoretical tracks: the BaSTI models provided by Pietrinferni et al. (2004, see also Cordier et al. 2007); the Padova models published by Girardi et al. (2000); the Yonsei-Yale isochrones provided by Yi et al. (2001) in their second release; and the Victoria-Regina models published by VandenBerg, Bergbusch & Dowler (2006). In the case of the Yonsei-Yale isochrones, we apply their set of isochrones transformed into the observational plane using the -to-color transformation tables provided by Green, Demarque & King (1987).
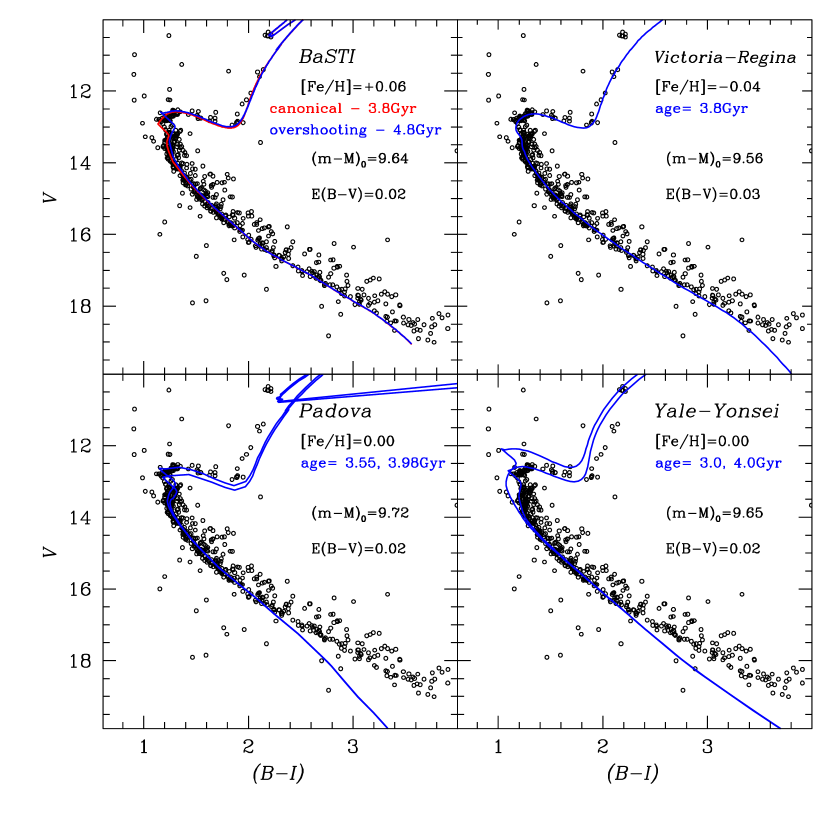
The comparison among various fits of theoretical isochrones to observational CMDs is shown in Fig. 10. Before discussing this figure, it is necessary to briefly review the best estimates of metallicity, reddening and distance of M 67. The metallicity of M 67 is essentially the solar or maybe slightly lower (Taylor 2007). This result is well-established on the basis of both high- (Tautvaišiene et al. 2000) and low-resolution spectroscopy (Friel & Janes 1993). The existing estimates of interstellar extinction in the direction of M 67 have been recently re-analyzed by Taylor (2007). The most likely mean value of derived by Taylor is slightly larger than the value suggested by Schlegel et al. (1998) and those provided by the fits between theoretical isochrones and empirical data (e.g, VandenBerg & Clem 2003). Given the intrinsic uncertainties in calibration of , the true reddening of M 67 could be anywhere between 0.02 and 0.04 mag.
As for the distance to M 67, Percival & Salaris (2003) measured the distance modulus at , adopting and [Fe/H] . Their measurement has been obtained by applying the MS-fitting technique to the CMD from Montgomery et al. (1993) data by using a sample of local G and K dwarfs with accurate Hipparcos parallaxes and a near-solar metallicity. The Percival & Salaris’s (2003) estimate was subsequently confirmed by Sandquist (2004), who obtained the same distance modulus using new photometric data.
The comparison shown in Fig. 10 is quite informative: within the errors the BaSTI (Pietrinferni et al. 2004) isochrones with [Fe/H] 0.06 reproduce nicely the CMD with and , in agreement with previous determinations. Both isochrones with and without convective core overshoot are shown. The adopted metallicity appears to be the upper limit of any existing estimate of [Fe/H] in M 67. The MS and the red giant branch appear to match both, a canonical and the isochrone with overshoot. We note that the brightness and color of He-burning clump stars are very-well reproduced by the BaSTI isochrones for the adopted reddening and distance modulus.
The best fit of main sequence using the Victoria-Regina isochrones (VandenBerg et al. 2006) can be achieved with a distance modulus equal to 9.56 mag and a reddening of 0.03. The Victoria-Regina isochrones do not follow through the phase of core He burning, hence we cannot test a match to the red clump stars.
Sandquist (2004) has shown that a number of isochrones from the literature are unable to fit the location of MS at 15.5. This result is confirmed by a fit of Padova (Girardi et al. 2000) and Yonsei-Yale isochrones (Yi et al. 2001) to our data shown in Fig. 10. As suggested by Sandquist (2004) the available -color transformations are poor for main sequence stars at 5000 K. This deficiency is corrected for Victoria-Regina isochrones by applying semi-empirical color transformations (VandenBerg & Clem 2003). We note that in the same range the theoretical isochrones do not follow well the MS stars in metal-poor globular clusters as well (Bedin et al. 2001). This can largely be attributed to the same problem in the adopted -color relations.
The main result of our isochrone fit to the new color-magnitude diagram for M 67 is the confirmation of a small convective core overshoot required to achieve a close match to the features near the main sequence turnoff region. This result is in very good agreement with the earlier results by Sandquist (2004) and VandenBerg & Stetson (2004). We wish to note that in this study we have performed comparisons between the theory and observations by employing four independent and updated libraries of stellar models.
7 The Catalogue
The catalogue is available electronically at Astronomy & Astrophysic (or also under request to the authors).
Description of the catalogue: column (1) contains the running number; columns (2) and (3) give the J2000 equatorial coordinates in decimal degrees for the epoch J2000.13, while columns (4) and (5) provide the pixel coordinates and in a distortion-corrected reference frame. Columns (6) to (11) give photometric data, i.e., magnitudes and their errors. If photometry in a specific band is not available, a flag equal to 99.999 is set for the magnitude, and 0.999 – for the error. Next four columns (12)-(15), give relative proper motions and their standard errors. Column (16) gives the proper-motion membership probability . The last two columns (17) and (18) give radial velocity (VR) and its error, if available, otherwise the table reports 999.999.
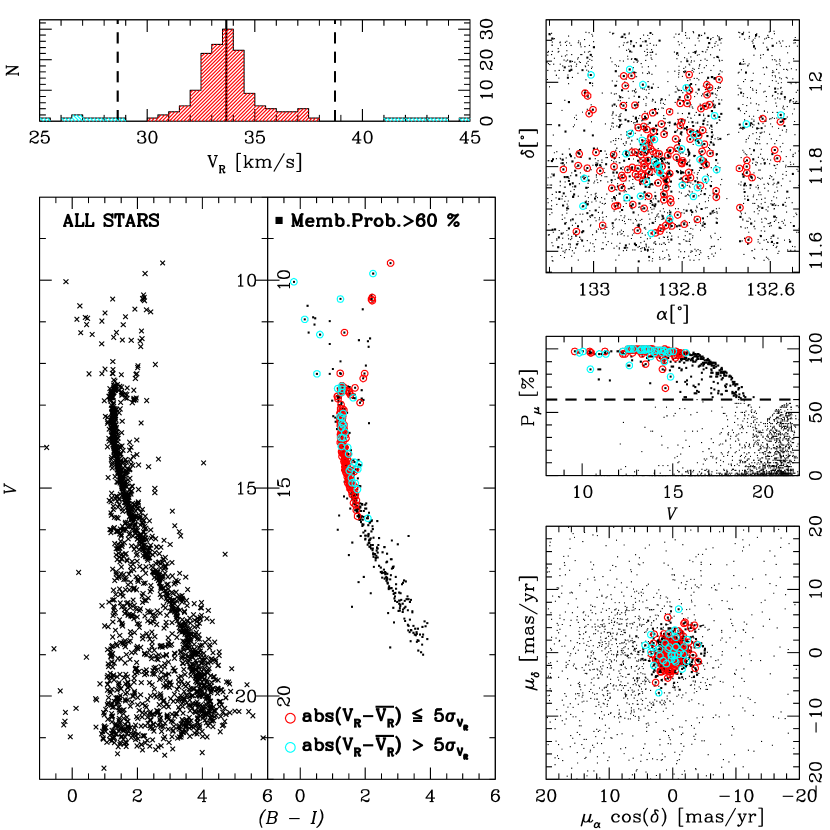
Figure 11 shows a summary of the basic properties of stars in the catalogue. Here we plotted a histogram of radial velocities, the spatial distribution of all stars, color-magnitude diagrams, the distribution of membership probabilities, and a vector-point diagram. They provide additional information over similar plots in the previous figures.
| ID | |||||||||||||||||
| (1) | (2) | (3) | (4) | (5) | (6) | (7) | (8) | (9) | (10) | (11) | (12) | (13) | (14) | (15) | (16) | (17) | (18) |
| [#] | [ ∘ ] | [ ∘ ] | [pixel] | [pixel] | [mag] | [mag] | [mag] | [mag] | [mag] | [mag] | [mas/yr] | [mas/yr] | [mas/yr] | [mas/yr] | [] | [km/s] | [km/s] |
| 1 | 132.897815 | 11.575597 | 3524.156 | -246.966 | 99.999 | 0.999 | 16.064 | 0.009 | 99.999 | 0.999 | 1.73 | 3.51 | 1.73 | 1.25 | 95 | 34.251 | 0.116 |
| 2 | 132.867489 | 11.576494 | 3973.470 | -233.047 | 99.999 | 0.999 | 20.236 | 0.040 | 99.999 | 0.999 | 0.06 | 3.21 | -1.25 | 3.57 | 39 | 999.999 | 999.999 |
| 3 | 133.092502 | 11.576703 | 639.898 | -230.841 | 99.999 | 0.999 | 21.698 | 0.118 | 99.999 | 0.999 | 13.86 | 36.24 | -5.12 | 13.92 | 29 | 999.999 | 999.999 |
| 4 | 132.874183 | 11.577474 | 3874.268 | -218.312 | 99.999 | 0.999 | 18.996 | 0.013 | 99.999 | 0.999 | 7.14 | 6.31 | -7.26 | 5.00 | 2 | 999.999 | 999.999 |
| 5 | 133.093782 | 11.577612 | 620.936 | -217.087 | 99.999 | 0.999 | 21.452 | 0.260 | 99.999 | 0.999 | 22.37 | 7.79 | -22.55 | 13.39 | 2 | 999.999 | 999.999 |
| 6 | 132.773239 | 11.578593 | 5369.865 | -199.708 | 99.999 | 0.999 | 17.234 | 0.010 | 99.999 | 0.999 | 25.23 | 6.43 | -29.33 | 28.44 | 0 | 999.999 | 999.999 |
| 7 | 132.614021 | 11.578638 | 7728.562 | -194.667 | 99.999 | 0.999 | 18.647 | 0.008 | 99.999 | 0.999 | 5.41 | 0.24 | -2.62 | 2.38 | 28 | 999.999 | 999.999 |
| 8 | 133.035261 | 11.579114 | 1487.807 | -194.539 | 99.999 | 0.999 | 20.867 | 0.046 | 99.999 | 0.999 | 15.05 | 24.16 | 5.71 | 2.32 | 7 | 999.999 | 999.999 |
| 9 | 132.949617 | 11.579316 | 2756.606 | -191.207 | 99.999 | 0.999 | 15.411 | 0.009 | 99.999 | 0.999 | 18.39 | 1.25 | 2.32 | 5.06 | 0 | 90.264 | 0.060 |
| 10 | 132.829375 | 11.579519 | 4538.135 | -186.755 | 99.999 | 0.999 | 19.515 | 0.042 | 99.999 | 0.999 | 6.31 | 6.19 | -13.15 | 10.00 | 0 | 999.999 | 999.999 |
| … | … | … | … | … | … | … | … | … | … | … | … | … | … | … | … | … | … |
8 Conclusions
In this paper, we applied the techniques developed by Anderson et al. (2006, Paper I) to a cornerstone open cluster M 67. We demonstrate that the CCD observations taken just four years apart can provide accurate proper motions, aiding to decontaminate the cluster CMD down to 20. An open issue with the open clusters is the intrinsically low spatial density of cluster members, especially in the outer parts of clusters, that makes it difficult to apply rigorously the local-transformation approach. We believed that with a geometrically stable CCD mosaic (the m apparently is not such) it is possible to use the global plate solutions for astrometry and avoid the problem of inadequate local reference frame.
The high precision of our astrometry and photometry once again underscores the importance of accurate representation of PSF across the entire field-of-view, exemplified by the concept of empirical PSF (Paper I).
Our new photometry confirm that in M 67 the convective core overshoot should be small, as already pointed out by Sandquist (2004), and Vandenberg & Stetson (2004).
A substantial addition to the existing data sets are our proper motions at 16, by up to 5 magnitudes deeper than the published proper motion catalogues. High-precision radial velocities for 211 stars down to are further helping to establish a list of bona fide cluster members in M 67. One of the goals of this paper is to share the new data with the astronomical community prior to comprehensive analysis and finalizing of cluster membership at faint magnitudes.
Acknowledgements.
R. K. S. Yadav is grateful to University of Padova for the Grant that made possible this Indo-Italian collaboration. I. Platais gratefully acknowledges support from the National Science Foundation through grant AST 04-06689 to Johns Hopkins University. We thank the anonymous referee for careful reading and useful suggestions. We also thank Ben Taylor for providing us with their new unpublished catalogue in electronic format.References
- (1) Anderson, J., Bedin, L. R., Piotto, G., Yadav, R. K. S., Bellini, A. 2006, A&A, 454, 1029, [Paper I]
- (2) Balaguer-Núñez, L., Galadí-Enríquez, D., & Jordi, C. 2007, A&A, 470, 585
- (3) Baumgart H., Dettbarn C., Wielen R., 2000, A&AS, 146, 251
- (4) Bedin, L. R., Anderson, J., King, I. R., Piotto, G., 2001, ApJ, 560, L75
- (5) Biazzo, K., Pasquini, L., Girardi, L., et al. 2007, A&A, 475, 981
- (6) Blecha, A., Cayatte, V., North, P., Royer, F., & Simond, G. 2000, Proc. SPIE, 4008, 467
- (7) Cassisi, S., Salaris, M., & Bono, G. 2002, ApJ, 565, 1231
- (8) Cordier, D., Pietrinferni, A., Cassisi, S., & Salaris, M. 2007, AJ, 133, 468
- (9) Dupree, A. K., Whitney, B. A., & Pasquini, L. 1999, ApJ, 520, 751
- (10) Friel, E. D., & Janes, K. A. 1993, A&A, 267, 75
- (11) Gilliland, R. L., Brown, T. M., Duncan, D. K., et al. 1991, AJ, 101, 541
- (12) Girard, T. M., Grundy, W. M., López, C. E., van Altena W. F., 1989, AJ, 98, 227
- (13) Girardi, L., Bressan, A., Bertelli, G., Chiosi, C. 2000, A&AS, 141, 371
- (14) Glushkova, E. V., & Rastorguev, A. S. 1990, AZh, 34, 674
- (15) Green, E. M., Demarque, P., & King, C. R. 1987, The Revised Yale Isochrones and Luminosity Functions (New Haven: Yale Univ. Obs.)
- (16) Jones, B. F. 1997, Mem. SAI, 68, 833
- (17) Jones, B. F., Fischer, D., & Soderblom, D. R. 1999, AJ, 117, 330
- (18) Kalirai, J. S., Richer, H. B., Fahlman, G. G., et al. 2001, AJ, 122, 266
- (19) Landolt, A. U. 1992, AJ, 104, 340
- (20) Lattanzi, M. G. 1993, in Workshop on Databases for Galactic Structure, ed. A. G. Davis Philip, B. Hauck, & A. R. Upgren, 173
- (21) Mathieu, R. D., Latham, D. W., Griffin, R. F., Gunn J. E. 1986, AJ, 92, 1100
- (22) Mathieu, R. D., Latham, D. W., & Milone, A. E. 1997, in ASP Conf. Ser. 130: The Third Pacific Rim Conference on Recent Development of Binary Star Research, ed. K.-C. Leung, 113
- (23) Mathieu, R. D., van den Berg, M., Torres, G., et al. 2003, AJ, 125, 246
- (24) Melo, C. H. F., Pasquini, L., & De Medeiros, J. R. 2001, A&A, 375, 851
- Momany et al. (2001) Momany, Y., et al. 2001, A&A, 379, 436
- (26) Montgomery, K. A., Marschall, L. A., & Janes, K. A., 1993, AJ, 106, 181
- (27) Pace, G., & Pasquini, L. 2004, A&A, 426, 1021
- (28) Pasquini, L., Belloni, T., & Abbott, T. M. C. 1994, A&A, 290, L17
- (29) Pasquini, L., Randich, S., Pallavicini, R. 1997, A&A, 325, 535
- (30) Pasquini, L., & Belloni, T., 1998, A&A, 336, 902
- (31) Percival, S. M. & Salaris, M. 2003, MNRAS, 343 539
- (32) Pietrinferni, A., Cassisi, S., Salaris, M., Castelli, F. 2004, ApJ, 612, 168
- (33) Platais, I., Kozhurina-Platais, V., Barnes, S., et al. 2001, AJ, 122, 1486
- (34) Platais, I., Kozhurina-Platais, V., Mathieu, R. D., et al. 2003, AJ, 126, 2922
- (35) Platais, I., Melo, C., Mermilliod, J.-C., et al. 2007, A&A, 461, 509
- (36) Randich, S., Sestito, P., Primas, F., Pallavicini, R., & Pasquini, L. 2006, A&A, 450, 557
- (37) Randich, S., Primas, F., Pasquini, L., Sestito, P., & Pallavicini, R. 2007, A&A, 469, 163
- (38) Richer, H. B., Fahlman, G. G., Rosvick, J., & Ibata, R. 1998, 504, L91
- (39) Sanders, W. L. 1977, A&AS, 27, 89
- (40) Sandquist, E. L., 2004, MNRAS, 347, 101
- (41) Schlegel, D. J., Finkbeiner, D. P., Davis, M. 1998, 500, 525
- (42) Shetrone, M. D., & Sandquist, E. L. 2000, AJ, 120, 1913
- (43) Stello, D., Bruntt, H., Kjeldsen, H., et al. 2007, MNRAS, 377, 584
- (44) Stetson, P. B., 2000 PASP 112, 925.
- (45) Stetson, P. B., 2005 PASP 117, 563
- (46) Tautvaišiene, G., Edvardsson, B., Tuominen, I., & Ilyin, I. 2000, A&A, 360, 499
- (47) Taylor, B.J. 2007, AJ, 133, 370
- (48) Taylor, B. J., Joner, M. D., & Jeffery, E. J. 2008, ApJS, 176 (in press).
- (49) Vasilevskis, S., Klemola, A. & Preston, G., 1958, AJ, 63, 387
- (50) VandenBerg, D. A., & Clem, J. L. 2003, AJ, 126, 778
- (51) VandenBerg, D.A., Stetson, P.B. 2004, PASP, 116, 997
- (52) VandenBerg, D. A., Bergbusch, P. A., & Dowler, P. D. 2006, ApJS, 162, 375
- (53) VandenbenBerg, D.A., Gustafsson, B., Edvardsson, B., Eriksson, K., & Ferguson, J. 2007, ApJL, 666, L105
- (54) van den Berg, M., Verbunt, F., Mathieu, R. D. 1999, A&A, 347, 866
- (55) Woo, J.-H., & Demarque, P. 2001, AJ, 122, 1602
- (56) Yi, S., Demarque, P., Kim, Y.-C., et al. 2001, ApJS, 136, 417
- (57) Zacharias, N., Urban, S. E., Zacharias, M. I., et al. 2004, AJ, 127, 3043
- (58) Zhao, J. L., Tian, K. P., Pan, R. S., He, Y. P., & Shi, H. M. 1993, A&AS, 100, 243