The evolution of star clusters: The resolved-star approach
Abstract
We present the first results of a new technique to detect, locate, and characterize young dissolving star clusters. Using Hubble Space Telescope/Advanced Camera for Surveys archival images of the nearby galaxy IC2574, we performed stellar PSF photometry and selected the most massive stars as our first test sample. We used a group-finding algorithm on the selected massive stars to find cluster candidates. We then plot the color-magnitude diagrams for each group, and use stellar evolutionary models to estimate their age. So far, we found 79 groups with ages of up to about 100 Myr, displaying various sizes and densities.
1 Introduction
Star clusters are fundamental building blocks of galaxies, since they are the birth places of most stars (Lada & Lada, 2003). Despite tremendous efforts to study their properties, the literature is relatively scarce when it comes to describing observationally their evolutionary sequence, and particularly the latest stages of disruption and dissolution. The reason for this is simple: because of their low surface brightness, they are very difficult to distinguish from the main stellar background of their host galaxy. However, to better understand the evolution of stellar clusters from birth to death, we need to find a way to observe them even in their latest stages.
Recent studies suggest that the dissolution and disruption of star clusters can happen at very young ages (e.g. Fall et al., 2005; Pellerin et al., 2007). Their work suggests that ‘infant mortality’ of star clusters might be responsible for the loss of 90% of the star clusters within the first 10 Myr of their life. Infant mortality of star clusters occurs when a cluster loses a significant fraction of its gaseous mass during the supernovae explosion phase (Lada & Lada, 2003; Bastian & Goodwin, 2006), leaving the cluster gravitationally unbound. Following those studies, young stars can be used to study dissolving clusters, because cluster dissolution seems to commonly happen at young ages. Also, massive stars are relatively easy to observe and distinguish from the main stellar background of the host galaxy due to their brightness and color. Our idea here is to use the individual stellar properties to find groups of stars, including the systems that are very dispersed and difficult to observed by means of traditional integrated photometric techniques.
In this contribution, we present the first results of a new approach to detect, locate, and characterize young dissolving star clusters using the properties of resolved massive stars. In the next section we describe the data and the details of the photometry. In Section 3 we explain the technique used to find groups of stars. The first results are presented in Section 4, including concrete examples of clusters found in the nearby galaxy IC2574. Note that the term ‘star cluster’ will be use here to describe a wide range of stellar groups presumably born together at approximatively the same time, and will include gravitationally unbound systems as well as those very dispersed. It may include associations, OB groups and open clusters.
2 Hubble Space Telescope/Advanced Camera for Surveys data and PSF photometry
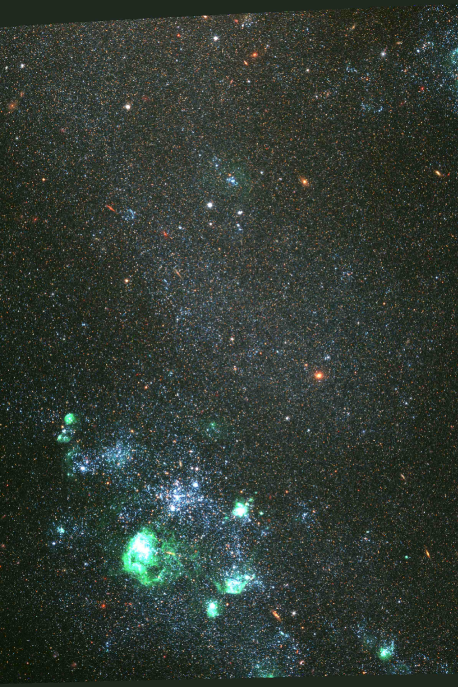
To test our new approach to find dissolving star clusters, we need a nearby galaxy for which the stellar content is spatially resolved. Therefore, we used Cycle 12 archival data of the local galaxy IC2574 observed with the Hubble Space Telescope (HST) using the Advanced Camera for Surveys (ACS) in the F435W, F555W, and F814W filters (see Fig. 1). IC2574 is a spiral galaxy located at 4.02 Mpc (Karachentseva et al., 2003), which results in an ACS resolution limit of 2 pc, so that we are therefore capable of resolving individual stars. The ACS field covers the southern half of the visible galaxy, but excludes the nuclear region. Fig. 1 shows important star-forming regions, which are mainly seen in two complexes and associated with nebular emission. The data were reduced with the STScI calibration pipeline, which includes treatment for geometric correction, cosmic rays and drizzling.
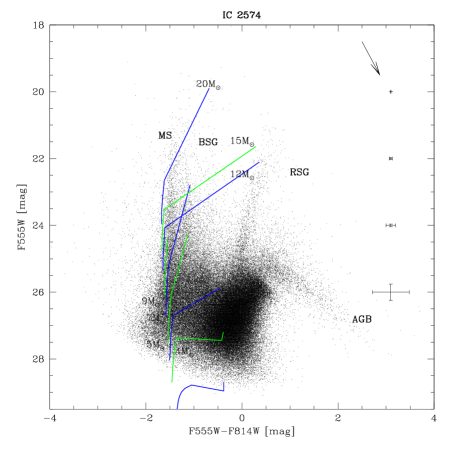
We needed to perform point-spread function (PSF) photometry on each image because of the crowding. We used the iraf/daophot package and about 100 unsaturated bright stars to create a PSF model with an average FWHM of 2 pc. We used the ACS photometric zero points of Sirianni et al. (2005) in the ST system. We applied a homogeneous foreground Galactic extinction, mag (Schlegel et al. 1998) as well as aperture corrections. The 50% completeness levels are estimated at 27.7, 26.8, and 28.7 mag for the F435W, F555W, and F814W filters, respectively. A detailed color-magnitude diagram (CMD) of IC2574 is presented in Fig. 2.
3 The resolved-star approach
The main idea of the resolved-star approach is to use individual stars to recreate the stellar clusters, even those that do not contrast well with respect to the stellar background. The first step of the method is, therefore, to obtain the photometric information on the individual stars contained within a relatively large field (1 kpc) of a galaxy, i.e., IC2574 in our test case. The large field is required to make sure that we detect the most extended clusters. For the reasons mentioned in Section 1, we selected the massive stars on the main sequence (i.e., mag) and brighter than 25.0 mag in the F555W filter (see Fig. 2). We did not use fainter stars to avoid excessive photometric uncertainties, and also to make sure that the stars contrast well with respect to the stellar background of the host galaxy.
The second step, and the key to this approach, is the use of a group-finding algorithm to find groups of stars within the selected sample of massive stars. We chose the ‘HOP’ algorithm (Eisenstein & Hut, 1998), a clustering algorithm traditionally used in cosmology. HOP is a sophisticated version of friends-of-friends algorithms; it is based on the spatial density of stars instead of the distance between stars. In other words, the algorithm ’hops’ each particle (or star) to its neighbor having the highest density, instead of the nearest neighbor. It also allows us to specify useful parameters such as a density value to be used to separate groups, a maximum density value for a group to be viable and not merged, and the minimum density value for a particle to be member of a group. These parameters basically allow us to find groups within groups.
Because there are several free parameters involved in HOP, the algorithm gives multiple solutions. Consequently, we considered that a group found with HOP was a viable stellar group when the same group was found using multiple sets of parameters.
The third step is to study the characteristics of the stellar population of the stellar group. Since we selected only the most massive stars to run the clustering algorithm, studying only the stars in the HOP group would obviously lead to an incomplete result, because of the lack of the less massive stars and of evolved stars such as the red supergiants.
Therefore, for each group found with HOP, we go back to the ACS images and create a region around the HOP group that includes all of the detected stars, to estimate the size of the group. The size of the region is defined by the stars contained within a radius, , around each massive star used to run HOP, where is a fraction (from 10% to 90%) of the distance between the two most distant stars of the given HOP group. This simple technique has two advantages. First, it keeps the information on the shape of the HOP group. Secondly, it allows us to find how extended the group is by comparing the CMD of the group for various values of . For each increasing step of , stars are added to the group. When the stars added to the group do no longer contribute to the brightest regions of the color-magnitude diagram of the group, the added stars are considered part of the stellar background, and the size of the group is defined. Ultimately, we compare the CMD diagram to Padova isochrones (Girardi, 2006) for each group. Despite the fact that some groups can have a relatively small number of stars, an estimate of the age and mass can be obtained for each group. A few concrete examples of the technique are given in the next section.
4 Cluster candidates
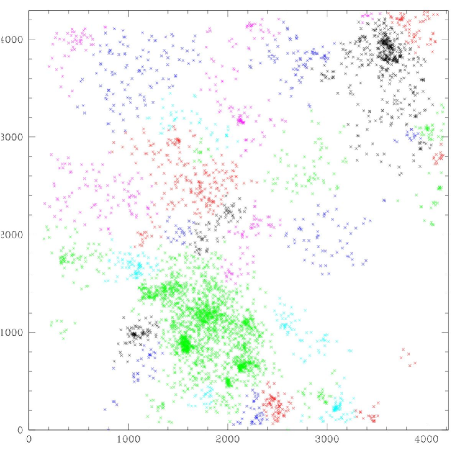
To test our new approach, we applied it to the stars observed in the HST/ACS field of IC2574. As expected, the HOP algorithm gave different sets of outputs. An example of the output is shown in Fig. 3. In this specific case, the parameter values used to find groups produced the merging of the densest groups within the two big complexes, but allowed us to separate the most dispersed groups from each other.
After examining several HOP outputs, we found a large variety of stellar groups outside of the two young complexes. We excluded the two young-complex regions to test our approach on dissolving clusters, which are much more difficult to identify than the young and compact groups of the complexes. In the following, we present a few stellar groups found using HOP, with various physical properties.
4.1 Young and compact cluster with nebular emission
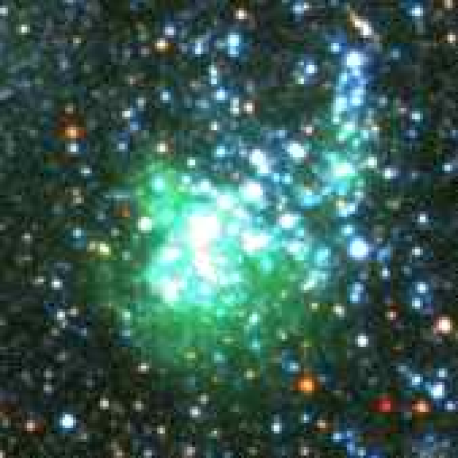
In Fig. 4, we show a small section of Fig. 1 which zooms in on a young and compact group found with HOP. From the nebular emission, it is obvious that the group contains hot OB stars ionizing its surrounding gas.
Fig. 5 shows the CMD of the group, which does not include any evolved star younger than about 100 Myr. Also, bright massive stars are seen on the main sequence, consistent with a 30 Myr isochrone, or younger. Because of the nebular emission, we estimate the age of this group to be less than 10 Myr.
Note the presence of the dashed square in the bottom right-hand corner of the CMD. This represents a region where evolved stars, such as red giants, are found. We assume this region to be filled with background stars, or at least with stars too old to be related to the young stellar group. To be in the dashed area of the CMD, the stars must be as old as 100 Myr, or older. Thus, we can see that the CMD of even young star clusters can be contaminated by a significant number of background stars. In this case, it is likely that a large fraction of the contaminatin stars are not spatially coincident with the cluster, but simply observed in the same field of view.
4.2 Young cluster without nebular emission
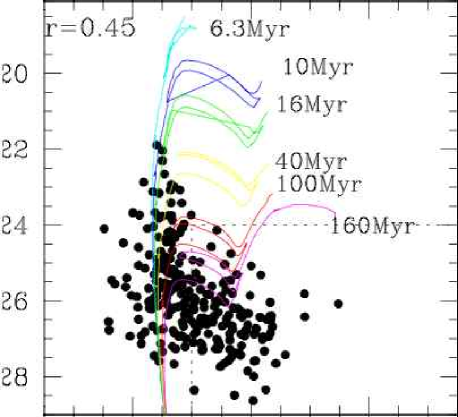
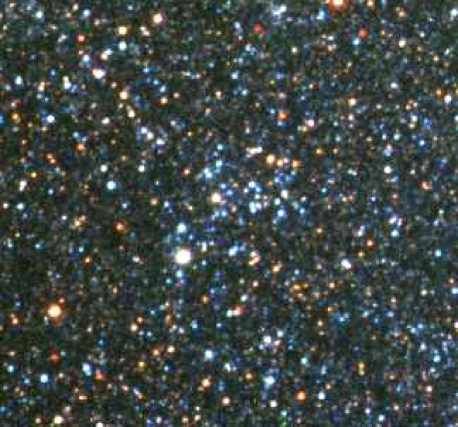
Fig. 6 shows a stellar group of massive stars with no nebular emission. The group is relatively compact, but dispersed enough so that the stars can be resolved easily using PSF photometry. Note that the cluster is about twice the size of the previous cluster (Section 4.1). The CMD of the group, displayed in Fig. 7, shows several stars that are well fitted by the 40 Myr isochrone. However, one object is clearly brighter, and would be fitted much better by younger isochrones. One must not forget that we are dealing with smal-number statistics, and that the bright object is possibly a multiple system, or even a peculiar star. It might also be a runaway star from a nearby system. All we can say for sure is that this group of stars is probably about 40 Myr or younger.
4.3 Background contaminated cluster
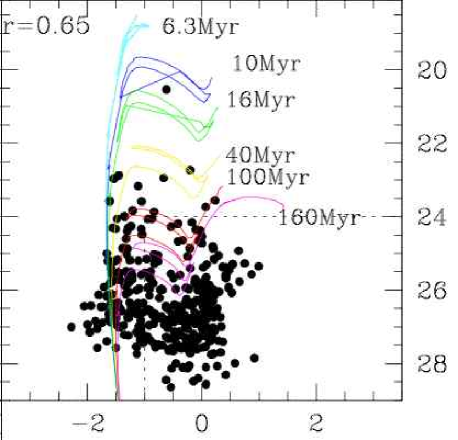
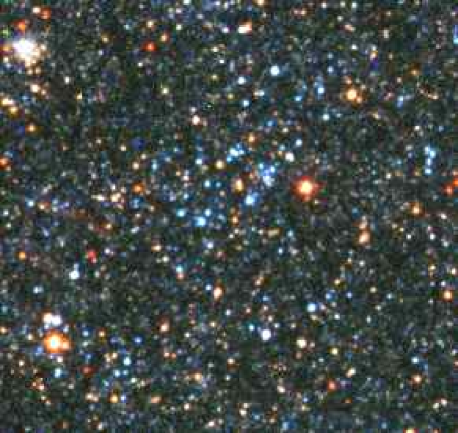
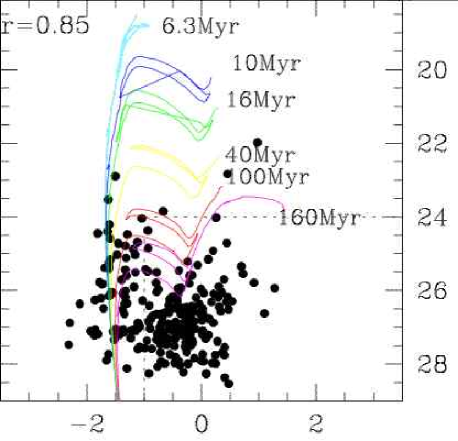
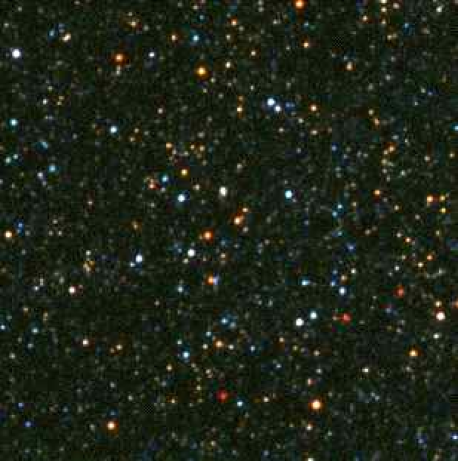
In Fig. 8 we show a stellar group for which the stellar background from the host galaxy becomes important. As one can see by comparing this group (located in the center of the image and identifiable via the numerous blue stars) with the very compact cluster of unresolved stars (in the upper left-hand corner), the group is already fairly spread out within the main body of the galaxy. It is also more spatially spread out than the two previous young groups. The CMD (Fig. 9) clearly shows that the number of stars in the contamination section of the CMD (see Section 4.1) contributes significantly to the total number of stars in the group. According to the Padova isochrones and using the few bright stars found in the group, we estimate the age of the cluster at about 60 Myr.
4.4 Dissolved cluster candidate
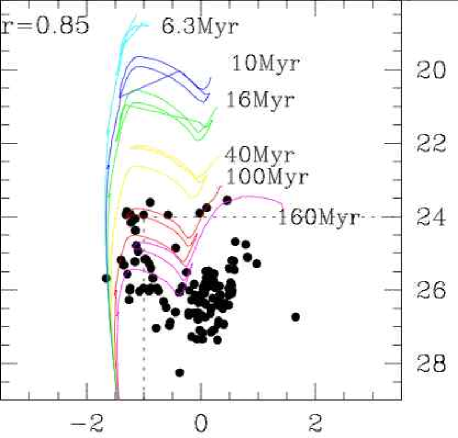
The group shown in Fig. 10 can hardly be called a group. A few massive stars are observed within a pc2 field of view, but it is impossible at this stage to know whether those stars were born together or if they originate from different parent clouds. Its CMD (Fig. 11) shows several stars consistent with an isochrone of 100 Myr. It is, however, interesting to see that the stars on the 100 Myr isochrone are well separated from the groups of red evolved stars seen in the contamination section, which suggests that the group is a good candidate for a dissolved (or nearly dissolved) star cluster. Note that it would not be possible here to find groups much older than 100 Myr, because this corresponds to the magnitude cutoff used to select the massive-star sample for the HOP algorithm.
5 Conclusion and future work
In this contribution we have presented the very first results of a new technique to detect and study groups of stars that are very dispersed and contaminated by the stellar background. The technique uses the photometric data of individual stars and a clustering algorithm to find groups of stars. CMDs are then used to study the physical properties of the groups, such as their age.
We tested our technique on HST/ACS images of the spiral galaxy IC2574. We presented four different examples from among the 79 groups found so far, and estimated their ages to range from 10 Myr to 100 Myr. Of these, 11 groups found in this study are good candidates for dissolving star clusters.
More physical characteristics will be quantified in the future for the clusters found in IC2574, including the size of the groups, their density, shape, masses and compactness. Eventually, more clusters will be found in many other galaxies. Their characteristics will be studied as a function of various properties of the host galaxy, such as the radial location within the host galaxy, the star-formation intensity, the morphological type, and the potential well. Hopefully, this will lead to a better understanding of the evolution of star clusters and the role of the host galaxy in their destruction and dissolution.
Acknowledgements This work was supported by HST grant HST-AR-10968.02A.
References
- Bastian & Goodwin (2006) Bastian, N. & Goodwin, S. P., 2006, MNRAS, 369L, 9
- Eisenstein & Hut (1998) Eisenstein, D. J. & Hut, P. 1998, ApJ, 498, 137
- Fall et al. (2005) Fall, S. M., Chandar, R., & Whitmore, B. C. 2005, ApJ, 631, L136
- Girardi (2006) Girardi 2006, private communication [http://pleiadi.pd.astro.it/]
- Karachentseva et al. (2003) Karachentsev, I. D., Makarov, D. I., Sharina, M. E., Dolphin, A. E., Grebel, E. K., Geisler, D., Guhathakurta, P., Hodge, P. W., Karachentseva, V. E., Sarajedini, A., & Seitzer, P. 2003, A&A, 398, 479
- Lada & Lada (2003) Lada, C. J. & Lada, E. A. 2003, ARA&A, 41, 57
- Pellerin et al. (2007) Pellerin, A., Meyer, M. J., Harris, J., & Calzetti, D. 2007, ApJ, 658, L87
- (8) Schlegel, D. J., Finkbeiner, D. P., & Davis, M. 1998, ApJ, 500, 525
- Sirianni et al. (2005) Sirianni, M., et al. 2005, PASP, 117, 1049