Star Formation Near Photodissociation Regions:
Detection of a Peculiar Protostar Near Ced 20111affiliation: Based on observations obtained with the CSO telescope.
The CSO telescope is operated by the California Institute of Technology under funding
from the NSF, Grant No. AST-0540882. 22affiliation: Observations also obtained with IRAM telescopes,
supported by INSU/CNRS (France), MPG (Germany), and IGN (Spain). 33affiliation: This work is based on observations made with the Spitzer Space Telescope,
which is operated by the Jet Propulsion Laboratory,
California Institute of Technology under a contract with NASA.
Abstract
We present the detection and characterization of a peculiar low–mass protostar (IRAS 22129+7000) located 0.4 pc from Cederblad 201 Photodissociation Region (PDR) and 0.2 pc from the HH450 jet. The cold circumstellar envelope surrounding the object has been mapped through its 1.2 mm dust continuum emission with IRAM–30m/MAMBO. The deeply embedded protostar is clearly detected with Spitzer/MIPS (70 m), IRS (20–35 m) and IRAC (4.5, 5.8, and 8 m) but also in the band (2.15 m). Given the large near– and mid–IR excess in its spectral energy distribution, but large submillimeter-to-bolometric luminosity ratio (2%), IRAS 22129+7000 must be a transition Class 0/I source and/or a multiple stellar system. Targeted observations of several molecular lines from CO, 13CO, C18O, HCO+ and DCO+ have been obtained. The presence of a collimated molecular outflow mapped with the CSO telescope in the CO =3–2 line suggests that the protostar/disk system is still accreting material from its natal envelope. Indeed, optically thick line profiles from high density tracers such as HCO+ =1–0 show a red–shifted–absorption asymmetry reminiscent of inward motions. We construct a preliminary physical model of the circumstellar envelope (including radial density and temperature gradients, velocity field and turbulence) that reproduces the observed line profiles and estimates the ionization fraction. The presence of both mechanical and (non-ionizing) FUV–radiative input makes the region an interesting case to study triggered star formation.
Subject headings:
ISM : individual (IRAS 22129+7000; Ced 201; B175/L1219) — ISM : jets and outflows — stars: formation — stars: pre–main sequence1. Introduction
Low–mass stars (sunlike; M⋆ 8 ) form from the gravitational collapse of dense molecular cores within giant molecular clouds. During the earliest stages of evolution, embryonic protostars are deeply embedded in cold and dusty envelopes of infalling material. In recent years, large millimeter (mm) and submm continuum surveys have been carried out to detect the cold dust emission associated with these early birth-sites of star formation André et al. (1993); Johnstone et al. (2000). During collapse, conservation of angular momentum combined with infall along the magnetic field lines leads to the formation of a rotating protoplanetary disk that drives the accretion process. At the same time, both mass and angular momentum are removed from the system by the onset of jets, collimated flows and the magnetic braking action Bontemps et al. (1996); Cabrit et al. (2007). The resulting molecular outflow starts to erode and sweep up part of the natal envelope, contributing for the clearing of the circumstellar material and the termination of the infall phase Arce & Sargent (2006). The so–called Class 0 sources are deeply embedded protostars at their main accretion phase and represent the earliest type of young stellar objects (YSOs). Observationally they should show: Evidence of a central YSO (as revealed by the presence of a collimated outflow or an internal heating source); Centrally peaked but extended massive envelope (as traced by mm and submm dust continuum emission); High submm ( 350 m) to bolometric luminosity ratio (Lsmm/Lbol 0.5), and a spectral energy distribution (SED) similar to a single graybody at 15-30 K André et al. (2000). On the other hand, Class I sources correspond to the late accretion phase (roughly half of the initial envelope mass is accreted in the Class 0 stage), they don’t satisfy and can easily be detected at near–IR wavelengths (Lada 1999).
The detection of YSOs that do not exactly match the above canonical categories can provide the missing pieces of our current understanding of early disk evolution and early dissipation of the circumstellar envelope. These sources can thus potentially help to address, for example, how and when the velocity field around YSOs changes from infall to rotation dominated, which fraction of the initial mass envelope is dissipated and not accreted onto the star/disk, as well as the timescales for such dissipation Brinch et al. (2007); Jrgensen et al. (2007)
In this paper we present the detection of a low–mass protostar in the Bok globule B175 (L1219) within the Cepheus Flare, a nearby (400 pc) star forming region 85 pc above the galactic plane Kun (1998); Nikolić & Kun (2004). This cloud hosts the enigmatic Cederblad 201 reflection nebula Wolf (1908); Cesarsky et al. (2000), probably the result of a chance encounter with a B9.5V runaway star (BD+69∘1231, Teff 10,000 K), which is moving through the cloud at 12 km s-1 Witt et al. (1987). The star is thus not a only a source of dissociating photons (the FUV radiation field is 200 times the mean interstellar radiation field) but also a source of shocks and turbulence in the region. This interaction enables us to probe matter in a different situation than in classical PDRs in which the distance from the exciting star to the illuminated regions is large and/or in which the star was formed locally. In addition, the extended cloud hosts a Herbig–Haro jet (HH450), and several arsec-scale filaments of the supernova remnant (G110.3+11.3) that are rapidly approaching to the region Bally & Reipurth (2001). The presence of both mechanical (from shocks and outflows) and radiative input (from FUV photons) makes the region an interesting dynamics laboratory to study how star formation is proceeding through the cloud.
| Flux | Telescope | Aperture | |
|---|---|---|---|
| (m) | (Jy) | ||
| 1.25 | †3.20 | 2MASS | 3′′ |
| 1.65 | †3.60 | 2MASS | 3′′ |
| 2.15 | 3.00 | 2MASS | 3′′ |
| 4.5 | 0.17 | Spitzer/IRAC | 12.2′′ |
| 5.8 | 0.38 | Spitzer/IRAC | 12.2′′ |
| 8.0 | 0.31 | Spitzer/IRAC | 12.2′′ |
| 12 | †0.39 | IRAS | 5′ |
| 25 | 1.13 | IRAS | 5′ |
| 60 | 3.46 | IRAS | 5′ |
| 70 | 6.10 | Spitzer/MIPS | 1′ |
| 100 | 16.00 | IRAS | 5′ |
| 200 | 22.00 | KAO | 1′ |
| 1200 | 0.25 | IRAM-30m/MAMBO | 31′′22′′∗ |
Note. — †Upper limit. ∗Source FWHM size given.
2. Observations
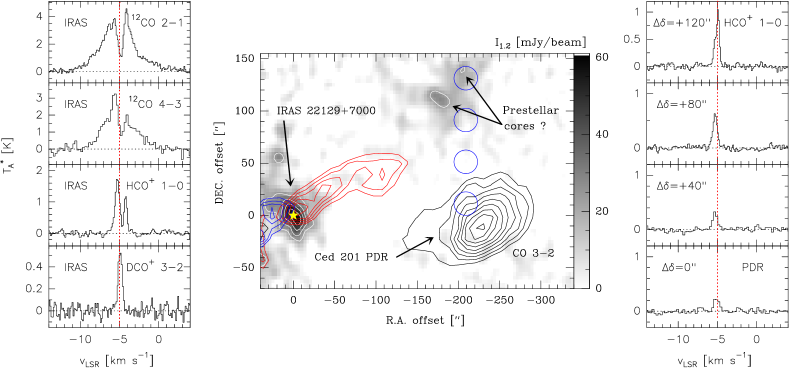
A 1.2 mm continuum emission map of the region was obtained at the IRAM-30m (Pico Veleta, Spain) in March 2005 using the 117–channel MAMBO bolometer array. The angular resolution is 11′′. A fast–mapping mode was used to map the region Teyssier & Sievers (1999). The total integration time was 1 hour, achieving a rms noise of 7 mJy/11′′-beam. Sky noise substraction and data analysis were carried out with the MOPSIC software Zylka (1998). A 3122′′ full-width at half-maximum (FWHM) condensation with a peak intensity of 607 mJy/11′′-beam is detected 225′′ East of Ced 201 PDR. The integrated flux is 24950 mJy, which reflects the estimated absolute calibration uncertainty. The resulting 1.2 mm emission map is shown in Figure 1 (smoothed to a beam resolution of 15′′).
The HCO+ =1–0 line was observed also at the –30m telescope during September 2005 using the B100 single sideband receiver with a channel resolution of 40 kHz. The main beam efficiency at 89 GHz is 0.82 and the angular resolution is 28′′. The line was observed towards the dust condensation and in a declination raster crossing Ced 201 PDR (see Fig. 1). Additional observations were performed at the CSO telescope (Mauna Kea, Hawaii) during July 2006 and June 2007. The telescope is equipped with SIS receivers operated in double sideband mode. The CO =3–2 map (Figs. 1 and 2) was made “on-the-fly”. The DCO+ =3–2 line was mapped in a 40′′ 30′′ region around the dust condensation, whereas pointed observations in the CO =2–1 and 4–3 lines were taken towards the dust emission peak (Fig. 1). The spectra were analyzed with a 1024 channel acousto-optic spectrometer with a total bandwidth of 50 MHz and a resolution of 100 kHz. The main beam efficiencies of the telescope were 0.70, 0.75 and 0.53 at 230, 345, and 461 GHz respectively. The angular resolution is 30′′ at CO =2–1, 20′′ at CO =3–2 and 15′′ at CO =4–3. Data was processed with GILDAS.
The Ced 201 region was also observed with Spitzer as part of our SPECPDR program111http://www.cesr.fr/joblin/SPECPDR_public/Home (Joblin et al., 2005) with the Infrared Array Camera (IRAC) at 4.5, 5.8, and 8 m and with the Infrared Spectrograph (IRS). IRS data were obtained in the spectral mapping mode with the LL1 module (spectral range: 20 to 35 m). The spectral cube of the source was assembled using the CUBISM software (Smith et al., 2007) from the Basic Calibrated Data (BCD) files. The 20 to 35 m data was obtained by integrating the cube spatially (see Berné et al. 2007). The 70 m Multiband Imaging Photometer for Spitzer (MIPS) data that are part of the PID 30790 program (Fazio et al.) were retrieved from the Spitzer archive. MIPS and IRAC post-BCD calibrated images were used directly without additional processing.
3. Results: Detection of a Young Protostar
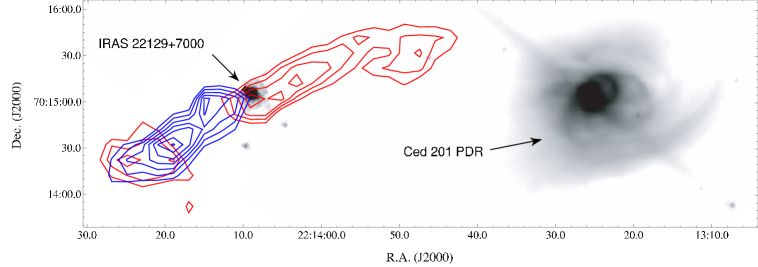
Figure 2 shows the detection of a compact continuum source at 8 m (warm dust) located 0.4 pc East of Ced 201 PDR Berné et al. (2007). The compact object is also detected at 4.5, 5.8, 20–35 and 70 m with Spitzer. The near–IR source position agrees with the continuum peak of the 1.2 mm extended emission (cold dust) detected in a larger field-of-view (Fig. 1). The best coordinates inferred from IRAC images are , , which coincides with the IRAS 22129+7000 source, clearly a YSO. A well collimated molecular outflow emanating from the object is seen along a SE-NW axis in the CO =3–2 line (Figs. 2 and 1). This outflow was previously detected in CO =1–0 at lower angular resolution by Nikolić & Kun (2004), who first suggested that IRAS 22129+7000 could be the driving source. We now detect the near– and mid–IR scattered light from the embedded protostar and the mm thermal emission from the surrounding dusty cocoon. In the following we examine the nature of this source and whether or not the presence of a PDR plays a role in the star formation process in the region.
3.1. Peculiar SED Characteristics
In order to investigate the emitted power in the different wavelength domains, the SED of IRAS 22129+7000 has been built with our MAMBO and Spitzer observations and complemented with previous 2MASS (2.15 m), IRAS (12, 25, 60 and 100 m) and KAO (200 m; Casey 1991) detections (Table 1). We fitted the SED with two graybodies, , where is the solid angle subtended by the emitting region. In the far-IR and mm domain and T can be associated with the dust opacity and color temperature (Td) of the extended envelope. Here we take a dust opacity (per gas+dust mass column density) of =0.01 cm2 g-1 at 1200 m, the usual value adopted for the dust in protostellar envelopes André et al. (2000). Because of the implicitly assumed grain growth and ice mantle formation Ossenkopf & Henning (1994), this value is a factor 5 larger than for standard interstellar grains. is fixed as the FWHM size of the envelope inferred from the 1.2 mm continuum map, while the column density of material is varied between AV 5 and 30. Satisfactory fits are obtained for Td=24-19 K and dust spectral indexes =1.4-1.8 respectively (see the best fit as continuous blue curve in Fig. 3). A luminosity of Lbol=5.50.5 and a “bolometric temperature” of Tbol 175 K (the temperature of a blackbody with the same SED mean frequency; Myers & Ladd 1993) are inferred from the full fit.
In a first inspection, the resulting SED (Fig. 3) does not look like a typical Class 0 source in the near– and mid–IR (see e.g., Whitney et al. 2003). The improved sensitivity of the IR instrumentation compared to that available in the 90’s has allowed the detection of scattered light from several Class 0 sources below 10 m (Tobin et al. 2007). In addition, the Ks–band emission due to scattered light observed through a cavity opened by the outflow (with a favorable inclination angle) and/or H2 rovibrational emission from the outflow base, has also been detected in a few Class 0 sources (e.g., Tachihara et al. 2007). IRAS 22129+7000 shows these observable characteristics but it also displays an intriguing strong, and rather flat, near– and mid–IR emission (as shown by the relatively high Tbol). In fact, Spitzer fluxes towards IRAS 22129+7000 are consistent with the typical values observed in Class I sources with the same luminosity (Furlan et al. 2008), but an order of magnitude higher than in Class 0 sources (Tobin et al. 2007). On the other hand, IRAS 22129+7000 shows a very large fraction of submm ( 350 m) to bolometric luminosity (2; a signature of younger Class 0 sources still surrounded by massive dusty envelopes).
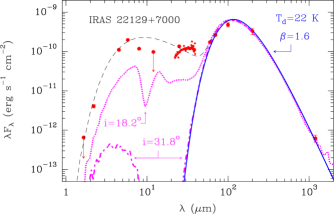
In an attempt to better understand the peculiar IR shape we tried to fit the SED with the 2D radiative transfer tool by Robitaille et al. (2007). The best models fitting the data are shown in Fig. 3 for two different inclination angles. While the long-wavelength emission from the circumstellar envelope is well reproduced by the models (and is almost not affected by the viewing angle), the short–wavelength emission from the protostellar/disk system is clearly underestimated and strongly depends on inclination. Therefore, a small viewing angle favors the detection of near– and mid–IR scattered light from the embedded protostar through the cavities cleared by the outflow. However, the blue– and red–shifted lobes of the CO outflow (Fig. 2) appear relatively well separated, and thus the source can not be completely “pole–in” Cabrit & Bertout (1986). In summary, the observed SED is peculiar, with a near– and mid–IR excess that can not be fully explained in terms of inclination effects.
3.2. Circumstellar Envelope: Radial Analysis
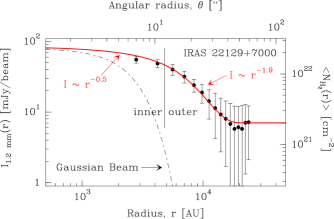
The cold dust surrounding the YSO has been mapped through its 1.2 mm emission (Fig. 1). As mm continuum emission is generally optically thin, the measured fluxes are proportional to the temperature–weighted mass content assuming that dust grains properties are known. In order to trace the mass distribution in the envelope, the radial intensity profile has been analyzed by averaging the 1.2 mm fluxes within equidistant circular annulus (Fig. 4). An envelope radius of 15,000 AU is inferred. Assuming spherical symmetry, the intensity profile contains information on the density distribution, , and temperature distribution, , with (e.g., Adams 1991).
| Lbol | Tbol | Menv | Lsmm/Lbol | Menv/Lbol |
|---|---|---|---|---|
| (L⊙) | (K) | (M⊙) | (%)c | (M⊙/L⊙) |
| 5.50.5 | 175 | 0.2a-0.7b | 2 | 0.04a-0.13b |
Before convolving the expected intensity profile with the bolometer angular resolution, we divide the envelope in two regions (inner and outer) and try to fit the observed 1.2 mm emission profile with two power-laws. Fig. 4 shows that the dust emission in the outer envelope ( 5,000 AU one beam) follows a very steep profile, with 1.9, connecting the envelope with the lower density ambient cloud at . Since the outer envelope angular radii are larger than the beam’s FWHM, the convolution does not modify the slope of the intensity profile (e.g., Adams 1991; Motte & André 2001). For the same reason, our observations can not resolve accurately the slope of the inner envelope ( 5,000 AU). We take 0.5 as the expected value in a free-falling envelope. The line radiative transfer models shown in Sect. 3.4 are not inconsistent with this assumption.
Taking again a dust opacity of =0.01 cm2 g-1 and Td=20 K (consistent with the SED analysis) we compute a total circumstellar mass of Menv=0.7 within . However, it is unlikely that all this mass can be finally accreted by the protostar/disk. First because the outflow will disperse a large fraction of it, and second, because differential rotation in the envelope is expected to decouple the inner rapidly infalling and rotating layers from the slowly collapsing and rotating outer regions (Belloche et al. 2002). Hence, we also computed M=0.2 , the mass within one 11′′–beam ( Rin) as representative of the mass inside the inner envelope.
The steep slope of the 1.2 mm intensity profile suggests that a temperature gradient is also present. In particular, the dust thermal profile through the inner envelope should be dominated by accretion heating from the protostar/disk system with Terebey et al. (1993):
| (1) |
where depends on the dust grain properties through . Given the proximity of Ced 201 PDR, FUV photons from BD+69∘1231 star also heat the outer layers of IRAS 22129+7000 envelope. Penetration of this external FUV radiation field into the envelope greatly depends on the scattering properties of the dust particles, with larger penetration depths as grains grow toward bigger grains (Goicoechea & Le Bourlot 2007). In the following we adopt a temperature profile that follows Eq. (1), reaches a minimum of 10 K at 10,000 AU and then increases up to 15 K at due to external FUV heating (this temperature is consistent with our analysis of CO lines in the ambient cloud). Taking =0.36 (using =1.6 from the SED) and assuming , the estimated mass of the envelope increases by a factor 2 respect to the isothermal case because drops below 20 K in a large fraction of the envelope. This difference adds to the dominant source of uncertainty in the mass determination, the dust composition and associated opacity.
Taking into account these caveats, the observed 1.2 mm intensity profile in the outer envelope is equivalent to a steep density profile with a number density of (H2)(1-2)105 cm-3 at . Under these assumptions, the (beam averaged) extinction towards the peak (e.g., Motte & André 2001) is A20-30, a factor 10 larger than the value implied by our 1.2 mm continuum observations in the ambient cloud.
3.3. Gas Kinematics: Outflow and Infall?
Figure 2 shows the outflow emanating from IRAS 22129+7000 and extending 0.3 pc in the NW direction (redshifted lobe) and 0.2 pc in the SE direction (blueshifted lobe). In addition, IRAS 22129+7000 is the driving source of the Herbig Haro HH450 jet detected 0.2 pc SE from the object Bally & Reipurth (2001). The CO outflow is well collimated, with an aspect ratio of 3–4 (the projected FWHM flow length/width ratio). CO =2–1 to 4–3 line profiles show high velocity wing emission from accelerated gas. Typical full line widths are consistent with an expansion velocity of 7 km s-1 (Fig. 1). We thus estimate that the dynamical age of the outflow (length/) is 35,000 yr (up to 105 yr if the inclination angle is =18o). The presence of a molecular outflow suggests that the protostar/disk system is still accreting material from the natal envelope. The high density tracer HCO+ =1-0 line, with a critical density of cm-3, shows a deep red–shifted–absorption asymmetry in its optically thick line profile (when the associated level is predominantly populated by collisions with H2 molecules and Tex, the transition excitation temperature, tends to the kinetic temperature). The depth and velocity position of the absorption dip are due to a decrease of Tex at the outer edges of a (likely) infalling envelope (left insets in Fig. 1). As low- CO lines easily thermalize at lower densities ( 103-4 cm-3), they may not be reliable tracers of the presence of infall motions but of the varying physical conditions in the beam. Among the observed CO lines, only the =4-3 line starts to trace denser ( cm-3), possibly infalling, gas. In anycase, the HCO+ =1-0 self-absorption dip is redshifted 0.3 km s-1 from the rest velocity of the cloud (5 km s-1) and is not observed at nearby positions of the cloud where the line shows a pure Gaussian emission profile (right insets in Fig. 1). Although higher– optically thick lines from abundant high dipole moment molecules should be mapped to draw definitive conclusions, in the following we assume that the observed deep HCO+ self-absorption is produced by inward motions.
The densest gas in the envelope has been traced with the DCO+ =3–2 line ( cm-3) which shows compact (40′′) emission around IRAS 22129+7000. Compared to the broad line wings from the CO outflow, the DCO+ =3-2 line shows the narrowest observed linewidth (=0.600.04 km s-1). On the other hand, we used the C18O =1–0 line to trace lower density gas (e.g., the outer envelope). This line displays a broader linewidth (=0.960.02 km s-1). The radiative transfer calculations presented in the next section confirm that both lines are optically thin and thus they are not broaden by line saturation. Therefore, the different velocity dispersions reflect the distinct regions where both line profiles are formed. Assuming Tk=10 to 20 K, the observed DCO+ linewidths are 5 to 3.5 times larger than the expected thermal broadening. The required non–thermal velocity dispersion to fit the observed DCO+ =3-2 linewidth (from turbulence, infall or rotation) is 0.25 km s-1 (with ).
3.4. Line Radiative Transfer Analysis
In order to reproduce the observed molecular lines with a realistic model of the envelope, we have used a nonlocal and non-LTE excitation and radiative transfer code Goicoechea et al. (2006). The code models an infalling spherical envelope and accounts for line trapping, collisional excitation222CO (and isotopologues) rotationally inelastic collisional rates have been derived from those of Flower (2001). HCO+ and DCO+ collisional rates have been derived from those of Flower (1999)., and radiative excitation. Arbitrary velocity fields as well as density, temperature, and abundance radial gradients are included as input parameters. This is done by numerical discretization of the envelope in spherical shells. The nonlocal radiative transfer problem is then simulated by the emission of a determined number of model photons (cosmic mm background, continuum and line photons) using the Monte Carlo approach Bernes (1979). The steady state statistical equilibrium equations are then solved iteratively and the non-LTE level populations are determined in the shells. The emergent line intensities along each line of sight are finally convolved with the telescope angular resolution.
3.4.1 A First Model for the Circumstellar Envelope
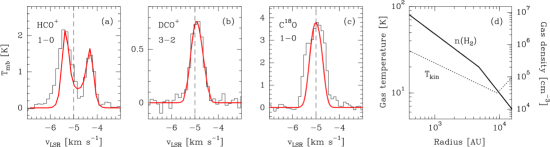
As our first attempt to understand IRAS 22129+7000 physical structure, we have modelled a spherical envelope with a radius =15,000 AU. We take the density and temperature profiles ( and plus external FUV heating) derived in the previous section for the outer envelope ( 5,000 AU). Given the high densities expected in most of the envelope, we assume that gas and dust are thermalized (i.e., =).
Using the above density and temperature structure we run the model globally for HCO+, DCO+ and C18O and try to find iteratively the best velocity fields and abundances fitting the observed line profiles. In order to reproduce the observed velocity of the CO =4-3 and HCO+ =1-0 redshifted absorption dips (0.2 and 0.3 km s-1) we adopt a uniform infalling velocity of =0.2 km s-1 in the outer envelope. For (the inner envelope) we assume , and i.e., the density and velocity profiles in a freefall inside-out collapsing envelope Shu et al. (1987). Numerical simulations of collapse induced by external compression waves also predict those approximate and profiles behind the expanding collapse-wavefront (e.g., Hennebelle et al. 2003). These two regimes of infall (freefall and uniform) have been inferred in other YSOs with clear evidences of collapse (Belloche et al. 2002). Under the above conditions, DCO+ optically thin lines constrain the remaining nonthermal broadening (turbulence in the following). Satisfactory fits to the DCO+ =3-2 line (with [DCO+/H2]=(1-2)10-10) are obtained for =0.15 km s-1 (the turbulence on the size scale of the beam). Therefore, in the densest parts of the envelope (as traced by the DCO+) is subsonic, and probably a vestige of the low degree of turbulence found in prestellar cores Bergin & Tafalla (2007). Hereafter we adopt a uniform value of 0.15 km s-1 in the models of the envelope.
In order to reproduce the HCO+ =1–0 line profile we have added the contribution from the lower density (more turbulent) ambient cloud surrounding IRAS 22129+7000 and producing a line-of-sight extinction of AV=2-3 (from 1.2 mm observations). Given the high HCO+ dipole moment and large abundance (producing subthermal excitation and large opacities), low- line photons from the dense envelope will be greatly attenuated and scattered over large areas by this low density halo Cernicharo & Guélin (1987). Note that the negligible DCO+ and C18O column densities in the ambient cloud do not alter the DCO+ and C18O line emission from the envelope itself. The density and temperature in the ambient cloud can be constrained with the observed CO lines. They are reproduced with n(H2)1000 cm-3 and Tk 15 K, in agreement with estimations by Witt et al. (1987). The halo ambient cloud in the model is at rest (=0 km s-1) but the broader observed linewidths require =0.30 km s-1 (supersonic), at least a factor 2 larger than in the circumstellar envelope. Figure 5 shows the best fits and the density and temperaure gradients used in the model. In spite of the good agreement, the model slightly underestimates the observed HCO+ and C18O =1–0 linewidths, likely due to a minor contribution from the high velocity outflow (not modelled here).
The resulting large DCO+/HCO+ abundance ratio (0.02) found in IRAS 22129+7000 is similar to that derived in cold and dense prestellar condensations near other PDRs (e.g., Pety et al. 2007). This is consistent for a species that shows enhanced abundance in the cold FUV–shielded gas (low ionization degree) affected by ongoing deuterium fractionation (where dissociative recombinations with electrons are its main destruction route). As a consequence, the DCO+/HCO+ abundance ratio is roughly inversely proportional to the electrons abundance and we can estimate its value. Taking the same gas phase chemical network used by us in Pety et al. (2007), and assuming a cosmic ionization rate of =310-17 s-1 Dalgarno (2006), we derive an ionization fraction of 10-8 (with respect to H nuclei) in the densest and coldest regions of the envelope where the DCO+ abundance peaks. This value is, within a factor 2, similar to the ionization fraction inferred in prestellar cores such as Barnard 68 Maret & Bergin (2007).
3.4.2 CO outflow parameters
In the previous section we have estimated the amount of material towards IRAS 22129+7000 and also evaluated the CO line emission contribution from the ambient cloud and from the circumstellar envelope (through the optically thin C18O line). After subtracting the CO contribution from the above line–of–sight components we now estimate a CO column density of 1016 cm-2 in the outflow. Taking into account the observed dimensions of the blue– and red–shifted lobes we compute the mass (0.14 M⊙), momentum (1.0 M⊙ km s-1) and kinetic energy (6.81043 erg) carried out by the outflow. Note that the mechanical luminosity of the flow (0.02 L⊙) is still a significant fraction (0.4%) of the radiant luminosity of the driving source. The estimated outflow momentum flux is FCO 310-5 M⊙ km s-1 yr-1, although the correction factor for inclination effects () will decrease the actual FCO if 40o. Hence, FCO is intermediate between the observed momentum fluxes found in early Class 0 sources and those found in late Class I sources (e.g, Bontemps et al. 1996, Bachiller 1996).
| Kinetic | Mechanical | |||
|---|---|---|---|---|
| Outflow | Mass | Momentum | Energy | Luminosity |
| Componenta | (M⊙) | (M⊙ km s-1) | (1043 erg) | (10-3 L⊙) |
| Blueshifted… | 0.06 | 0.4 | 2.9 | 6.9 |
| Redshifted…. | 0.08 | 0.6 | 3.9 | 9.3 |
| Total………… | 0.14 | 1.0 | 6.8 | 16.2 |
4. Discussion and Conclusions
4.1. The Nature of IRAS 22129+7000
As noted earlier IRAS 22129+7000 shows indirect evidence of a protostar/disk system (a collimated outflow) and it shows extended dust emission from the envelope with a large Lsmm/Lbol ratio (2). These characteristics are consistent with the standard observational definition of Class 0 sources (André et al. 2000). Comparison of the derived Lbol and M values with theoretical evolutionary tracks Saraceno et al. (1996); André et al. (2000) shows that the source is likely in the interesting Class 0 to I transition. Approximately 50 of the initial mass envelope must have been accreted at this stage. According to these diagrams, infall must have started in the parental core (0.5-1)105 yr ago. This age is consistent with the dynamical age of the outflow, specially if inclination effects are taken into account.
The peculiar SED of IRAS 22129+7000 shows however a near– and mid–IR excess that produces a high Tbol of 175 K, consistent with more evolved Class I sources (70–650 K; Myers et al. 1998). Given the strong dependence of the short-wavelength IR emission on the viewing angle (Fig.3), the inferred Tbol is certainly affected by orientation effects. Up-to-date 2D SED models show however that inclination is not enough to reproduce the observed excess. Nevertheless, as mentioned by Robitaille et al. (2006), their large grid of modelled SEDs have some caveats. The most important for our analysis is that none of them includes multiple central sources. An interesting possibility is thus that the source in IRAS 22129+7000 is a multiple (e.g., binary) stellar system. In fact, prestellar cores can fragment a second time during protostellar collapse and lead to the formation of binary systems (e.g. Duchêne et al. 2007). However, it is not yet clear if the initial conditions in these cores (e.g., the cloud environment) play a major role in such dynamical fragmentation. Simulations predict that external compression waves arriving at the central object at different times or instabilities in the outer accretion disk could be the seed of multiple protostellar systems (e.g., Hennebelle et al. 2003, 2004). In this picture, the presence of both a young and a more evolved YSO sharing a common circumstellar envelope would explain the observed near– and mid–IR excess if the scattered light from the evolved YSO escapes from the outflow cavities. Higher angular resolution IR observations are required to confirm this scenario. In addition, a larger set of molecular line observations and maps are needed to tightly constrain the physics (infall and rotation velocity fields) and chemistry (molecular content) of this protostar and its environment.
4.2. Star Formation Near Ced 201 PDR
IRAS 22129+7000 is located near Ced 201 PDR ( 0.4 pc and AV 1). Taking into account geometrical dilution and selective dust extinction of FUV dissociating radiation from BD+69∘1231, Casey (1991) computed that a region with a radius of at least 0.6 pc (300′′) around the exciting star is permeated by FUV photons. In particular the FUV radiation field near IRAS 22129+7000 should be presently at least 2 times the mean interstellar radiation field. Aside from dynamical effects associated with the presence of a nearby PDR illuminated by a runaway star (e.g., shock waves), heating and radiation pressure in the region are larger than in other FUV radiation–free environments. Interestingly enough, the 1.2 mm dust emission (very weak in the PDR itself) peaks again in two dust condensations 0.25 pc North of Ced 201, roughly in the same direction of outflow red–lobe axis. These cores/clumps have a radius of 5,000 AU and coincide with an enhancement of the HCO+ =1–0 line emission (see Fig.1). It is very likely that these condensations are being externally heated and compressed by the combined action of the outflow and the PDR associated FUV–driven shock wave. In fact, a similar scenario has presumably led to the formation of IRAS 22129+7000 itself. We thus suspect that star formation in the B175 globule is triggered by the shocks and radiative feedback induced by BD+69∘1231 star and the new generation of low-mass YSOs.
Observations of cores and YSOs provide new insights into how the star formation process is affected by its cloud environment. The vicinity of late type B stars has interesting intermediate properties between isolated dark cores (where FUV-radiation does not play a major role) and cores compressed by the expansion of H ii regions (near more massive stars). Cool PDRs such as Ced 201 are nearly devoid of ionizing photons and thus they provide a very different environment compared to other star forming regions which are photoionized by brighter OB stars. In the special case of Ced 201, the exciting star is moving fast through the region, suggesting that its arrival to the cloud, and thus the triggering, is recent.
References
- Adams (1991) Adams, F. C. 1991, ApJ, 382, 544
- André et al. (1993) André, P., Ward-Thompson, D. & Barsony, M. 1993, ApJ, 406, 122
- André et al. (2000) André, P., Ward-Thompson, D. & Barsony, M. 2000, Protostars and Planets IV, University of Arizona Press, eds Mannings, V., Boss, A.P., Russell, S. S., p59
- Arce & Sargent (2006) Arce, H,G. & Sargent, A.I. 2006, ApJ, 646, 1070
- Bally & Reipurth (2001) Bally, J. & Reipurth, B. 2001, ApJ, 552, L159
- Bachiller (1996) Bachiller, R. 1996, ARA&A, Volume 34, 111-154
- Belloche et al. (2002) Belloche, A., André, P., Despois, D. & Blinder, S. 2002, A&A, 393, 927
- Bergin & Tafalla (2007) Bergin, E.A., & Tafalla, Mario, 2007, ARA&A, 45, 339
- Berné et al. (2007) Berné, O. et al. 2007, A&A, 469, 575
- Bernes (1979) Bernes, C. 1979, A&A, 73, 67.
- Bontemps et al. (1996) Bontemps, S., André, P., Terebey, S. & Cabrit, S. 1996, A&A, 311, 858
- Brinch et al. (2007) Brinch, C., Crapsi, A., Hogerheijde, M. R. & Jrgensen, J. K. 2007, A&A, 461, 1037
- Cabrit & Bertout (1986) Cabrit, S. & Bertout, C. 1986, ApJ, 307, 313
- Cabrit et al. (2007) Cabrit, S., Codella, C., Gueth, F., Nisini, B., Gusdorf, A., Dougados, C. & Bacciotti, F. 2007, A&A, 468, L2
- Casey (1991) Casey, S.C. 1991, ApJ, 371, 183
- Cernicharo & Guélin (1987) Cernicharo, J. & Guélin, M. 1987, A&A, 176, 299
- Cesarsky et al. (2000) Cesarsky, D., Lequeux, J., Ryter, C., Gerin, M. 2000, A&A, 354, L87
- Dalgarno (2006) Dalgarno, A., 2006 Proceedings of the National Academy of Science, vol. 103, Issue 33, 12269-12273
- Duchêne et al. (2007) Duchêne, G., Bontemps, S., Bouvier, J., André, P., Djupvik, A. A. & Ghez, A. M. 2007, A&A, 476, 229
- Flower (1999) Flower, D. R. 1999, MNRAS, 305,
- Flower (2001) Flower, D. R. 2001, JPhB, 305, 651
- Furlan et al. (2008) Furlan E. et al., 2008, to appear in ApJS, astro-ph/07114038.
- Goicoechea & Le Bourlot (2007) Goicoechea, J. R. & Le Bourlot, J. 2007, A&A, 467, 1
- Goicoechea et al. (2006) Goicoechea, J. R., Pety, J., Gerin, M., Teyssier, D., Roueff, E., Hily-Blant, P. & Baek, S. 2006, A&A, 456, 565
- Hennebelle et al. (2003) Hennebelle, P., Whitworth, A. P., Gladwin, P. P., & André, Ph. 2003, MNRAS, 340, 870
- Hennebelle et al. (2004) Hennebelle, P., Whitworth, A. P., Cha, S.-H., & Goodwin, S. P. 2004, MNRAS, 348, 687.
- Joblin et al. (2005) Joblin, C. et al. 2005, on Astrochemistry: Recent Successes and Current Challenges, Proceedings of the 231st Symposium of the IAU held in Pacific Grove, California, USA, p.194
- Johnstone et al. (2000) Johnstone, D., Wilson, Ch.D., Moriarty-Schieven, G., Joncas, G., Smith, G., Gregersen, E. & Fich, M. 2000, ApJ, 545, 327
- Jrgensen et al. (2007) Jrgensen, J.K. et al. 2007, ApJ, 659, 479
- Kun (1998) Kun, M. 1998, ApJS, 115, 59
- Lada (1999) Lada, C.J. 1999, The Origin of Stars and Planetary Systems. Edited by Charles J. Lada and Nikolaos D. Kylafis. Kluwer Academic Publishers, 1999, p143
- Maret & Bergin (2007) Maret, S, & Bergin, E.A. 2007, ApJ, 664, 956
- (33) Motte, F. & André, P. 2001, A&A, 440, 464
- Myers & Ladd (1993) Myers, P. C. & Ladd, E. F. 1993, 413, L4
- Myers et al. (1998) Myers, P. C., Adams, F. C., Chen, H. & Schaff, E. 1998, ApJ, 492, 703
- Nikolić & Kun (2004) Nikolić, S. & Kun, M. 2004, BaltA, 13, 487
- Ossenkopf & Henning (1994) Ossenkopf, V. & Henning, Th. A&A, 291, 943
- Pety et al. (2007) Pety, J., Goicoechea, J. R., Hily-Blant, P., Gerin, M., Teyssier, D. 2007, A&A, 464, L41
- Robitaille et al. (2006) Robitaille, T.P., Whitney, B.A., Indebetouw, R., Wood, K. & Denzmore, P. 2006, ApJS, 167, 256
- Saraceno et al. (1996) Saraceno, P., André, P., Ceccarelli, C., Griffin, M. & Molinari, S. 1996, A&A, 309, 827
- Shu et al. (1987) Shu, F,H., Adams, F.C. & Lizano, S. 1987, ARA&A, 25, 23
- Skrutskie et al. (2006) Skrutskie et al. 2006, AJ, 131, 1163
- Smith et al. (2007) Smith, J. D. T. et al. 2007, PASP, 119, 1133
- Tachihara et al. (2007) Tachihara, K. et al. 2007, ApJ, 659, 1382
- Terebey et al. (1993) Terebey, S., Chandler, C. J. & André, P. 1993, ApJ, 414, 759
- Teyssier & Sievers (1999) Teyssier, D. & Sievers, A. 1999. A Fast–Mapping Method for Bolometer Arrary Observations. IRAM technical report.
- Tobin et al. (2007) Tobin, J.J., Looney, L.W., Mundy, L.G., Kwon, W., Hamidouche, M. 2007, ApJ, 659, 1404
- Whitney et al. (2003) Whitney, B,A., Wood, K., Bjorkman, J. E., Cohen, M. 2003, ApJ, 598, 1079
- Witt et al. (1987) Witt, A. N., Graff, S. M., Bohlin, R. C. & Stecher, T. P. 1987, ApJ, 321, 912
- Wolf (1908) Wolf, M. 1908, MNRAS, 69, 117
- Zylka (1998) Zylka, R. 1998, Pocket Cookbook for MOPSIC Software.