The young population of the Chamaeleon II dark cloud
Abstract
We discuss the results of the optical spectroscopic follow-up of pre-main sequence (PMS) objects and candidates selected in the Chamaeleon II dark cloud based on data from the Spitzer Legacy survey From Molecular Cores to Planet Forming Disks (c2d) and from previous surveys. Our sample includes both objects with infrared excess selected according to c2d criteria and referred to as Young Stellar Objects and other cloud members and candidates selected from complementary optical and near-infrared data.
We characterize the sample of objects by deriving their physical parameters. The vast majority of objects have masses and ages 6 Myr. Several of the PMS objects and candidates lie very close to or below the Hydrogen-burning limit. A first estimate of the slope of the Initial Mass Function in Cha II is consistent with that of other T associations. The star formation efficiency in the cloud (1-4%) is consistent with our own estimates for Taurus and Lupus, but significantly lower than for Cha I. This might mean that different star-formation activities in the Chamaeleon clouds may reflect a different history of star formation. We also find that the Cha II cloud is turning some 8 into stars every Myr, which is less than the star formation rate in the other c2d clouds. However, the star formation rate is not steady and evidence is found that the star formation in Cha II might have occurred very rapidly. The H emission of the Cha II PMS objects, as well as possible correlations between their stellar and disk properties, are also investigated.
1 Introduction
During the last decade, many efforts have been devoted to the investigation of pre-main sequence (PMS) objects in star-forming regions and young clusters (Hillenbrand & Carpenter, 2000; Luhman et al., 2000; Briceño et al., 2002; Downes et al., 2006; Preibisch et al., 2003; Muench et al., 2003; Downes et al., 2006, and references therein), with the aim of studying the star formation process down to the very low-mass end of the Initial Mass Function (IMF). Unlike field stars and sub-stellar objects of the solar neighborhood, young populations in star forming regions and young clusters allow the interpretation of their observational quantities free from caveats of evolutionary or dynamical biases, because their properties are better constrained. The wealth of data collected so far indicates that stars and brown dwarfs (BDs) share a common formation history. Indeed, the detection of disks around BDs (Luhman et al., 2005a; Luhman, 2006; Jayawardhana & Ivanov, 2006; Alcalá et al., 2006), the similarity of the disk fractions of stars and BDs (Jayawardhana et al., 2003a; Luhman et al., 2005b; Liu et al., 2003) and the continuity of accretion rates from stars to BDs (Muzerolle et al., 2000, 2003, 2005; Briceño et al., 2002; White & Basri, 2003; Jayawardhana et al., 2003b; Mohanty et al., 2005), suggest a stellar-like formation process, down to the Deuterium burning limit (Luhman et al., 2007). Recent investigations have pointed out, however, that the fraction of young BDs relative to low-mass and more massive PMS stars may vary significantly among different star forming regions (Kroupa, 2002). In particular, the fraction in OB associations (Boulanger et al., 1998; Hillenbrand & Carpenter, 2000; Barrado y Navascués et al., 2001; Briceño et al., 2002; Muench et al., 2002) exceeds that determined for T associations (Comerón et al., 2000; Béjar et al., 2001; Tej et al., 2002; Briceño et al., 2002; Spezzi et al., 2007), suggesting that the environment may have an important impact on the BD formation process.
The Spitzer Space Telescope offers the opportunity for a major advance in the study of star and BD formation, overcoming the problems that generally affect the observational approaches to this subject (i.e. photometric and spatial incompleteness, incomplete data across the wavelength ranges of interest, etc). The Spitzer Legacy Survey From Molecular Cores to Planet Forming Disks (c2d) has been completely devoted to studying the process of star and planet formation from the earliest stages of molecular cores to the epoch of planet-forming disks (Evans et al., 2003). In the context of the c2d survey, five large molecular clouds have been selected for mapping, with the criterion of encompassing all modes of star formation. The Chamaeleon II (Cha II) dark cloud, at a distance of 178 pc (Whittet et al., 1997), has been chosen as a test-case of a region with low extinction and modest star-formation activity, whose young stars are isolated or in sparse groups. Cha II has been mapped with the Infrared Array Camera (IRAC, Porras et al., 2007) and the Multiband Imaging Photometer for Spitzer (MIPS, Young et al., 2005); in addition, complementary optical imaging data have been obtained with the Wide-Field Imager (WFI) at the ESO 2.2m telescope (Spezzi et al., 2007) and a deep near-IR survey of the cloud was performed by Allers et al. (2006). The results of these combined observations have been reported in the synthesis work by Alcalá et al. (2008, hereafter Paper I), which provides a reliable census of the young population in Cha II, down to 0.03 M⊙, and investigates the IR properties and circumstellar disks of the young population through the comparison of the spectral energy distributions (SEDs) and colors with recent passive and accretion disk models for young stellar and sub-stellar objects. By merging the c2d data with the collection of data from optical to millimeter wavelengths available in the literature, Paper I also presents an overview on the global properties of Cha II, such as clustering, extinction, cloud mass, star formation efficiency, star formation rate, etc.
The main goal of the present paper, is the characterization of the young population in Cha II by the determination of the physical parameters of the cloud members. To this aim, we present optical spectroscopic follow-up observations of the objects selected in Paper I. The optical spectroscopy allows us to confirm the young nature of the PMS objects and candidates reported in Paper I, as well as to improve the spectral type classification of the previously known members of the cloud. Once the membership is established, we determine the effective temperature and luminosity for all the cloud members and hence, their masses and ages by comparison with theoretical PMS evolutionary tracks. This procedure allows us to investigate the star formation history in Cha II and estimate the IMF of the region. We also discuss the stellar properties and spectroscopic features and their link with the disk properties determined in Paper I. This work is thus intended to be a complementary companion paper to Paper I.
Throughout this paper we will adopt the same terminology of PMS and young stellar objects (YSOs) as presented in Paper I; i.e. we define YSOs to be those PMS objects with detectable IR excess in at least one of the Spitzer bands, that satisfy the c2d multi-color selection criteria described in Harvey et al. (2007), whereas the more general term “PMS object” refers to young objects, not yet on the main sequence, that may or may not possess IR excess and which may have been discovered in H or X-ray surveys. In this sense, all YSOs are PMS objects, but not vice versa.
In § 2.1 we describe the sample of PMS objects and candidates investigated in this work and present an overview of the spectroscopic observations and data reduction. The results of the follow-up spectroscopy are reported in § 3 and § 4, where we also describe the procedures adopted for the spectral type classification and the determination of their physical parameters. In § 5 we focus on the sub-stellar members of Cha II, while in § 6 we report the overall results on the IMF and the star formation history in the cloud. Finally, in § 7 and § 8 we discuss possible correlations between spectroscopic diagnostics, stellar parameters, and disk properties. We summarize our results in § 9.
2 The sample and the observations
2.1 The sample
The sample studied in this work consists of the 62 PMS objects and candidates reported in Paper I. Several of these objects were proposed as potential members of Cha II in previous works (Schwartz, 1977, 1991; Gauvin & Strom, 1992; Hughes & Hartigan, 1992; Hartigan, 1993; Alcalá et al., 1995; Vuong et al., 2001; Barrado y Navascués et al., 2004) based on their strong IR excess emission, H emission or X-ray emission, but for many of them the confirmation of the Lithium 6707.8 Å absorption line in their optical spectra was missing. The presence of strong absorption in the Lii resonance line represents in fact the most important criterion for the identification of low-mass PMS stars, since lithium is efficiently destroyed by convective mixing in the stellar interior when the temperature at the bottom of the convective layer reaches about 2106 K (Bodenheimer, 1965).
Likewise, the candidates selected in the surveys by Young et al. (2005) and Spezzi et al. (2007) and those resulting from the c2d selection criteria in Paper I, as well as the sub-stellar objects reported by Allers et al. (2006) and Alcalá et al. (2006) are included. Table 1 reports the studied sample. For the sake of homogeneity the table is presented in the same format as in Paper I and, for completeness, we also include the entry of the outflow HH 54, as well as the three Class I objects discussed in Paper I. As will be discussed in § 3, the 11 objects marked as ‘CND’ in Table 1, and referred as ‘candidates’ in the text, could not be observed in our spectroscopic survey. Hence, their PMS nature remains still uncertain.
2.2 FLAMES observations
The two main goals of the spectroscopic observations were the detection of the Lii 6708 absorption line, a classical youth indicator in late-type stars (see, e.g., Rocha-Pinto et al., 2002), and the spectral type classification111The investigation on radial velocities and spectroscopic multiplicity will be matter of a future paper.. To these aims, multi-object spectroscopy was performed with FLAMES222Fibre Large Array Multi-Element Spectrograph. (Pasquini et al., 2002) at the ESO VLT-UT2 during two observing runs in visiting mode. The first run was in February 2006, while the second one in February 2007. The weather during both runs was photometric under sub-arcsecond seeing conditions. We used both the spectrographs fed by FLAMES, i.e. GIRAFFE333Grating Instrument for Radiation Analysis with a Fibre Fed Èchelle. (in the MEDUSA444Separate Multi Object. configuration) and UVES. GIRAFFE-MEDUSA allows the simultaneous observation of about 100 targets with intermediate resolution (about 8,600) in the spectral range 6440–7180Å, while UVES555UV-Visible Echelle Spectrograph. can access only up to 8 objects at the time and provides a resolving power of about 48,000 in the spectral range 4800–6850Å . Such resolving powers and spectral coverages are ideal to resolve the Lii line from the nearby Cai 6718 line, measure Li equivalent widths with an error of less than 20 mÅ on spectra with a S/N ratio higher than 20, and perform a reliable spectral type classification.
Figure 1 shows the spatial distribution of the FLAMES fields and Table 2 reports the journal of observations.
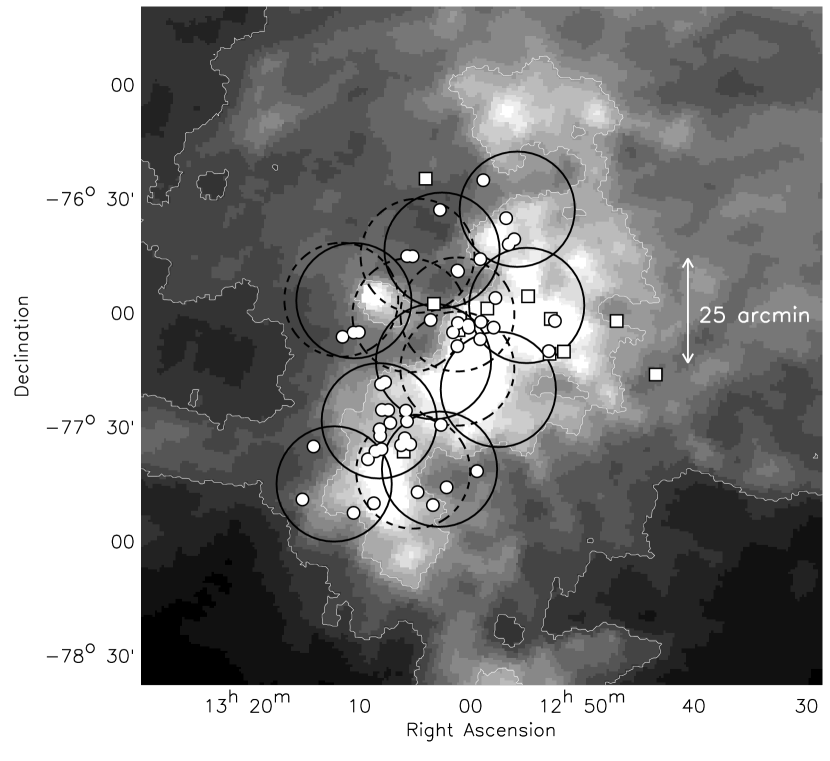
Despite the relatively large circular field of view of FLAMES, with approximately 25 arc-min in diameter, it was not possible to assign a large number of fibers in each configuration to the PMS objects and candidates because of the rather scattered distribution of the objects throughout the entire Cha II region (see Figure 1); on average it was possible to assign only some 5-7 fibers to the main targets per configuration and in some cases even only 1 or 2. Therefore, it was necessary to observe several fields in order to cover as many PMS objects and candidates as possible. The rest of the fibers in each configuration were assigned to a few other proposed candidates (see next section), but most were randomly assigned to field stars. Although these latter observations are not complete in flux666The magnitude limit of FLAMES in our GIRAFFE-MEDUSA set-up is of the order of R=17.5 and most of the observed objects are brighter than R=17., they allowed to have a check sample and, at the same time, to search for possible Class III objects, i.e. objects with no prominent infrared excess emission, that might have escaped detection in previous surveys. In this sense, our multi-object spectroscopic observations can be considered as an “unbiased” Lithium survey. The number of fibers assigned to the PMS objects and candidates and to the field stars are reported in Table 2. Note that the magnitude limit of the much higher resolution FLAMES/UVES set-up for a S/N10 is 14 mag; UVES fibers were then assigned to the brightest PMS objects and candidates in our sample.
The typical exposure time per configuration was 3000 sec and, during the first run, several fields were observed twice or more in order to clean cosmic rays and increase the S/N of the spectra, which is always better than 20 (see Table 1).
Bias, dark, flat-field and wavelength calibration lamp templates were acquired daily under the FLAMES standard calibration plan (Melo et al., 2007). The data reduction, which includes the removal of instrumental signatures (i.e. pixel-to-pixel sensitivity variations, determination of relative fiber-to-fiber transmission, fiber localization, fiber spatial PSF modeling, etc) and the wavelength calibration, was performed with the on-line FLAMES pipeline (Melo et al., 2007), whose products are quite sufficient for our goals. Additional steps for the extraction of the one-dimensional spectra and sky-spectrum subtraction were performed using the apall package under IRAF. The resulting spectra were not calibrated in flux. Finally, each one-dimensional spectrum was normalized to the continuum by a low-order polynomial fit on the regions of the spectrum free of absorption lines. The sampling of the data is 0.2 Å/pix for GIRAFFE-MEDUSA spectra and 0.02 Å/pix for UVES spectra.
3 Confirmed PMS objects and candidates
In total, 41 out the 62 PMS objects and candidates reported in Paper I were observed with FLAMES (30 with GIRAFFE-MEDUSA and 11 with UVES), all of which show the Lii line in absorption. Most also display H in emission. The 41 objects are flagged in Table 1 according to their observation. Fourteen of these objects have been confirmed as Cha II members for the first time, while Lii has been detected for the first time in many of the previously known members (e.g. the H objects by Hartigan, 1993, and several other IRAS sources). Among the 21 PMS objects and candidates not observed with FLAMES, 10 were known to have signatures of genuine PMS objects or they have been spectroscopically confirmed as members in previous works. We now briefly discuss these objects: i) Three are the Class I sources IRAS 12500-7658, ISO-CHA II 28, and IRAS13036-7644 (BHR 86) discussed in Paper I. The former is too faint for FLAMES spectroscopy and the latter two are not visible in the optical; ii) Another three, namely SSTc2d J125758.7-770120, SSTc2d J130540.8-773958, and ISO-CHA II 13 are sub-stellar objects, which are also too faint to be observed with FLAMES. These objects were spectroscopically confirmed as Cha II members by Alcalá et al. (2006) and Allers et al. (2007) on the basis of their very late-type spectrum coupled with strong IR excess and signatures of a high level of activity; iii) The other four stars are Sz48NE, Sz49, Sz60E, Hn22. The former three have been spectroscopically confirmed as members of Cha II by Hughes & Hartigan (1992) using the same criteria as for our observations, i.e. Lii line in absorption and late-type spectra, while Hn22 has been detected as a strong H emitter by Hartigan (1993). The SED of these 10 objects is typical of PMS stars with IR excess emission.
In conclusion, our sample of Cha II members includes all objects for which the Lii line has been observed in absorption, either in our follow-up spectroscopy or in previous studies, and those objects whose young nature is doubtless from their strong IR excess or spectral signatures of high level of activity. We consider as candidates those objects which already passed optical or c2d selection criteria based on the inspection of color-color and color-magnitude diagrams, but still lack spectroscopy to definitively assess their youth.
We then confirm that 51 out of the 62 objects reported in Paper I are definitely Cha II members, while spectroscopy is still needed for the 11 remaining objects. Note that three of them already passed the c2d selection criteria (see Table 7 of Paper I). The 51 confirmed members and the 11 candidates are flagged in Table 1 with “PMS” and “CND”, respectively. Table 1 reports also the H (EWHα) and Lii (EWLiI) equivalent widths of the confirmed PMS objects, which were measured in the background-subtracted and continuum-normalized spectra using a Gaussian fitting of the line profile. The continuum was defined by fitting a low order spline to a pre-selected spectral region between the H and Lii lines. For this purpose we used the 20Å continuum window between 6680 and 6700Å, which is not affected by strong lines in K/M type objects. Our EWLiI measurements agree within 0.15Å with those reported by Hughes & Hartigan (1992) for the previously known Cha II members. Note that such RMS difference is mainly dominated by the EWLiI errors resulting from the Hughes & Hartigan (1992) low-resolution spectra, which are on the order of 0.1-0.15Å.
Note also that the EWLiI values of the confirmed PMS objects are typical of low-mass PMS stars in other star-forming regions (0.3-0.8Å; Leone, 2007, and references therein). Though the strength of the Lii line and the relative uncertainty are expected to vary with spectral type, the EWLiI values in our sample are stronger than those measured for Pleiades stars of the same spectral type. This criterion is widely used to single out bona-fide low-mass PMS stars (Covino et al., 1997a; Martín & Magazzù, 1999; Wichmann et al., 2000; Alcalá et al., 2000a).
In Figure 2 examples of FLAMES spectra of 20 objects selected as PMS candidates are shown; among them we show the 14 members confirmed for the first time. The strong Lii 6708 Å absorption is clearly visible, with most of them displaying H in emission. Among the 20 spectra, we also show six lacking the Lii line; these are 2MASS 12560549-7654106, 2MASS 13102531-7729085, WFI J12591881-7704419, WFI J12592348-7726589, WFI J13014752-7631023, and WFI J13071960-7655476. The former two were proposed as member candidates by Young et al. (2005) but both were rejected on the basis of the optical criteria by Spezzi et al. (2007); note that these two objects show H in absorption. The latter four were selected by Spezzi et al. (2007) with two of them displaying H emission, all this in agreement with the H photometric index for these objects reported by Spezzi et al. (2007). Because of the definitive lack of Lii absorption, these six sources are not PMS objects and are thus unrelated to Cha II. Note that about 50% of the candidates reported by Spezzi et al. (2007) in their Table 6 are spectroscopically confirmed to be Cha II members, in line with their conclusions.
Several of the spectroscopically confirmed PMS objects show the He I 6678 Å line in emission. This line is the singlet counterpart of the He I 5876 Å and indicates strong chromospheric activity, consistent with the young age of these objects. Moreover, the different H emission line profiles, typical of PMS stars, can be appreciated. For instance, both IRAS F12571-7657 and SSTc2d J130521.7-773810 show strong H emission and may well be cases of veiled objects. Moreover, the spectrum of SSTc2d J130521.7-773810 exhibits the [NII] and [SII] forbidden emission lines at 6584 and 6731. As shown in Paper I (Figure 7), these two objects show substantial IR excess in their SEDs.
The presence of strong Lii absorption and the weak H emission in the spectrum of ISO-CHA II 29 allow us to classify this object as a weak-line T Tauri star. This, together with its peculiar spectral energy distribution, which rises beyond 24 m (see Paper I), confirms ISO-CHA II 29 as a “transition” object.
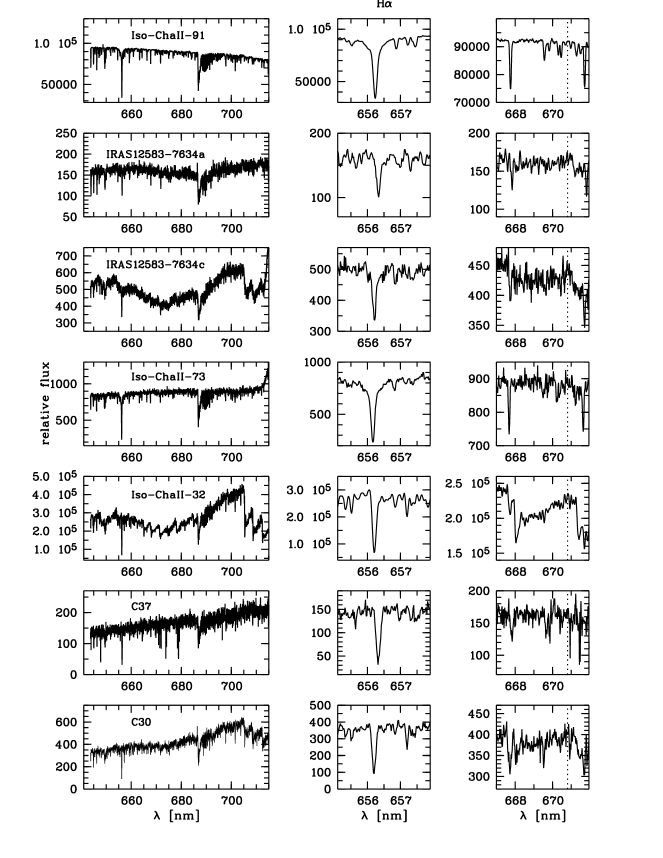
Several other objects, proposed as possible members in previous works (Vuong et al., 2001; Persi et al., 2003; Young et al., 2005; Spezzi et al., 2007), were also observed, but not confirmed as members (see Table 3). For instance, ISO-CHA II 73, ISO-CHA II 110, ISO-CHA II 32, ISO-CHA II 91, already rejected by the Spezzi et al. (2007) optical criteria, have neither Lii nor H emission in their spectra. The spectra of these objects are typical of K-M giants unrelated to Cha II (cf. Figure 3). For our purposes, this type of objects are then counted as field stars in Table 2.
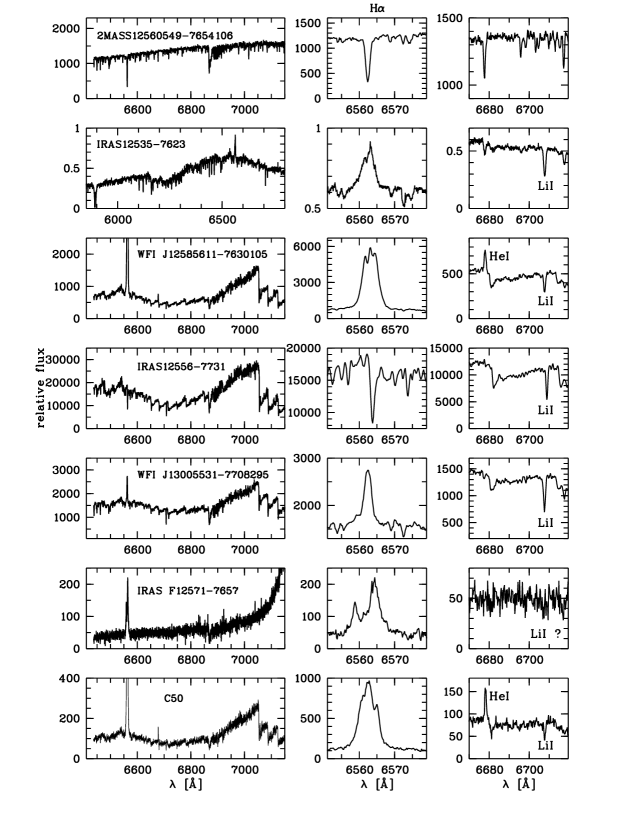
![[Uncaptioned image]](/html/0802.4351/assets/x3.png)
Fig. 2 - Continued
![[Uncaptioned image]](/html/0802.4351/assets/x4.png)
Fig. 2 - Continued
![[Uncaptioned image]](/html/0802.4351/assets/x6.png)
Fig. 3 - Continued
The fraction of Class II to Class III objects in ChaII is the largest in the whole c2d cloud sample. Unlike other T associations, the PMS population in Cha II appears dominated by Class II sources (60%), which outnumber Class III sources by a factor 2 (see Table 1 of Paper I).
An important result of our FLAMES observations is that no new Class III PMS objects were found among the 2000 field stars observed. All these stars lack detectable Lii or Hα emission in their spectra. By using the catalog of optical sources in the Cha II direction by Spezzi et al. (2007), we estimate that these 2000 stars represent 30% of the total field stars with 17.5 in the area covered by our FLAMES observations. Therefore, unless all the Class III sources are located behind the cloud, which is very unlikely, this result supports the completeness of the sample of PMS objects and candidates reported in Paper I.
4 Stellar parameters
With the sample of certified PMS objects and candidates, we can proceed to their characterization. In this section we outline the procedures used to determine the physical parameters.
4.1 Spectral types
A spectral type was assigned to each observed PMS star in Cha II by using a variation of the ROTFIT code developed by Frasca et al. (2003) under the IDL environment. The general idea of the method is to recover the spectral type of an object by comparing its spectrum with a grid of templates with similar resolution. To this aim, the intermediate-resolution standard templates provided by Martín et al. (1999), Hawley et al. (2002), Le Borgne et al. (2003), Valdes et al. (2004), and Bochanski et al. (2007), as well as the high-resolution standard libraries from Cincunegui & Mauas (2004) and Bagnulo et al. (2003) were used to perform the spectral type classification of the GIRAFFE-MEDUSA and UVES spectra, respectively.
As demonstrated by many authors (Luhman & Rieke, 1999; Luhman et al., 2003; Guieu et al., 2006; Gandolfi et al., 2007), because of the presence of TiO and VO absorption bands which are sensitive to the surface gravity, most of the M-type PMS objects show spectroscopic features that can be better reproduced by averaging dwarf and giant spectra with the same spectral type. Thus, in performing the spectral type classification of the young objects in Cha II, both dwarf and giant templates were included in our grids of reference spectra. Furthermore, for spectral types later than M0, we also included ad hoc templates obtained by averaging the collected spectra of dwarfs and giants with the same spectral type.
The template spectra were first normalized to the continuum through a low-order polynomial fit, in the same way as the target spectra (cf. § 2.2). The standard spectra were then shifted in wavelength to the radial velocity of the target. Finally, a chi-square minimization procedure was applied to choose the template that best fits the observed spectrum.
From an inspection of the residual we estimated an accuracy on the resulting spectral types within one spectral sub-class for objects earlier than K7 and about half spectral sub-class for later objects.
We could perform a reasonable spectroscopic classification for all the sources observed with FLAMES, except for Sz 47, IRAS F12571-7657 and SSTc2d J130521.7-773810. The former object was classified as M0 by Hughes & Hartigan (1992), but we observe signatures of a much earlier spectral type; for instance, a strong He I 6678 Å line in absorption and a rising continuum with shorter wavelength. Already in the low-resolution spectrum presented by Hughes & Hartigan (1992) the He I absorption is clearly visible. Such spectral features resemble those of an early type object. This effect might be due to the strong interaction of the star with the disk. In fact Sz 47 is another case of veiled star in Cha II. The spectra of IRAS F12571-7657 and SSTc2d J130521.7-773810 are rather noisy and although we manage to perform a fit of a K3 and K6 templates respectively, from the almost pure-continuum appearance of their spectra, they may be classified as continuum-type or “C-typ” objects.
The spectral types are provided in Table 1. Hughes & Hartigan (1992) reported spectral types for 20 stars in Cha II; 17 of these were observed by us with FLAMES. In most cases, we find a good agreement of the spectral types reported by these authors within one spectral sub-class. In a few cases (e.g. Sz 47 and Sz 62) larger residuals, up to two spectral sub-classes, are found. For these objects the spectral type determination becomes more uncertain because of veiling.
Among the sample of spectroscopically confirmed PMS objects there are some with spectral types M5 or later, which correspond to objects very close or below the Hydrogen burning limit. These include objects confirmed in this work and two very low-mass BDs discovered by Allers (2006). For the latter we adopt the spectral types and temperatures recently determined by Allers et al. (2007). Further discussion of these objects is presented in § 5.
4.2 Effective temperatures
For the confirmed PMS objects, the effective temperature (Teff) was determined by using the tabulations of temperature as a function of spectral type proposed by Kenyon & Hartmann (1995) and Luhman et al. (2003). Consistently with our spectral classification, the dwarf temperature scale by Kenyon & Hartmann (1995) was considered for objects earlier than M0, while for later objects we adopted the tabulation by Luhman et al. (2003), which is intermediate between dwarf and giant scales. The errors on Teff were estimated considering a mean uncertainty of one sub-class on the spectral type classification.
A different approach was followed for the objects lacking spectroscopy. In these cases, the effective temperature and extinction were simultaneously derived by fitting a grid of reference SEDs to their SED, as prescribed by Spezzi et al. (2007), but using the Weingartner & Draine (2001) extinction law (see also § 4.3). To this aim, we used the observed fluxes presented in Paper I and restricted the fit to the short-wavelength portion of the SED (), which is less contaminated by possible IR excess. When possible, these temperature values were also checked by using the Teff vs. () calibration relation determined by Spezzi et al. (2007); the ESO-WFI () color index is sensitive to the effective temperature for very cool objects (2000 KT3800 K) because the medium-band filter centred at 856 nm covers important TiO absorption features that deepen with decreasing temperature, while the one centred at 914 nm lies in a wavelength range relatively featureless in late-type objects. In the case of high interstellar extinction (A5 mag) the temperature derived from this relation may be underestimated because the () index becomes larger than in the absence of extinction. The two methods yield consistent results and turn out to be accurate within 200 K relative to the spectroscopic temperature estimated for the objects observed with FLAMES.
The effective temperatures for PMS objects and candidates in Cha II are reported in Table 4.
4.3 Extinction
The extinction has been determined for each individual PMS object using the relation obtained from the extinction law by Weingartner & Draine (2001) for RV=5.5 (hereafter WD5.5); indeed, investigations on the properties of the interstellar medium in the Chamaeleon clouds have demonstrated that the RV ratio is unusually high (i.e. =5-6) in the densest parts of the clouds (Covino et al., 1997b; Luhman, 2006). For details on this issue we refer the reader to Paper I. The color excess was derived from the compilation of colors as a function of spectral type proposed by Kenyon & Hartmann (1995) and Luhman et al. (2003) for spectral types earlier than M1 and later than M0, respectively. The spectral types determined as explained in § 4.1 and reported in Table 1 were used to this aim. For objects lacking the or band magnitudes, also because of saturation, we used the intrinsic color versus spectral type relation by Kenyon & Hartmann (1995), and determine the extinction as , also using the WD5.5 extinction law. This was the case for some IRAS sources which are very bright also in the optical (see § 4.5). This latter approach was also used for C 41 and Sz 49, for which the color is strongly affected by the intense H emission and veiling. The uncertainties on , derived from the uncertainties on spectral classification, range from 0.1 to less than 1 mag.
For the objects lacking spectroscopy, the and Teff values were derived simultaneously following the SED minimization procedure prescribed by Spezzi et al. (2007). We used the observed fluxes presented in Paper I and also adopted the WD5.5 extinction law. As shown in Spezzi et al. (2007), this method provides values consistent with those derived from spectroscopy within 1.5 mag. Such uncertainty translates into an average uncertainty of 0.15 dex in the logarithm of luminosity for the PMS candidates in Cha II.
The extinction at each wavelength, , has been then determined both for the PMS objects and the candidates also using the WD5.5 extinction law. As discussed in Paper I, our extinction determinations are in general agreement with the values reported by the large-scale extinction maps of the Cha II cloud.
4.4 Stellar luminosities
Because of the presence of circumstellar material, the SEDs of young objects may be affected by the presence of IR excess and hot continuum emission from the boundary layer between the disk and the central star, whose intensities depend on the evolutionary stage of the star. In order to separate the properties of the central star alone and the disk, their contributions to the “total” luminosity of the system must be determined.
The “total” luminosities of the young objects in Cha II, obtained by direct integration of the dereddened SEDs, have been already reported in Paper I. In that paper we concentrate on the disk contribution, which provides an interesting diagnostic for the study of the accretion activity of PMS objects. Here we focus on the contribution of the central star alone, which allows us to place the Cha II members and candidates on the HR diagram and hence derive their masses and ages. The stellar luminosities and radii for the Cha II population were computed following the procedure described in Spezzi et al. (2007). We compared the dereddened SED of each object with a reference SED of the same temperature scaled to the Cha II (catalog ) distance (d=178 pc, Whittet et al., 1997). The grid of reference SEDs was built using the model spectra by Hauschildt et al. (1999) and Allard et al. (2000) as explained in Spezzi et al. (2007). By minimizing the flux differences between the dereddened SED and the reference one, we determine the stellar radius (R⋆) and hence, the photospheric luminosity (L⋆). The minimization procedure was performed, as above, on the short-wavelength portion of the SED (), in order to avoid contamination from possible IR excesses. Errors on luminosities have been estimated taking the uncertainty on spectral classification and extinction (i.e. 1 and 2 spectral sub-class for objects with and without spectroscopy, respectively), as well as on the distance to Cha II (20 pc; Whittet et al., 1997) into account. We also checked that using extinction laws other than the WD5.5, such as those by Savage & Mathis (1979) and Cardelli et al. (1989), does not affect significantly our luminosity estimates. The R⋆ and L⋆ values and relative uncertainties are reported in Table 4.
4.5 HR diagram
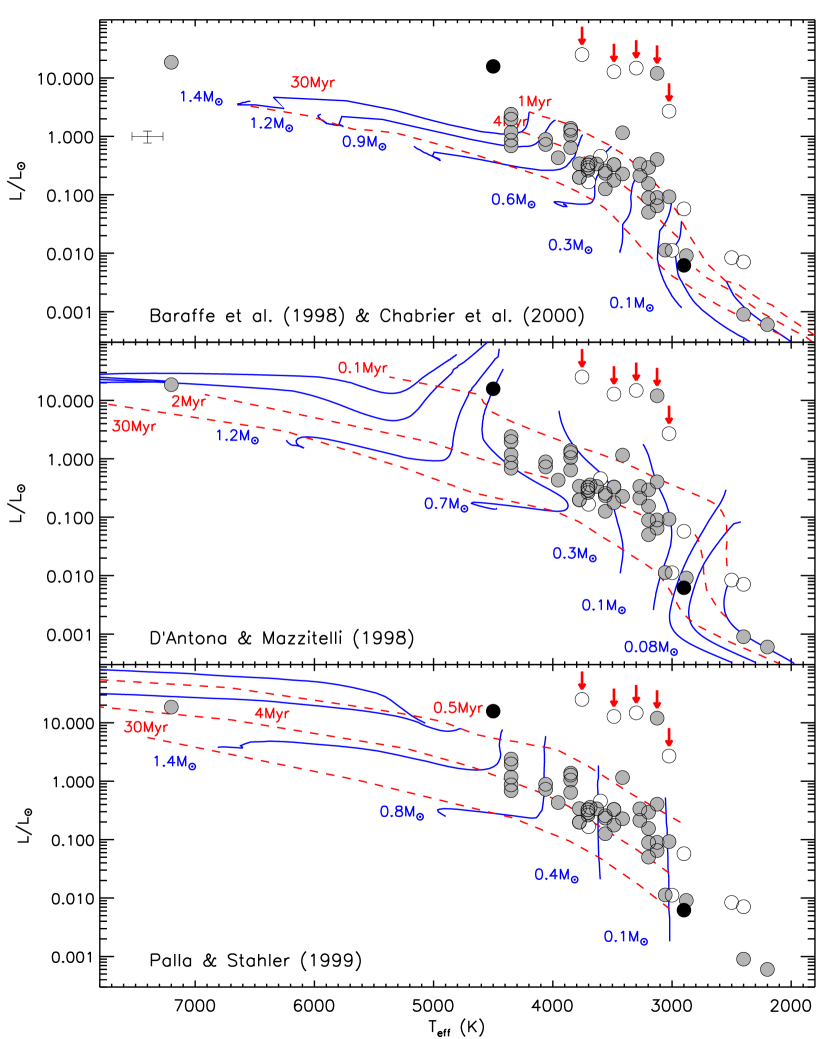
The positions on the HR diagram of the PMS objects and candidates in Cha II are presented in Figure 4 over-plotted on three sets of evolutionary tracks. Except for a few cases discussed next, the vast majority of the confirmed PMS objects and candidates fall in regions of the HR diagram consistent with very young objects (age4 Myr), down to the BD regime. The luminosity and temperature of five objects are, however, inconsistent with those of PMS stars in Cha II; these objects are marked with arrows in Figure 4 and correspond to the five IRAS sources discussed in § 5.4 of Paper I. These sources are IRAS12416-7703, IRAS12448-7650, IRASF12488-7658, IRAS12556-7731 and IRAS12589-7646, which would be over-luminous in the HR diagram. Note that one of these, i.e. IRAS 12556-7731, has been spectroscopically confirmed to be a PMS object (§ 3). Possible reasons for the inconsistent position of these objects on the HR diagram may be an erroneous estimate of temperature and consequently of extinction. It is worth to mention, however, that all these IRAS sources are very bright () and are saturated in the and band WFI images (c.f. Spezzi et al., 2007). As explained in § 4.3, the extinction in these cases was determined on the basis of the color index. Note that none of the five IRAS sources show very strong IR excess, with most of them expected to be Class III sources. Therefore, the methods applied here to determine their temperature and extinction are reliable. In addition, the visual extinction for these objects is less than about 4 mag. Note that at least in the case of IRAS12556-7731, the spectral type and temperature are fairly well constrained from its spectrum. Yet, this object is over-luminous at the same degree as the other four IRAS sources.
Interestingly, while being scattered in the region (see Figure 10 in Paper I), the five IRAS sources seem to follow the form of an isochrone on the HR diagram. Thus, another possible explanation for the inconsistency may be that the distance for these five IRAS sources has been overestimated. In order for them to have a position on the diagram consistent with PMS objects (age4 Myr), their distance should be on the order of 30 pc. Alternatively, they could be foreground dwarfs, unrelated to Cha II and the apparent IR excess by which some of them were selected might simply be due to cool companions. More spectroscopic data are necessary in order to shed light on the nature of these outliers. The immediate consequence is that their mass and age cannot be determined here.
4.6 Masses and ages
We have derived masses and ages of the Cha II members and candidates by comparison of the location of the objects on the HR diagram with the PMS tracks by Baraffe et al. (1998) & Chabrier et al. (2000), D’Antona & Mazzitelli (1998) and Palla & Stahler (1999). Since stellar evolutionary models are rather uncertain, particularly in the low-mass and sub-stellar regimes, the use of different evolutionary models allows us to estimate the uncertainties of the stellar parameters due to modeling alone. In Table 5 we report the masses and ages for all the confirmed Cha II members and candidates whose position on the HR diagram is consistent with membership to the cloud.
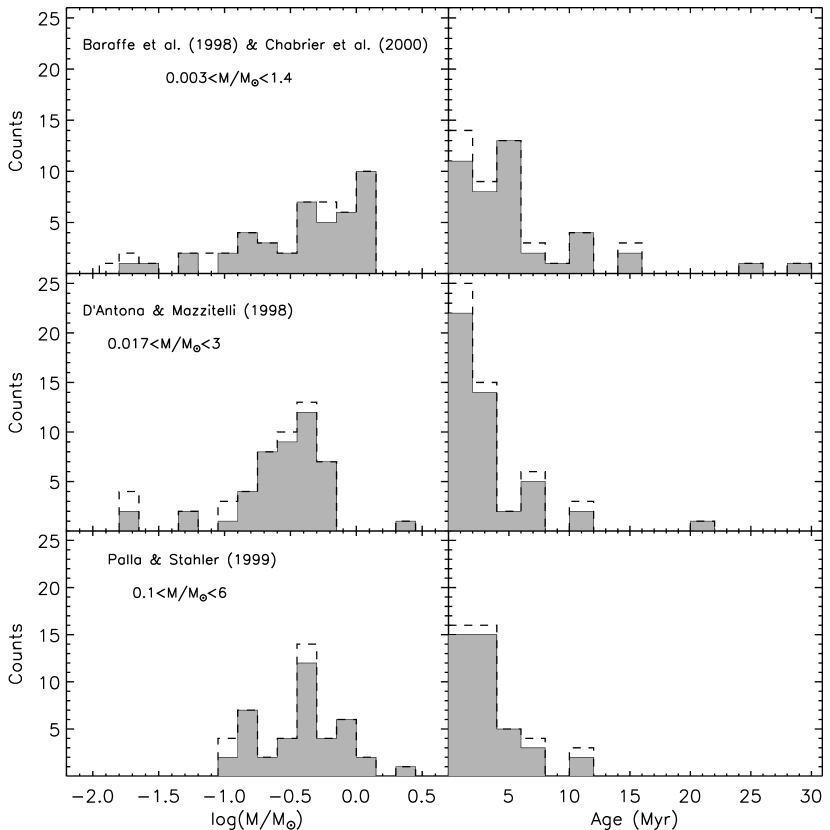
Most of the Cha II PMS members have masses in the range ; IRAS 12496-7650 (DK Cha) is the only intermediate mass star in the cloud. The mass distribution of the Cha II members, which is shown in Figure 5 (left panel), peaks between 0.3 and 0.4 and the mean mass ranges from 0.4 to about 0.6 , depending on the adopted evolutionary track (c.f. Table 6). The resulting average mass is 0.50.1 , with the error representing the uncertainty due to modeling. It is important to note that these values are basically the same when including the candidates. Note also that the resulting values for the YSOs alone, also reported in Table 6, fall in the same range. The average mass is similar to the values obtained for Cha I (0.45 ) and Taurus (0.50 ) populations777In order to compare these values, we have consistently derived the average mass of the young populations using data by Luhman (2004) for Cha I and Briceño et al. (2002) for Taurus, respectively., indicating that a value of the order of 0.5 might be a characteristic average mass for objects in T associations.
The age distributions, resulting from the adopted models, are presented in the right panels of Figure 5. The vast majority of PMS objects and candidates are younger than 4 Myr. The mean age of the Cha II population ranges from 3 to 6 Myr depending on the adopted model (Table 6). Independently of whether or not the candidates are included, the average age is 42 Myr with the error coming from the modeling alone. Within the uncertainties, this value is in agreement with that derived by Cieza et al. (2005). The mean age for the YSOs alone, also reported in Table 6, is lower (2 Myr), though not significantly; this is expected since objects with strong IR excess are representative of an earlier evolutionary phase.
The majority of the objects have ages of 3-4 Myr, depending on the models. Therefore, star formation proceeded in a short time, producing a coeval population. If the star formation in Cha II occurred very recently, say within the last Myrs, the circumstellar disks of the PMS objects in this region may have not yet had the time to evolve into optically thin disks. In other words, this may indicate that star formation in Chamaeleon has occurred rapidly a few million years ago.
4.7 Stellar parameters for Class I sources
The analysis of the IR properties of the young population in Cha II presented in Paper I shows that only three Class I sources exist in the cloud, namely IRAS 12500-7658, IRAS 12553-7651 (or ISO-CHA II 28) and IRAS 13036-7644 (or BHR 86).
In these cases we can not apply the above procedures for the determination of the stellar parameters. Indeed, the large extinction coupled with strong IR excess due to the thick envelope/disk, makes it difficult to disentangle the properties of the central object from those of the circumstellar regions. Since most of the emission of Class I sources is in the IR, one way to determine their properties is by fitting a disk accretion model to their SED. From such fit it is possible to provide an estimate of the temperature and other physical parameters of the central object. This has been done for the Cha II Class I sources in Paper I by using the SED models for young stellar objects by Robitaille et al. (2006). Thus, for IRAS 12500-7658 and ISO-CHA II 28 we report in Table 4 the values obtained in Paper I, which have been also used to place them on the HR diagram (c.f. Figure 4). For IRAS 13036-7644 the SED modeling results are unreliable because it is not detected neither in the optical nor in the near-IR; this object has been matter of focused c2d observations which will be presented in a future paper.
We warn the reader that ISO-CHA II 28 is not detected in the optical and only a flux upper limit is available in the -band from the 2MASS catalog. Thus, visual extinction and other stellar parameters resulting from the SED modeling must be taken with care.
The stellar parameters estimated for IRAS 12500-7658 point toward a very cool low-mass object. Since this object has been detected in the optical survey by Spezzi et al. (2007), we could independently estimate its stellar parameters using the techniques described in Spezzi et al. (2007). The WFI () index of IRAS 12500-7658 indicates an effective temperature of 3000200 K. Assuming this temperature, we estimate a visual extinction A, an object luminosity of 0.0067 L⊙, an integrated luminosity of 0.9 L⊙ and a stellar mass of about 0.06 M⊙. These values are roughly consistent with those derived by using the Robitaille et al. (2006) disk models. However, we remind that the effective temperature estimates from the WFI () index may be significantly affected by extinction, therefore they are rather uncertain.
5 Objects near and below the sub-stellar limit
There are several objects which fall close to or below the Hydrogen burning limit. Three, namely SSTc2d J125758.7-770120, ISO-CHA II 13, and SSTc2d J130540.8-773958, are spectroscopically confirmed to be sub-stellar (Jayawardhana & Ivanov, 2006; Alcalá et al., 2006; Allers et al., 2007)888Note that for ISO-CHA II 13 Allers et al. (2007) derived a slightly higher temperature than used here. Since the average temperature derived from the values reported by Alcalá et al. (2006) and Allers et al. (2007) still places the object in the BD domain, we consider it as sub-stellar., while four (WFI J12533662-7706393, WFI J12583675-7704065, WFI J13005297-7709478 and WFI J13031615-7629381) are candidates to be sub-stellar.
On the other hand, five sources (C41, C50, C62, C66 and WFIJ12585611-7630105) are spectroscopically confirmed to be very low-mass PMS stars close to the Hydrogen burning limit, while the temperature estimate of IRAS12500-7658 is consistent with an object close to this limit (§ 4.7).
Considering only the certified PMS objects, the fraction of sub-stellar objects relative to PMS stars would be on the order of 6%, i.e. lower than in other T associations. It is clear that this result may change slightly because of the fact that several of the objects fall just above or below the Hydrogen burning limit and because of the uncertainties in spectral types and of the difference in the adopted PMS evolutionary models. In whatever case, the fraction may be slightly lower than, but very close to the values reported for other T associations (12-14%, Briceño et al., 2002; López Martí et al., 2004) and lower than derived for OB associations (26%, Hillenbrand & Carpenter, 2000; Briceño et al., 2002; Muench et al., 2002, and references therein). This points toward a sub-stellar IMF for Cha II similar to that found in other T associations. More discussion on the Cha II IMF is deferred to § 6.1.
6 The star formation in the Chamaeleon II dark cloud
Fundamental physical parameters, i.e. mass and age of the individual PMS objects, have been now determined; moreover, as discussed in Paper I, the census of Cha II members is rather complete down to the sub-stellar regime (, Alcalá et al., 2008). Then, the implications on the star formation in the cloud can be investigated on the basis of usual quantities such as the star formation efficiency, the trend of the mass spectrum and the star formation rate. Some aspects of the star formation history of the cloud are also discussed.
6.1 A first guess on the IMF in Cha II
Despite the considerable theoretical and observational work establishing the general form of the IMF (Scalo, 1986, 1998; Kroupa, 2001, 2002; Reid et al., 2002; Chabrier, 2003), the question whether there are differences in the IMF under different star-forming conditions is still an open issue. This is particularly controversial in the very-low mass and sub-stellar regimes. Recent studies (Hillenbrand & Carpenter, 2000; Luhman et al., 2000; Briceño et al., 2002; Preibisch et al., 2003; Muench et al., 2003) show that the IMF remains approximately flat or shows a moderate decline in the BD regime. Nevertheless, there is no systematic indication of such a turnover. Other regions have been found where the IMF appears to rise below the sub-stellar limit (Hillenbrand & Carpenter, 2000; Luhman et al., 2000; Briceño et al., 2002; Preibisch et al., 2003; Muench et al., 2003).
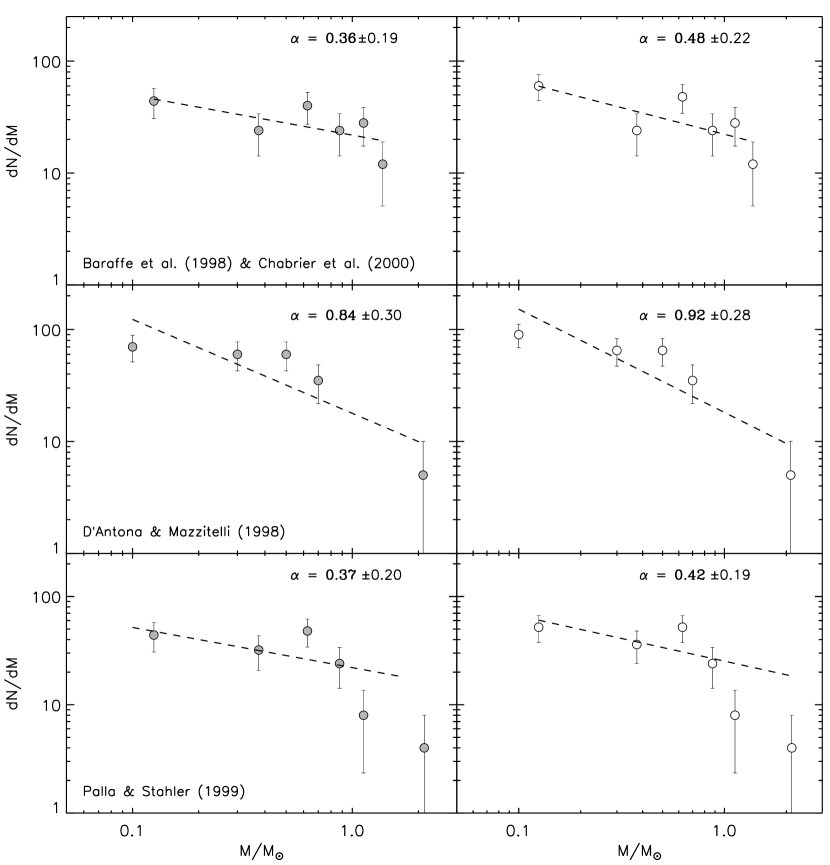
As mentioned in previous sections, recent investigations and this work provide a PMS population in Cha II which is basically complete. Although some of the candidates still lack spectroscopic confirmation, this census is useful for a first inspection on the mass spectrum of the region. By assuming that all the candidates are true Cha II members, we attempted the IMF determination by using the approximation for the low-mass end of the mass function, (Moraux et al., 2003), adopting mass bins of 0.2 (c.f. Figure 6); this value is larger than the accuracy on mass estimates derived from the uncertainties on temperature and luminosity and, at the same time, allows to have a statistically valid number of objects at each bin. The value of the slope varies between 0.4 and 1 depending on the adopted evolutionary tracks. The resulting average value in the mass range is =0.5-0.6 depending on the inclusion of the candidates (see Figure 6).
Despite the problems arising mainly from the still uncertain nature of some of the candidates, as well as from the presence of unresolved binaries, our estimate of the IMF slope in Cha II is fairly consistent with the IMF slopes measured in other the T associations (c.f. López Martí et al., 2004; Comerón et al., 2000; Briceño et al., 2002) and also matches those derived for several star clusters under very different age and formation history conditions (c.f. Barrado Y Navascués et al., 1998; Moraux et al., 2003; Béjar et al., 2001; Luhman et al., 2000; Tej et al., 2002)999We stress that in order to draw this conclusion, we have homogeneously determined the slope of the IMF in the other star forming regions using the same sets of evolutionary tracks.. Thus, notwithstanding the uncertainties and low statistics, our first IMF study in Cha II gives further evidence of the stellar IMF being roughly invariant down to the Hydrogen burning limit.
The binary star fraction (BSF) in Cha II is expected to be on the order of 13-15% (Brandner et al., 1996; Köhler, 2001; Alcalá et al., 2008) and does not significantly affect the shape of the IMF. By assuming a BSF=15% and a uniform distribution of this fraction of unresolved binaries in the range 0.1-2 , we used the simulation of binary systems by Preibisch & Zinnecker (1999) to investigate their effects on the stellar positions in the HR diagram and hence, on the IMF. We estimate a variation of the slope to be 0.1, i.e. well within the uncertainty due to modeling.
Four of the seven objects (i.e. 60%) below the H-burning limit are not yet spectroscopically confirmed. Therefore, any concluding statement on the sub-stellar IMF in Cha II is still premature and must be deferred to the future, when the proposed sub-stellar candidates will be confirmed or rejected as members of the cloud. If all the sub-stellar candidates were confirmed as members, then the sub-stellar IMF in Cha II would be as in other T associations, otherwise it would have a significant drop, with only three sub-stellar members.
6.2 Star Formation Efficiency and Star Formation Rate
Average values of stellar masses and ages have already been used in Paper I to draw some conclusions on the Star Formation Efficiency (SFE) and Star Formation Rate (SF rate) in Cha II. In this section we investigate the global SFE and SF rate, but using the individual masses and ages of the members as estimated in § 4.6. Note, however, that the stellar mass could not be estimated for the five bright IRAS sources (see § 4.5) and for the two objects classified as “Continuum-type”, i.e. IRAS F12571-7657 and SSTc2d J130521.7-773810 (see § 4.1). Moreover SSTc2d J130529.0-774140 and IRAS 13036-7644 are not detected in optical and near-IR wavelengths and hence, their stellar parameters could not be determined. In performing the following calculations, we assumed for these nine objects the average mass, i.e. 0.5 . However, their inclusion does not affect the final results.
We derived the SFE as in Paper I, i.e. where is the cloud mass, and is the total mass in PMS objects. We use the estimate of the cloud mass (670 M⊙, see Paper I) as derived from the c2d extinction map with the 240 arc-sec resolution; other estimates are present in the literature which vary between 700 and 1250 M⊙ depending on the tracer molecule used. Considering the uncertainty on the cloud mass and on the total mass in PMS objects, which depends on the adopted evolutionary tracks (Table 6), we find that the SFE in Cha II ranges between 1-4%, regardless of the inclusion of the candidates. Lower values (1-2%) are found when considering the YSOs alone. A summary of the global SFE estimates is reported in Table 6. Our SFE results agree with previous estimates (1%, Mizuno et al., 1999) and match the typical value of a few per cent found for T associations (Mizuno et al., 1995; Tachihara et al., 1996; Mizuno et al., 1999). A considerably higher value for the Cha II cloud mass (i.e. 1860 M⊙) was reported by Mizuno et al. (2001) on the basis of a map of the cloud. Using this estimate, we obtain values around 1% for the SFE, which are still consistent with the range of values expected in T associations. Interestingly, the SFE in Cha II is lower than in Cha I (7-13%, Mizuno et al., 1999) and this may be a consequence of a different history of star formation in the Chamaeleon clouds, as discussed in Paper I.
The SF rate has been determined using the total mass of PMS objects and candidates in Cha II and their average age as reported in Table 6. We performed this exercise by using three different sets of evolutionary models and the results are summarized in Table 6. Considering the whole sample of PMS objects and candidates, we find that the Cha II cloud is turning some 82 into stars every Myr. The error depends on the uncertainty of the evolutionary models.
7 Disks vs. stellar properties
In this section we report possible links between the disk parameters and stellar properties. We use the disk parameters determined in Paper I, but we caution the reader that the relationships we find may be rather noisy because, despite the completeness of the sample, the number of sources in Cha II is low. Furthermore, disk masses are poorly constrained given the lack of data at mm wavelengths for the majority of the sources. In this sense, the results we discuss here should be considered as preliminary.
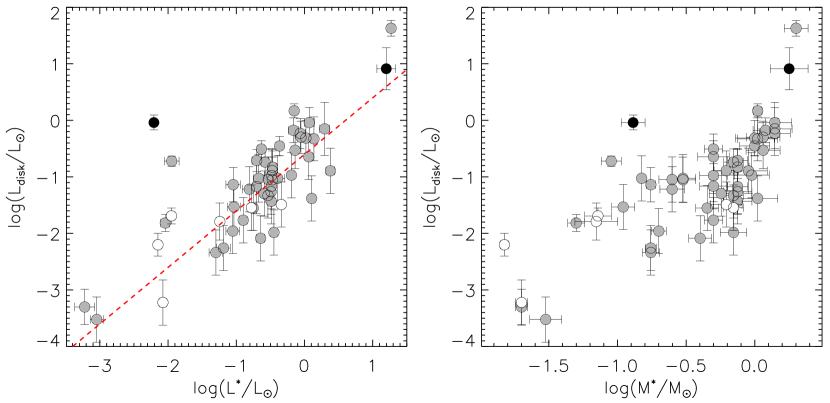
Figure 7 (left panel) shows the disk luminosity as a function of stellar luminosity; a trend for the disk luminosity to increase with the stellar luminosity is observed across more than 3 orders of magnitude in stellar luminosity. Though the relation is rather scattered, it seems to follow the relationship (dashed line in Figure 7), which can be interpreted as the luminosity of the disk deriving from reprocessed stellar light under the assumption of a flat, optically thick disk extending outward from the stellar surface (Allers et al., 2006). Note that the class I object IRAS 12500-7658 (black dot at in Figure 7) was not observed in our follow-up spectroscopy. Its stellar parameters are then uncertain and, in particular, its stellar luminosity might be quite underestimated.
The PMS mass-luminosity relation implies a secondary correlation between the stellar mass and disk luminosity. Such correlation (Figure 7, right panel) seems to extend to the very low mass regime. Thus, more massive stars possess more luminous disks and viceversa.
In Paper I the disk mass for several of the studied objects was estimated by modeling the SEDs with appropriate grids of circumstellar envelope/disk models (Dullemond et al., 2001; D’Alessio et al., 2005; Robitaille et al., 2006). For objects with masses greater than 0.1 there seems to be a very weak indication that more massive stars may have more massive disks. However, the relationship is very noisy. Because of the lack of millimeter data, the disk masses are not really well constrained, which may explain the large scatter in the possible correlation between disk mass and stellar mass.
Another study (Carpenter, 2002) found that, despite the similar stellar ages and conditions (i.e. no presence of high ultraviolet radiation fields), PMS stars in the IC 348 cluster possess less massive disks than those in Taurus (Beckwith et al, 1990; Skinner et al., 1991; Osterloh & Beckwith, 1995; Henning et al., 1998). In numbers, 14% of the PMS stars in Taurus with a mass M0.27 M⊙ have disks more massive than 0.025 M⊙, while none exceeds this limit in IC 348. Also in the Orion Nebular Cluster, Mundy et al. (1995) exclude the presence of massive disks (see also Williams & Andrews, 2006, and references therein), while submillimter data obtained by Andrews & Williams (2007) show that disk properties of the young population in the Ophiuchus dark cloud match those observed in Taurus. This difference in disk masses might be a consequence of the “clustered” star-forming mode with respect to the “isolated” one. However, this is not yet evident, given the limited sample of star forming regions for which millimeter continuum surveys are available. The disk masses given in Paper I are based on disk models and, hence, are highly uncertain. However, at first approximation, some 10% of the objects with M0.27 M⊙ have M0.025 M⊙, i.e. a percentage similar to that measured in Taurus.
8 H as accretion indicator
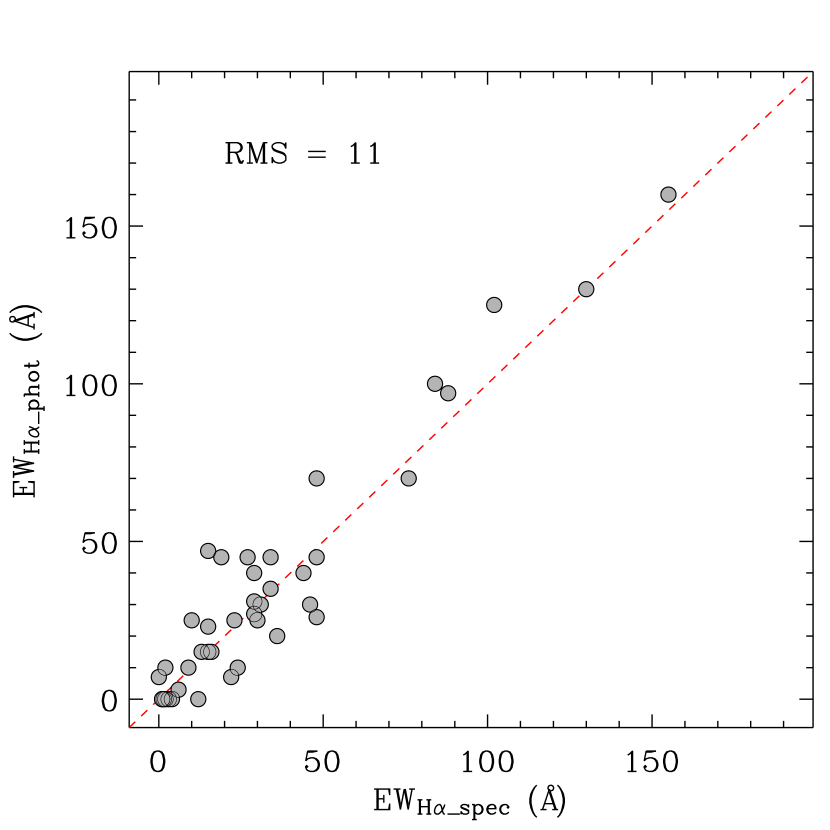
The presence of a strong H emission line in young objects is interpreted as a signature of the accretion process (Feigelson & Montmerle, 1999, and references therein). In this section we investigate the H properties of the Cha II stars in relation with other accretion and disk indicators derived on the basis of the Spitzer data reported in Paper I. The EWHα was measured on the spectra of the confirmed PMS objects in Cha II, while for the candidates we used the WFI () color index and the calibration relation between this index and the EWHα computed by Spezzi et al. (2007). As shown in Figure 8, this method yields results consistent with those obtained from spectroscopy when applied to the confirmed PMS stars within 10 Å.
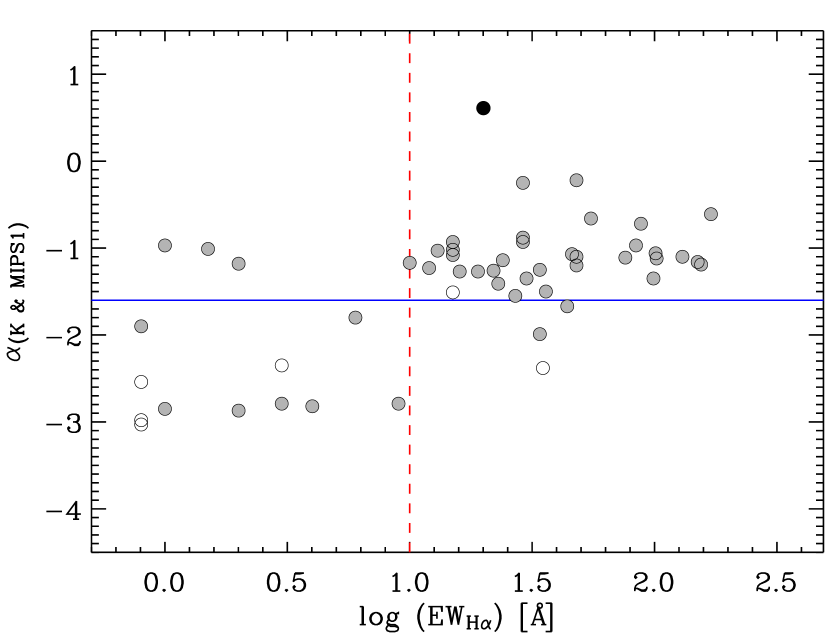
In Paper I we used the spectral index to investigate the different object classes according to the Lada et al. (2006) criteria. According to our definitions in Paper I, we found that some 70% of the PMS objects in Cha II are Class II sources, i.e. have a SED with spectral index 1.6. The dividing line between accretion and chromospheric H emission varies with spectral type (White & Basri, 2003; Lada et al., 2006). Using the definition by White & Basri (2003) to divide weak from classical T Tauri stars, we find that 72% of the objects in Cha II would be classified as classical, in perfect agreement with the spectral index criterion.
Figure 9 shows the H Equivalent Width (EWHα) as a function of for the PMS stars and candidates in Cha II. From this figure we find that more than 80% of the Class II sources (i.e. indicative of optically thick disk) have EWHα larger than 10 Å, while 75% of the Class III sources (i.e. indicative of thin or no disk) have weaker H emission. Here we use EWHα=10 Å as the approximate lower limit for accretion. Because the Cha II population mainly consists of late K and early M-type objects, in agreement with the definition by White & Basri (2003).
The trend in Figure 9 is consistent with that found in other regions (e.g. IC 348, Lada et al., 2006) and may suggest that the gaseous and dust components of disks evolve on similar timescales. The three objects with –1.6 but EW10Å are IRAS 12448-7650, Sz 47 and Sz 60W. IRAS 12448-7650 was not observed in our follow-up spectroscopy; its Teff and EW10Å are estimated from the WFI color indexes and hence are rather uncertain. Sz 47 and Sz 60W are confirmed cloud members, though the stellar parameters of Sz 47 are very uncertain (§ 4.1). For both these objects we have signatures of accretion (see later in this paragraph and Table 1) and they might then be cases where the disk has evolved but still substantial gas is present and accreting onto the central star.
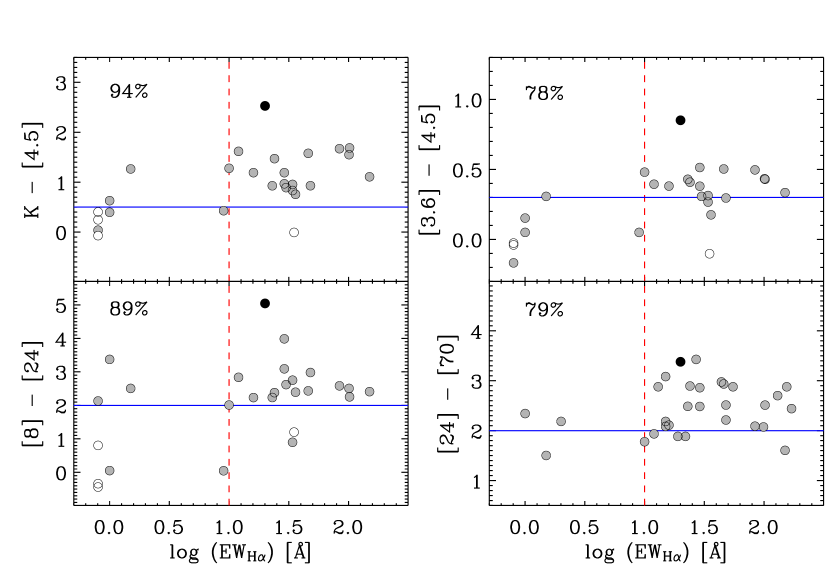
Being responsible for the IR excess emission, the presence of a dust disk can be traced by , i.e. a measure of the (-24m) color excess, as well as a number of other IR colors. Hartmann (1998) and Lada et al. (2006) have already shown that stars with strong H emission in Taurus and IC 348 tend to possess large () excess, or the equivalent () excess when using the Spitzer bands. We investigated the relation between the EWHα and a number of Spitzer colors for the PMS stars in Cha II in order to identify possible tracers of the accretion process.
In the upper-left panel of Figure 10, the color versus EWHα relation is shown; we found that more than 90% of the objects with EWHα above the approximate limit for accretion (i.e. 10 Å) also have 0.5, i.e. the minimum excess for Stage II objects (i.e. classical T Tauri stars) according to the models by Robitaille et al. (2006). Despite the low number of weak-line T Tauri stars in Cha II, some 70% of the objects with no prominent H emission have color falling below this limit. Thus, consistently with the results by Hartmann (1998) and Lada et al. (2006), we conclude that the color index is a useful diagnostic for accretion, with 0.5 mag the approximate threshold. Among the other color indexes inspected in the wavelength range covered by Spitzer (i.e. 3.6-70 m), we found that , and also tend to be larger for objects with stronger H emission. The correlation between these colors and the EWHα is shown in the other panels of Figure 10. As above, we consider the minimum color excesses, estimated by Robitaille et al. (2006) and Young et al. (2005) for Stage II objects, as approximate threshold for the accretion process. We found that the percentage of objects with EW10 Å and color excess above the fixed threshold varies between 80% and 90% depending on the considered color, while some 50-80% of the objects with weaker H emission have smaller colors. Since the emission at longer wavelengths is coming from farther out in the disk, the longer wavelength colors probably trace disk flaring, which may trace younger disks, which at the same time are more likely to be the high accretors. Because of the large scatter in the correlation between the EWHα and and the investigated infrared color indices (Figure 10), these indices can be used as overall indicators of accretion, but cannot replace detailed accretion studies in individual objects.
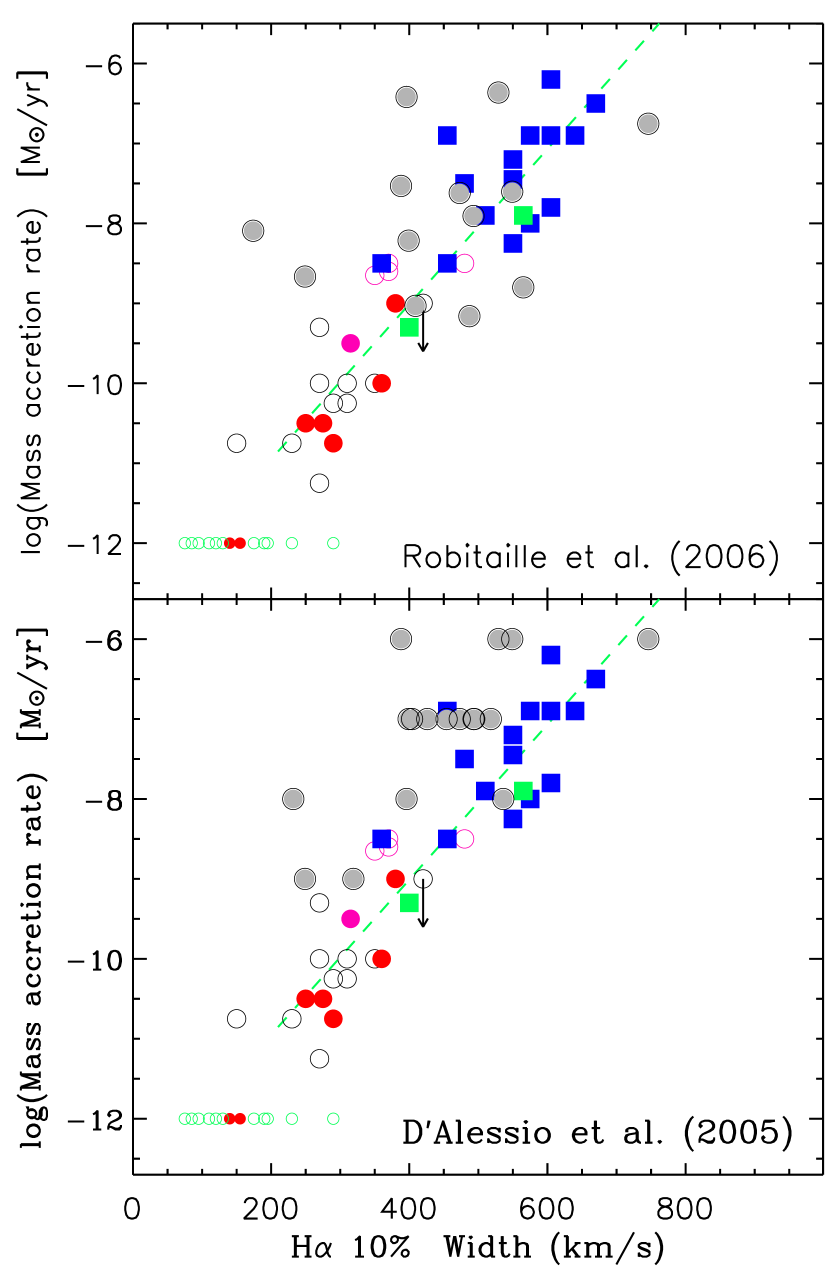
Another way to investigate the accretion diagnostics uses the width of Balmer emission lines. Natta et al. (2004) have shown that the observed width of the H line can be used not only to discriminate between accretors and non-accretors, but also to get an approximate estimate of the mass accretion rate (). Using our spectra and following the prescription by Natta et al. (2004), we determined the full width of H measured at 10% of the peak intensity (H 10%), after continuum subtraction, for the PMS objects in Cha II. Although our GIRAFFE-MEDUSA spectra have a resolution four times less than the one used by Natta et al. (2004), we can measure the width of the H line with an accuracy of some 10 Km/s. Figure 11 is a reproduction of Figure 3 by Natta et al. (2004). The dashed line represents the calibration relation determined by these authors. The grey dots represent the Cha II members; the H 10% was computed using our FLAMES spectra, as described above, while was derived by the fits of the disk accretion models by Robitaille et al. (2006) and D’Alessio et al. (2005) to the SEDs as reported in Paper I. A fair agreement with the Natta et al. (2004) data is found, but some objects show a larger scatter, possibly due to the lower resolution of our spectra with respect to those used by Natta et al. (2004). The H 10% for the PMS objects in Cha II and their as derived by using the calibration relation by Natta et al. (2004) are reported in Table 1.
9 Summary
We presented the spectroscopic follow-up of PMS objects and candidates recently selected in the Cha II dark cloud on the basis of the Spitzer c2d Legacy survey and complementary optical and near-IR data (Alcalá et al., 2008). We confirmed the PMS nature for 51 objects, which display the typical spectral signatures of young low-mass stars, i.e. Lithium absorption, H emission and a late-type spectrum, while 11 candidates still need spectroscopic investigation in order to assess their PMS nature. More than 96% of the observed c2d YSO candidates resulted in true Cha II members, supporting the reliability of the c2d selection criteria (Harvey et al., 2007; Evans et al., 2007).
The stellar parameters of the PMS objects and candidates have been determined. Most objects in Cha II have masses in the range . The average mass is 0.50.1 , with the error representing the uncertainty due to modeling. The mean age of the Cha II population ranges from 2 to 6 Myr depending on the adopted model. The average age is 42 Myr with the error coming from modeling alone. The average age drops to about 2 Myr when considering the YSOs, i.e. the IR-excess population selected from the c2d multi-color criteria. Seven objects (three confirmed plus four candidates) are sub-stellar and another five are confirmed to be very low-mass PMS stars close to the Hydrogen burning limit. In addition, the low luminosity ( 0.007) object detected in the optical and matching the position of the Class I source IRAS12500-7658 might also have a mass close to the sub-stellar limit or may be a highly extincted object.
Results on the global properties of star formation in Cha II are the following. The average value of the IMF slope bf (=0.5-0.6) in the mass range is fairly consistent with those measured in other T associations. Our first study of the mass spectrum in Cha II seems to provide further evidence for the stellar IMF being roughly the same as the field IMF down to the Hydrogen burning limit, but the results depend on the adopted evolutionary models.
The star formation efficiency of 1-4% is similar to our estimates for other T associations like Taurus and Lupus, but significantly lower than for Cha I (7%). This suggests that different star-formation activities in the Chamaeleon clouds may reflect a different history of star formation. The Cha II cloud turns about 8 into stars every Myr, i.e. much less than the star formation rate in the other c2d clouds. However, the star formation rate is not steady and there is evidence of acceleration of star formation, as seen in other star forming regions. This, together with the results of Paper I on the high disk fraction, may indicate that the star formation in Cha II possibly occurred rapidly a few million years ago, which would explain the scarcity of disk-less stars in the region.
We have also investigated possible links between the stellar and the disk properties. We find a fair indication that more luminous objects have more luminous disks, which suggests a possible correlation between stellar mass and disk luminosity via the PMS mass-luminosity relation. About 10% of the objects with M0.27 M⊙ possess disks more massive than 0.025 M⊙, further supporting recent ideas that the presence of massive disks might be a consequence of the “isolated” star-forming mode with respect to the “clustered” one.
Finally, the strength of the H emission line of the PMS stars in Cha II behaves as in other young populations in other regions. We find that objects with optically thick disks show strong H emission, suggesting that the gaseous and dust components of disks evolve on similar timescales. The correlation between the H emission and the IR excess emission allowed us to identify various Spitzer colors in the range 3.6-70 m that can be used as tracers of the accretion process, but different colors trace different disk regions.
References
- Alcalá et al. (1995) Alcalá J.M., Krautter J., Schmitt J. et al. 1995, A&A Supp. Ser. 114, 109
- Alcalá et al. (1997) Alcalá J.M., Krautter J., Covino E. et al. 1997, A&A 319, 18
- Alcalá et al. (2000a) Alcalá J.M., Covino E., Sterzik M.F. et al. 2000, A&A 355, 629
- Alcalá et al. (2000b) Alcalá J.M., Covino E., Torres G. et al. 2000, A&A 353, 186
- Alcalá et al. (2006) Alcalá J.M., Spezzi L., Frasca A. & Covino E. 2006, A&A 453, L1
- Alcalá et al. (2008) Alcalá J.M., Spezzi L., Chapman N. et al. 2008, ApJ, in press
- Allard et al. (2000) Allard F., Hauschildt P.H. & Schwenke D. 2000, ApJ 540, 1005
- Allers et al. (2006) Allers K.N., Kessler-Silacci J.E., Cieza L.A. & Jaffe D.T. 2006, ApJ, 644, 364
- Allers (2006) Allers K.N. 2006, Ph. D. Dissertation, The University of Texas at Austin
- Allers et al. (2007) Allers K.N., Jaffe D.T., Luhman K. L. et al. 2007, ApJ, 657, 511
- Andrews & Williams (2007) Andrews S.M. & Williams J.P. 2007, astro-ph 0708.4185
- Bagnulo et al. (2003) Bagnulo S., Jehin E., Ledoux C. et al. 2003, Msngr. 114, 10
- Baraffe et al. (1998) Baraffe I., Chabrier G., Allard F. & Hauschildt P.H. 1998, A&A 337, 403
- Baraffe et al. (2002) Baraffe I., Chabrier G., Allard F. & Hauschildt P.H. 2002, A&A 382, 563
- Barrado Y Navascués et al. (1998) Barrado Y Navascués D., Stauffer J.R., Bouvier J. & Martínet E.L. 1998, Astrophysics and Space Science 263, 1-4,303
- Barrado y Navascués et al. (2001) Barrado Y Navascués D., Stauffer J.R., Briceño C. et al. 2001, ApJS 134, 103
- Barrado y Navascués et al. (2004) Barrado Y Navascués D. & Jayawardhana R. 2004, AJ 615, 840
- Béjar et al. (2001) Béjar V.J.S., Martín E.L., Zapatero Osorio M. R. et al. 2001, ApJ 556, 830
- Beckwith et al (1990) Beckwith S.V.W., Sargent A.I., Chini R.S. & Güsten R. 1990, AJ 99, 924
- Bochanski et al. (2007) Bochanski J.J., West A.A., Hawley S.L. et al. 2007, AJ 133, 531
- Boulanger et al. (1998) Boulanger F., Bronfman L., Dame T.M. & Thaddeus P. 1998, A&A 332, 273
- Bodenheimer (1965) Bodenhaimer, P. 1965, ApJ, 142, 459
- Brandner et al. (1996) Brandner W., Alcalá J.M., Kunkel M. et al. 1996, A&A 307, 121
- Briceño et al. (2002) Briceño C., Luhman K.L., Hartmann L. et al. 2002, ApJ 580, 317
- Cambrésy (1999) Cambrésy L. 1999, A&A 345, 965
- Cardelli et al. (1989) Cardelli J.A., Clayton G.C. & Mathis J.S. 1989, ApJ 345, 245
- Carpenter (2002) Carpenter J.M. 2002, AJ 124, 1593
- Chabrier et al. (2000) Chabrier G., Baraffe I., Allar, F. & Hauschildt P. 2000, ApJ, 542, 464
- Chabrier (2003) Chabrier G. 2003, PASP 115, 763
- Chen et al. (1995) Chen, H., Myers, P.C., Ladd, E.F., Wood, D.O.S. 1995, ApJ, 445, 377
- Chen et al. (1997) Chen, H., Grenfell, T.G., Myers, P.C., Hughes, J.D. 1997, ApJ, 478, 295
- Cieza et al. (2005) Cieza L., Kessler-Silacci J.E., Jaffe D.T. et al. 2005, ApJ 635, 422
- Cincunegui & Mauas (2004) Cincunegui C. & Mauas P.J.D. 2004, A&A 414, 699
- Comerón et al. (2000) Comerón F., Neuhäuser R. & Kaas A.A. 2000, A&A 359, 269
- Comerón et al. (2003) Comerón, Fernández M., Baraffe I. et al. 2003, A&A 406,1001
- Covino et al. (1997a) Covino E., Alcalá J.M., Allain S. et al. 1997, A&A 328, 187
- Covino et al. (1997b) Covino E., Palazzi E., Penprase B. et al. 1997, A&AS 122, 95
- D’Alessio et al. (2005) D’Alessio P., Merí B., Calvet N. at al. 2005, Rev. Mex. de Aston. y Astrof. 41, 61
- D’Antona & Mazzitelli (1998) D’Antona F. & Mazzitelli I. 1997, Mem. S.A.It. 68, 807
- Downes et al. (2006) Downes J.J., Briceño C. & Hernandez J. 2006, Rev. Mex. de Aston. y Astrof. Conf. Ser. 26, 37
- Dullemond et al. (2001) Dullemond C.P., Dominik C. & Natta A. 2001, ApJ 560, 957
- Evans et al. (2003) Evans II J.N., Allen L.E., Blake G.A. et al. 2003, PASP, 115, 965
- Evans et al. (2007) Evans II J.N., Harvey P.M., Dunham M.M. et al. 2007, Final Delivery of Data from the c2d Legacy Project: IRAC and MIPS (Pasadena, SSC)
- Feigelson & Montmerle (1999) Feigelson E.D. & Montmerle T. 1999, Ann. Rev. A&A 37, 363
- Frasca et al. (2003) Frasca A., Alcalá J.M., Covino E. et al. 2003, A&A 405, 149
- Gandolfi et al. (2007) Gandolfi D., Alcalá J.M., Leccia S. et al. 2007, ApJ, submitted
- Gauvin & Strom (1992) Gauvin L.S. & Strom K.M. 1992, AJ 385, 217
- Guieu et al. (2006) Guieu S., Dougados C., Monin J.L. et al. 2006, A&A 446, 485
- Hartigan (1993) Hartigan P. 1993 AJ 105, 1511
- Hartmann (1998) Hartmann L. 1998, Accretion Processes in Star Formation (Cambridge: Cambridge Univ. Press)
- Harvey et al. (2007) Harvey P., Merín B., Huard T.L. et al. 2007, ApJ 663, 1149
- Hauschildt et al. (1999) Hauschildt P.H., Allard F. & Baron E. 1999, ApJ 512, 377
- Hawley et al. (2002) Hawley S.L., Covey K.R., Knapp G.R. et al. 2002, AJ 123, 3409
- Hayakawa et al. (2001) Hayakawa T., Cambrèsy L., Onishi et al. 2001, PASJ 53, 1109
- Henning et al. (1998) Henning T., Burkert A., Launhardt R. et al. 1998, A&A 336, 565
- Hillenbrand & Carpenter (2000) Hillenbrand L.A. & Carpenter J. 2000, ApJ 540, 236
- Hughes & Hartigan (1992) Hughes J.H. & Hartigan P. 1992, AJ 104-2, 680
- Jayawardhana et al. (2003a) Jayawardhana R., Ardila D.R., Stelzer B. & Haisch K.E. 2003, AJ 126, 1515
- Jayawardhana et al. (2003b) Jayawardhana R., Mohanty S. & Basri G. 2003, ApJ 592, 282
- Jayawardhana & Ivanov (2006) Jayawardhana R. & Ivanov V.D. 2006, ApJ 647, L167
- Kenyon & Hartmann (1995) Kenyon S. & Hartmann L. 1995, ApJ 101, 117
- Köhler (2001) Köhler R. 2001, AJ 122, 3334
- Kroupa (2001) Kroupa P. 2001, Mon. Not. R. Astron. Soc. 322, 231
- Kroupa (2002) Kroupa P. 2002, Science 295, 82
- Lada & Lada (2003) Lada C. J. & Lada E.A. 2003, ARA&A, 41, 57
- Lada et al. (2006) Lada C.J., Muench A.A., Luhman K.L. et al. 2006, AJ, 131, 1574
- Le Borgne et al. (2003) Le Borgne J.F., Bruzual G., Pelló R. et al. 2003, A&A 402, 433
- Lehtinen et al. (2005) Lehtinen K., Mattila K. & Lemke D. 2005, A&A 437, 159
- Leone (2007) Leone F. 2007, ApJ 667, L175
- Liu et al. (2003) Liu M C., Najita J. & Tokunaga A.T. 2003, ApJ 585, 372
- López Martí et al. (2004) López Martí B., Eislöffel J., Scholz A. & Mundt R. 2004, A&A 416, 555
- López-Martí et al. (2005) López-Martí B., Eislöffel J. & Mundt R. 2005, A&A 444, 175
- Luhman & Rieke (1999) Luhman K.L. & Rieke G.H. 1999, ApJ 525, 440
- Luhman et al. (2000) Luhman K.L., Rieke G.H., Young E.T. et al. 2000, ApJ 540, 1016
- Luhman et al. (2003) Luhman K.L., Stauffer J.R., Muench A.A. et al. 2003, AJ 593,1093
- Luhman (2004) Luhman K.L. 2004, AJ 602, 816
- Luhman et al. (2005a) Luhman K.L., D’Alessio P., Calvet N. et al. 2005, ApJ 620, 51
- Luhman et al. (2005b) Luhman K.L., Lada C.J., Hartmann L. et al. 2005, ApJ 631, L69
- Luhman (2006) Luhman K.L. 2006, ASP Conf. Ser., in press
- Luhman et al. (2007) Luhman K.L., Joergens V., Lada C. et al. 2007, Protostars and Planets V, p. 443, B. Reipurth, D. Jewitt, and K. Keil (eds.), University of Arizona Press, Tucson, 951 pp.
- Martín et al. (1999) Martín E.L., Delfosse X., Basri G. et al. 1999, AJ 118, 2466
- Martín & Magazzù (1999) Martín E.L. & Magazzù A. 1999, A&A 342, 173
- Melo et al. (2007) Melo C., Kaufer a. & Hainaut O. 2007, FLAMES Calibration Plan, Doc. No. VLT-PLA-ESO-13700-3248, Issue 81
- Mizuno et al. (1995) Mizuno A., Onishi T., Yonekura Y. et al. 1995, AJ 445, L161
- Mizuno et al. (1998) Mizuno A., Hayakawa T., Yamaguchi N. et al. 1998, ApJ 507, 83
- Mizuno et al. (1999) Mizuno A., Hayakawa T., Tachihara K. et al. 1999, PASJ 51, 859
- Mizuno et al. (2001) Mizuno A., Yamaguchi R., Tachihara K. et al. 2001, PASJ 53, 1071
- Mohanty et al. (2005) Mohanty S., Jayawardhana R. & Basri G. 2005, ApJ 626, 498
- Moraux et al. (2003) Moraux E., Bouvier J., Stauffer J.R. & Cuillandre J.C. 2003, A&A 400, 891
- Mouschovias & Cioleck (1999) Mouschovias T.C. & Cioleck G.E. 1999, in The Origin of Stars and Planetary Systems, ed. by C.J. Lada & N.D. Kilafis, Kluwer Academic Publishers, p. 305
- Muench et al. (2002) Muench A.A., Lada E.A., Lada C.J. & Alves J. 2002, ApJ 573, 366
- Muench et al. (2003) Muench A.A., Lada E.A., Lada C.J. et al. 2003, AJ 125, 2029
- Mundy et al. (1995) Mundy L.G., Looney L.W. & Lada E.A. 1995, ApJ 452, L137
- Muzerolle et al. (2000) Muzerolle J., Briceño C., Calvet N. et al. 2000, ApJ 545, L141
- Muzerolle et al. (2003) Muzerolle J., Hillenbrand L., Calvet N. et al. 2003, ApJ 592, 266
- Muzerolle et al. (2005) Muzerolle J., Luhman K.L., Briceño C. et al. 2005, ApJ 625, 906
- Natta et al. (2004) Natta A., Testi L., Muzerolle J. et al. 2004, A&A 424, 603
- Osterloh & Beckwith (1995) Osterloh M. & Beckwith S.V.W. 1995, ApJ 439, 288
- Palla & Stahler (1999) Palla F. & Stahler S.W. 1999, ApJ 525, 772
- Palla & Stahler (2000) Palla F. & Stahler S.W. 2000, ApJ 540, 255
- Pasquini et al. (2002) Pasquini L., Avila G., Blecha A. et al. 2002, The Messenger 110, 1
- Perryman (1997) Perryman M.A.C. 1997, ESA SP 1200
- Persi et al. (2003) Persi P., Marenzi A. R., Gómez M. & Olofsson G. 2003, A&A 399, 995
- Porras et al. (2007) Porras A., Jorgensen, J., Allen, L.E. 2006, ApJ 656, 493
- Preibisch & Zinnecker (1999) Preibisch T. & Zinnecker H. 1999, AJ 117, 2381
- Preibisch et al. (2003) Preibisch T., Stanke T. & Zinnecker H. 2003, A&A 409, 147
- Reid et al. (2002) Reid I.N., Gizis J.E. & Hawley S.L. 2002, AJ 124, 2721
- Robitaille et al. (2006) Robitaille T.P., Whitney B.A., Indebetow R. et al. 2006, ApJS 167, 256
- Rocha-Pinto et al. (2002) Rocha-Pinto H.J., Castilho B.V. & Maciel W.J. 2002, A&A 384, 912
- Savage & Mathis (1979) Savage B.D. & Mathis J.S. 1979, Ann. Rev. A&A 17, 73
- Scalo (1986) Scalo J.M. 1986, Fundamentals of Cosmic Physics 11, 1
- Scalo (1998) Scalo J.M. 1998, ASP Conf. Ser. 142, 201
- Schwartz (1977) Schwartz R.D. 1977, ApJS 35,161
- Schwartz (1991) Schwartz R.D. 1991, ESO rep. No. 11, p. 93
- Skinner et al. (1991) Skinner S.L., Brown A. & Walter F.M. 1991, AJ 102, 1742S
- Spezzi et al. (2007) Spezzi L., Alcalá J.M., Frasca A. et al. 2007, A&A 470, 281
- Tachihara et al. (1996) Tachihara K., Dobashi K., Mizuno A. et al. 1996, PASJ 48, 489
- Tej et al. (2002) Tej A., Sahu K.C., Chandrasekhar T. & Ashok N.M. 2002, ApJ 578, 523
- Valdes et al. (2004) Valdes F., Gupta R., Rose J.A. et al. 2004, ApJS 152, 251
- Vuong et al. (2001) Vuong M.H., Cambrésy L. & Epchtein N. 2001, A&A 379, 208
- Weingartner & Draine (2001) Weingartner J.C. & Draine B.T. 2001, ApJ, 548,296
- White & Basri (2003) White R.J. & Basri G. 2003, ApJ 582, 1109
- Whittet et al. (1997) Whittet D.C.B., Prusti T., Franco G.A.P. et al. 1997, A&A 327, 1194
- Wichmann et al. (1997) Wichmann R., Krautter J., Covino E. et al. 1997, A&A 320, 185
- Wichmann et al. (2000) Wichmann R., Torres G., Melo C.H.F. et al. 2000, A&A 359, 181
- Williams & Andrews (2006) Williams J.P. & Andrews S.M. 2006, ASP Conf. Ser. 356, 213
- Young et al. (2005) Young K.E., Harvey P.M., Brooke T.Y. et al. 2005, ApJ 628, 283
| No. | Object | FLAMESΘ | No. | S/N | PMS | SpTΨ | EW | EWLiI | EWHα 10% | |
|---|---|---|---|---|---|---|---|---|---|---|
| id. | Spec. | FlagΥ | [Å] | [Å] | [Km/s] | [M⊙/yr] | ||||
| 1 | IRAS 12416-7703 / AX Cha | – | – | – | CND | M2.5 | 15 | – | – | – |
| 2 | IRAS 12448-7650 | – | – | – | CND | M0.5 | 35 | – | – | – |
| 3 | IRAS F12488-7658 / C 13 | – | – | – | CND | M5.5 | 0 | – | – | – |
| 4 | IRAS 12496-7650 / DK Cha | GM | 2 | 45 | PMS | F0 | 88 | 0 | 746 | 2.2e-06 |
| 5 | WFI J12533662-7706393 | – | – | – | CND | M6 | – | – | – | – |
| 6 | C 17 | – | – | – | CND | M1.5 | 0 | – | – | – |
| 7 | IRAS 12500-7658∙ | – | – | – | PMS | M6.5 | 20 | – | – | – |
| 8 | C 33 | – | – | – | CND | M1 | 0 | – | – | – |
| 9 | IRAS 12522-7640 / HH 54 | – | – | – | – | – | – | – | – | |
| 10 | Sz 46N | U | 2 | 20 | PMS | M1 | 16 | 0.58 | 232 | 2.2e-11 |
| 11 | Sz 47 | GM | 3 | 300 | PMS | – | 34 | 0 | 845 | 2.0e-05 |
| 12 | IRAS 12535-7623 / CHIIXR 2 | U | 2 | 60 | PMS† | M0 | 15 | 0.57 | 396 | 8.9e-10 |
| 13 | SSTc2d J125758.7-770120 / #1 Γ | – | – | – | PMS | M9 | – | – | – | – |
| 14 | ISO-CHAII 13Ω | – | – | – | PMS | M7 | 101 | – | 283 | 7.1e-11 |
| 15 | WFI J12583675-7704065 | – | – | – | CND | M9 | – | – | – | – |
| 16 | WFI J12585611-7630105 | GM | 3 | 50 | PMS† | M5 | 31 | 0.50 | 388 | 7.4e-10 |
| 17 | IRAS 12553-7651 / ISO-CHAII 28∙ | – | – | – | PMS | K4.5 | – | – | – | – |
| 18 | C 41Δ | GM | 1 | 15 | PMS | M5.5 | 48 | 0.36 | 487 | 6.8e-09 |
| 19 | ISO-CHAII 29 | GM | 2 | 60 | PMS† | M0 | 1 | 0.52 | 249 | 3.3e-11 |
| 20 | IRAS 12556-7731 | GM | 2 | 100 | PMS† | M5 | 0 | 0.48 | 0 | 1.2e-13 |
| 21 | WFI J13005297-7709478 | – | – | – | CND | M9 | – | – | – | – |
| 22 | Sz 48NE / CHIIXR 7Σ | – | – | – | PMS | M0.5 | 22 | – | – | – |
| 23 | Sz 49 / ISO-CHAII 55 / CHIIXR 9 Σ | – | – | – | PMS | M0.5 | 170 | – | – | – |
| 24 | Sz 48SW / CHIIXR 7 | GM | 3 | 90 | PMS‡ | M1 | 19 | 0.61 | 445 | 2.6e-09 |
| 25 | Sz 50 / ISO-CHAII 52 / CHIIXR 8 | U | 2 | 25 | PMS | M3 | 29 | 0.49 | 265 | 4.7e-11 |
| 26 | WFI J13005531-7708295 | GM | 2 | 100 | PMS† | M2.5 | 2 | 0.55 | 254 | 3.7e-11 |
| 27 | RXJ1301.0-7654a | U | 1 | 60 | PMS | K5 | 4 | 0.58 | – | – |
| 28 | IRAS F12571-7657 / ISO-CHAII 54 | GM | 3 | 25 | PMS† | C | 12 | 0.39 | 529 | 1.7e-08 |
| 29 | Sz 51 | U | 2 | 50 | PMS | K8.5 | 102 | 0.35 | 399 | 9.5e-10 |
| 30 | CM Cha / IRAS 12584-7621 | GM | 1 | 300 | PMS‡ | K7 | 29 | 0.38 | 388 | 7.4e-10 |
| 31 | C 50 | GM | 2 | 20 | PMS† | M5 | 36 | 0.46 | 457 | 3.4e-09 |
| 32 | IRAS 12589-7646 / ISO-CHAII 89 | – | – | – | CND | M4 | 3 | – | – | – |
| 33 | RXJ1303.1-7706 | GM | 3 | 300 | PMS | M0 | 3 | 0.60 | 179 | 7.0e-12 |
| 34 | C 51 | GM | 2 | 35 | PMS† | M4.5 | 9 | 0.50 | 256 | 3.9e-11 |
| 35 | WFI J13031615-7629381 | – | – | – | CND | M7 | 15 | – | – | – |
| 36 | Hn 22 / IRAS 13005-7633 Λ | – | – | – | PMS | M2 | 55 | – | – | – |
| 37 | Hn 23 | U | 1 | 110 | PMS‡ | K5 | 13 | 0.52 | – | – |
| 38 | Sz 52 | GM | 2 | 35 | PMS‡ | M2.5 | 48 | 0.39 | 454 | 3.2e-09 |
| 39 | Hn 24 | GM/U | 3/2 | 100/55 | PMS‡ | M0 | 1 | 0.58 | 319 | 1.6e-10 |
| 40 | Hn 25 | GM | 1 | 50 | PMS‡ | M2.5 | 24 | 0.46 | 449 | 2.9e-09 |
| 41 | Sz 53 | GM | 2 | 80 | PMS | M1 | 46 | 0.38 | 454 | 3.2e-09 |
| 42 | Sz 54 | GM/U | 2/4 | 350/100 | PMS | K5 | 23 | 0.46 | 473 | 4.9e-09 |
| 43 | SSTc2d J130521.7-773810 | GM | 1 | 20 | PMS† | C | 29 | 0.44 | 404 | 1.0e-09 |
| 44 | SSTc2d J130529.0-774140 | – | – | – | CND | – | – | – | – | – |
| 45 | SSTc2d J130540.8-773958 / #5 Γ | – | – | – | PMS | L1 | – | – | – | – |
| 46 | Sz 55 | GM | 3 | 90 | PMS | M2 | 155 | 0.19 | 536 | 2.0e-08 |
| 47 | Sz 56 | GM | 4 | 15 | PMS | M4 | 15 | 0.46 | 348 | 3.0e-10 |
| 48 | Sz 57 / C 60 | GM | 3 | 75 | PMS | M5 | 27 | 0.46 | 174 | 6.2e-12 |
| 49 | Sz 58 / IRAS 13030-7707 /C 61 | GM | 3 | 200 | PMS | K5 | 15 | 0.46 | 493 | 7.8e-09 |
| 50 | Sz 59 | GM | 3 | 200 | PMS | K7 | 48 | 0.39 | 518 | 1.3e-08 |
| 51 | C 62 | GM | 3 | 20 | PMS† | M4.5 | 34 | 0.37 | 255 | 3.8e-11 |
| 52 | Sz 60W | U | 4 | 35 | PMS | M1 | 44 | 0.51 | 426 | 1.7e-09 |
| 53 | Sz 60EΣ | – | – | – | PMS | M4 | 99 | – | – | – |
| 54 | IRAS 13036-7644 / BHR 86 | – | – | – | PMS | – | – | – | – | – |
| 55 | Hn 26 | GM | 3 | 110 | PMS‡ | M2 | 10 | 0.59 | 494 | 7.9e-09 |
| 56 | Sz 61 | GM | 2 | 200 | PMS | K5 | 84 | 0.38 | 549 | 2.7e-08 |
| 57 | C 66 | GM | 5 | 20 | PMS† | M4.5 | 30 | 0.43 | 293 | 8.9e-11 |
| 58 | IRAS F13052-7653NW / CHIIXR 60 | GM | 1 | 200 | PMS† | M0.5 | 15 | 0.45 | 565 | 3.8e-08 |
| 59 | IRAS F13052-7653N / CHIIXR 60 | U | 1 | 40 | PMS† | M1.5 | 2 | 0.58 | – | – |
| 60 | Sz 62 | GM | 2 | 150 | PMS | M2.5 | 150 | 0.38 | 409 | 1.1e-09 |
| 61 | Sz 63 | GM | 1 | 90 | PMS | M3 | 76 | 0.53 | 505 | 1.0e-08 |
| 62 | 2MASS13125238-7739182 | GM | 2 | 65 | PMS† | M4.5 | 6 | 0.52 | 189 | 8.7e-12 |
| 63 | Sz 64 | GM | 2 | 50 | PMS | M5 | 130 | 0.40 | 241 | 2.8e-11 |
Note. — The coordinates are reported in Paper I
| Field | RA† | DEC† | Obs. Date | Exp. Time | No PMS | No |
| (sec.) | (GM & U)‡ | Field Stars | ||||
| 1 | 13:07:24.0 | -77:33:21 | 2006-03-01 | 3000 | 11+3 | 107 |
| 1 | ” | ” | 2006-03-02 | 3300 | 7+3 | 100 |
| 1 | ” | ” | 2006-03-03 | 3000 | 9+6 | 103 |
| 2 | 13:02:54.2 | -77:18:03 | 2006-03-01 | 3000 | 3+1 | 116 |
| 2 | ” | ” | 2006-03-02 | 3660 | 3 | 95 |
| 2 | ” | ” | 2006-03-03 | 3000 | 4+1 | 121 |
| 3 | 12:55:31.5 | -77:03:13 | 2006-03-01 | 3000 | 1 | 119 |
| 3 | ” | ” | 2006-03-03 | 3000 | 1 | 120 |
| 4 | 13:09:02.9 | -77:01:20 | 2006-03-01 | 3000 | 1+1 | 118 |
| 5 | 13:02:06.5 | -76:48:37 | 2006-03-01 | 3000 | 2+2 | 118 |
| 6 | 13:02:33.0 | -77:46:32 | 2006-03-01 | 900 | 5+2 | 111 |
| 6 | ” | ” | 2006-03-03 | 3000 | 5+2 | 111 |
| 7 | 13:11:20.6 | -77:49:30 | 2006-03-02 | 3000 | 5 | 112 |
| 7 | ” | ” | 2006-03-03 | 3000 | 5 | 110 |
| 8 | 12:56:21.2 | -76:37:47 | 2006-03-02 | 3000 | 2+2 | 114 |
| 8 | ” | ” | 2006-03-03 | 3900 | 2+2 | 111 |
| 9 | 12:57:42.7 | -77:25:31 | 2006-03-02 | 3000 | 0 | 80 |
| 10 | 13:04:00.1 | -76:49:59 | 2007-02-20 | 2700 | 0 | 127 |
| 11 | 13:00:57.7 | -77:05:39 | 2007-02-20 | 2700 | 3 | 101 |
| 12 | 13:04:44.3 | -77:47:03 | 2007-02-20 | 3600 | 3 | 107 |
| 13 | 13:00:57.7 | -77:05:39 | 2007-02-20 | 2700 | 0 | 124 |
| 14 | 13:10:01.8 | -77:00:56 | 2007-02-20 | 3600 | 1 | 112 |
| 15 | 13:01:00.1 | -77:20:00 | 2007-02-21 | 3180 | 2 | 74 |
| Object id. | RA | DEC | Ref. |
|---|---|---|---|
| C 30 | 12:55:15.84 | 76:56:33.00 | Vuong et al. (2001) |
| 2MASS12560549-7654106 | 12:56:05.52 | 76:54:10.80 | Young et al. (2005) |
| C 37 | 12:57:31.44 | 76:43:04.44 | Vuong et al. (2001) |
| ISO-CHA II 32 | 12:59:15.84 | 76:54:45.72 | Persi et al. (2003) |
| WFIJ12591881-7704419 | 12:59:18.81 | 77:04:41.92 | Spezzi et al. (2007) |
| WFIJ12592348-7726589 | 12:59:23.48 | 77:26:58.96 | Spezzi et al. (2007) |
| ISO-CHA II 73 | 13:01:46.08 | 77:16:03.00 | Persi et al. (2003) |
| WFIJ13014752-7631023 | 13:01:47.52 | 76:31:02.32 | Spezzi et al. (2007) |
| IRAS 12583-7634c† | 13:02:05.52 | 76:51:02.88 | Schwartz (1991) |
| IRAS 12583-7634a† | 13:02:08.88 | 76:51:06.12 | Schwartz (1991) |
| ISO-CHA II 91 | 13:02:55.44 | 77:15:15.84 | Persi et al. (2003) |
| ChaII 376 | 13:03:12.48 | 76:50:50.64 | López-Martí et al. (2005) |
| ISO-CHA II 110 | 13:04:18.96 | 76:53:59.96 | Persi et al. (2003) |
| C 55 | 13:05:32.64 | 77:35:26.16 | Vuong et al. (2001) |
| C 45 | 13:06:30.72 | 77:00:23.76 | Vuong et al. (2001) |
| WFIJ13071960-7655476 | 13:07:19.60 | 76:55:47.64 | Spezzi et al. (2007) |
| 2MASS13102531-7729085 | 13:10:25.20 | 77:29:08.52 | Young et al. (2005) |
| No. | Object | Teff | AV | log(L⋆/L⊙) | R⋆/R⊙ |
|---|---|---|---|---|---|
| id. | [K] | [Mag] | |||
| 1 | IRAS 12416-7703 / AX Cha | 3487200 | 3.361.50 | 1.110.15♠ | 9.750.64♠ |
| 2 | IRAS 12448-7650 | 3755200 | 4.451.50 | 1.400.22♠ | 11.580.77♠ |
| 3 | IRAS F12488-7658 / C 13 | 3025200 | 4.321.50 | 0.430.17♠ | 6.090.31♠ |
| 4 | IRAS 12496-7650 / DK Cha | 7200170 | 10.550.07 | 1.270.04 | 2.770.14 |
| 5 | WFI J12533662-7706393 | 3000200 | 5.581.50 | -1.950.10 | 0.390.02 |
| 6 | C 17 | 3600200 | 5.951.50 | -0.340.10 | 1.740.09 |
| 7 | IRAS 12500-7658∙ | 2900200 | 4.061.50 | -2.210.10 | 0.310.02 |
| 8 | C 33 | 3700200 | 4.481.50 | -0.780.24 | 0.990.05 |
| 9 | IRAS 12522-7640 / HH 54 | – | – | – | – |
| 10 | Sz 46N | 370572 | 2.440.30 | -0.480.05 | 1.390.09 |
| 11 | Sz 47 | – | – | – | – |
| 12 | IRAS 12535-7623 / CHIIXR 2 | 385089 | 3.360.21 | 0.140.05 | 2.710.16 |
| 13 | SSTc2d J125758.7-770120 / #1 | 2400200 | 5.001.00 | -3.050.10 | 0.170.02 |
| 14 | ISO-CHAII 13Ω | 288070 | 5.000.50 | -2.040.07 | 0.380.03 |
| 15 | WFI J12583675-7704065 | 2400200 | 3.841.50 | -2.150.05 | 0.490.03 |
| 16 | WFI J12585611-7630105 | 302570 | 1.660.98 | -1.030.10 | 1.130.13 |
| 17 | IRAS 12553-7651 / ISO-CHAII 28∙ | 4500 | 38.90 | 1.20 | 5.58 |
| 18 | C 41Δ | 305768 | 2.171.08 | -1.950.11 | 0.370.05 |
| 19 | ISO-CHAII 29 | 385089 | 5.570.21 | -0.190.05 | 1.850.11 |
| 20 | IRAS 12556-7731 | 312570 | 3.880.47 | 1.080.08♠ | 12.031.07♠ |
| 21 | WFI J13005297-7709478 | 2500200 | 5.501.50 | -2.080.29 | 0.490.03 |
| 22 | Sz 48NE / CHIIXR 7 | 377772 | 4.260.40 | -0.470.06 | 1.350.09 |
| 23 | Sz 49 / ISO-CHAII 55 / CHIIXR 9 | 377772 | 2.280.40 | -0.700.06 | 1.030.07 |
| 24 | Sz 48SW / CHIIXR 7 | 370572 | 3.870.30 | -0.580.05 | 1.250.08 |
| 25 | Sz 50 / ISO-CHAII 52 / CHIIXR 8 | 341572 | 3.780.30 | 0.060.05 | 3.100.19 |
| 26 | WFI J13005531-7708295 | 368772 | 2.720.24 | -0.450.05 | 1.460.09 |
| 27 | RXJ1301.0-7654a | 4350192 | 1.930.47 | 0.380.06 | 2.670.20 |
| 28 | IRAS F12571-7657 / ISO-CHAII 54† | – | – | – | – |
| 29 | Sz 51 | 3955105 | 1.540.11 | -0.360.05 | 1.370.07 |
| 30 | CM Cha / IRAS 12584-7621 | 4060125 | 1.520.14 | -0.140.05 | 1.780.10 |
| 31 | C 50 | 312570 | 2.950.98 | -1.190.10 | 0.890.10 |
| 32 | IRAS 12589-7646 / ISO-CHAII 89 | 3300200 | 3.981.50 | 1.170.06♠ | 11.780.78♠ |
| 33 | RXJ1303.1-7706 | 385089 | 1.610.21 | 0.100.05 | 2.610.15 |
| 34 | C 51 | 319772 | 4.420.92 | -0.530.09 | 1.770.19 |
| 35 | WFI J13031615-7629381 | 2900200 | 0.611.50 | -1.240.22 | 0.950.05 |
| 36 | Hn 22 / IRAS 13005-7633 | 356072 | 0.610.24 | -0.630.05 | 1.240.07 |
| 37 | Hn 23 | 4350192 | 1.240.47 | -0.060.04 | 1.600.14 |
| 38 | Sz 52 | 348772 | 4.140.24 | -0.750.05 | 1.150.07 |
| 39 | Hn 24 | 385089 | 2.760.38 | 0.020.06 | 2.370.16 |
| 40 | Hn 25 | 348772 | 4.100.24 | -0.480.05 | 1.560.09 |
| 41 | Sz 53 | 370572 | 3.680.31 | -0.490.05 | 1.390.09 |
| 42 | Sz 54 | 4350192 | 1.570.47 | 0.290.07 | 2.420.20 |
| 43 | SSTc2d J130521.7-773810† | – | – | – | – |
| 44 | SSTc2d J130529.0-774140 | – | – | – | – |
| 45 | SSTc2d J130540.8-773958 / #5 | 2200300 | 3.001.00 | -3.220.14 | 0.170.02 |
| 46 | Sz 55 | 356072 | 3.090.22 | -0.900.06 | 0.910.06 |
| 47 | Sz 56 | 327072 | 3.180.64 | -0.470.08 | 1.780.17 |
| 48 | Sz 57 / C 60 | 312570 | 3.090.98 | -0.390.10 | 2.210.26 |
| 49 | Sz 58 / IRAS 13030-7707 /C 61 | 4350192 | 3.870.47 | -0.160.07 | 1.430.12 |
| 50 | Sz 59 | 4060125 | 2.670.16 | -0.050.03 | 1.960.12 |
| 51 | C 62 | 319772 | 4.840.92 | -1.050.10 | 0.970.11 |
| 52 | Sz 60W | 370572 | 2.350.32 | -0.540.06 | 1.320.10 |
| 53 | Sz 60E | 327072 | 2.160.64 | -0.670.08 | 1.420.13 |
| 54 | IRAS 13036-7644 / BHR 86 | – | – | – | – |
| 55 | Hn 26 | 356072 | 3.500.22 | -0.590.06 | 1.300.08 |
| 56 | Sz 61 | 4350192 | 3.130.47 | 0.070.05 | 1.870.15 |
| 57 | C 66 | 319772 | 4.370.92 | -1.300.10 | 0.730.08 |
| 58 | IRAS F13052-7653NW / CHIIXR 60 | 377772 | 2.280.40 | -0.700.07 | 1.030.08 |
| 59 | IRAS F13052-7653N / CHIIXR 60 | 363272 | 0.410.20 | -0.470.06 | 1.490.10 |
| 60 | Sz 62 | 348772 | 0.780.24 | -0.480.06 | 1.560.10 |
| 61 | Sz 63 | 341572 | 1.610.30 | -0.640.06 | 1.380.10 |
| 62 | 2MASS13125238-7739182 | 319772 | 1.340.93 | -0.810.10 | 1.280.15 |
| 63 | Sz 64 | 312570 | 0.740.50 | -1.040.21 | 1.040.13 |
Note. — The coordinates are reported in Paper I
| B98&C00† | DM98‡ | PS99ℵ | |||||
|---|---|---|---|---|---|---|---|
| No. | Object id. | M⋆/M⊙ | Age | M⋆/M⊙ | Age | M⋆/M⊙ | Age |
| (Myr) | (Myr) | (Myr) | |||||
| 1 | IRAS 12416-7703 / AX Cha♠ | – | – | – | – | – | – |
| 2 | IRAS 12448-7650♠ | – | – | – | – | – | – |
| 3 | IRAS F12488-7658 / C 13♠ | – | – | – | – | – | – |
| 4 | IRAS 12496-7650 / DK Cha | – | – | 2.00 | 7.0 | 2.00 | 2.5 |
| 5 | WFI J12533662-7706393 | 0.07 | 7.2 | 0.10 | 10.0 | 0.10 | 10.0 |
| 6 | C 17 | 0.62 | 2.2 | 0.30 | 0.7 | 0.40 | 1.0 |
| 7 | IRAS 12500-7658∙ | 0.06 | 10.1 | 0.06 | 10.0 | – | – |
| 8 | C 33 | 0.70 | 14.3 | 0.50 | 7.0 | 0.50 | 7.5 |
| 9 | IRAS 12522-7640 / HH 54 | – | – | – | – | – | – |
| 10 | Sz 46N | 0.7 | 5.7 | 0.40 | 1.5 | 0.50 | 2.0 |
| 11 | Sz 47 | – | – | – | – | – | – |
| 12 | IRAS 12535-7623 / CHIIXR 2 | 1.05 | 1.1 | 0.35 | 0.3 | 0.60 | 1.0 |
| 13 | SSTc2d J125758.7-770120 / #1 | 0.03 | 28.6 | 0.02 | 7.0 | – | – |
| 14 | ISO-CHAII 13 | 0.05 | 5.0 | 0.06 | 7.0 | – | – |
| 15 | WFI J12583675-7704065 | 0.02 | 1.0 | 0.08 | 0.2 | – | – |
| 16 | WFI J12585611-7630105 | 0.11 | 1.0 | 0.14 | 2.0 | 0.10 | 1.0 |
| 17 | IRAS 12553-7651 / ISO-CHAII 28∙ | – | – | – | – | – | – |
| 18 | C 41 | 0.09 | 10.1 | 0.12 | 20.0 | 0.10 | 10.0 |
| 19 | ISO-CHAII 29 | 0.95 | 5.1 | 0.40 | 0.7 | 0.60 | 2.5 |
| 20 | IRAS 12556-7731♠ | – | – | – | – | – | – |
| 21 | WFI J13005297-7709478 | 0.02 | 1.0 | 0.03 | 0.1 | – | – |
| 22 | Sz 48NE / CHIIXR 7 | 0.75 | 8.0 | 0.50 | 3.0 | 0.50 | 4.0 |
| 23 | Sz 49 / ISO-CHAII 55 / CHIIXR 9 | 0.75 | 14.3 | 0.60 | 7.0 | 0.50 | 7.5 |
| 24 | Sz 48SW / CHIIXR 7 | 0.70 | 7.1 | 0.50 | 3.0 | 0.50 | 4.0 |
| 25 | Sz 50 / ISO-CHAII 52 / CHIIXR 8 | 0.50 | 1.0 | 0.25 | 0.1 | 0.30 | 0.0 |
| 26 | WFI J13005531-7708295 | 0.70 | 4.5 | 0.40 | 2.0 | 0.50 | 2.0 |
| 27 | RXJ1301.0-7654a | – | – | 0.50 | 0.2 | 0.90 | 1.0 |
| 28 | IRAS F12571-7657 / ISO-CHAII 54Δ | – | – | – | – | – | – |
| 29 | Sz 51 | 1.00 | 9.0 | 0.50 | 1.0 | 0.70 | 4.0 |
| 30 | CM Cha / IRAS 12584-7621 | 1.15 | 5.0 | 0.50 | 1.0 | 0.90 | 5.0 |
| 31 | C 50 | 0.18 | 3.2 | 0.18 | 3.0 | 0.15 | 2.0 |
| 32 | IRAS 12589-7646 / ISO-CHAII 89♠ | – | – | – | – | – | – |
| 33 | RXJ1303.1-7706 | 1.05 | 1.4 | 0.35 | 0.3 | 0.80 | 1.5 |
| 34 | C 51 | 0.25 | 1.0 | 0.16 | 0.2 | 0.15 | 0.7 |
| 35 | WFI J13031615-7629381 | 0.07 | 1.0 | 0.12 | 3.0 | 0.10 | 2.5 |
| 36 | Hn 22 / IRAS 13005-7633 | 0.50 | 4.0 | 0.35 | 2.0 | 0.40 | 2.5 |
| 37 | Hn 23 | 1.40 | 5.7 | 0.70 | 1.0 | 0.90 | 4.0 |
| 38 | Sz 52 | 0.45 | 4.5 | 0.30 | 2.0 | 0.30 | 2.0 |
| 39 | Hn 24 | 1.00 | 1.6 | 0.35 | 0.5 | 0.60 | 1.0 |
| 40 | Hn 25 | 0.50 | 2.3 | 0.30 | 1.0 | 0.30 | 1.5 |
| 41 | Sz 53 | 0.75 | 5.7 | 0.40 | 2.0 | 0.50 | 2.0 |
| 42 | Sz 54 | 1.40 | 1.6 | 0.60 | 0.5 | 0.90 | 2.0 |
| 43 | SSTc2d J130521.7-773810Δ | – | – | – | – | – | – |
| 44 | SSTc2d J130529.0-774140 | – | – | – | – | – | – |
| 45 | SSTc2d J130540.8-773958 / #5 | 0.02 | 25.2 | 0.02 | 10.0 | – | – |
| 46 | Sz 55 | 0.50 | 10.0 | 0.35 | 5.0 | 0.40 | 7.5 |
| 47 | Sz 56 | 0.30 | 1.0 | 0.18 | 0.7 | 0.20 | 0.7 |
| 48 | Sz 57 / C 60 | 0.15 | 1.0 | 0.14 | 0.1 | 0.15 | 0.7 |
| 49 | Sz 58 / IRAS 13030-7707 /C 61 | 1.20 | 11.3 | 0.70 | 2.0 | 1.00 | 7.5 |
| 50 | Sz 59 | 1.15 | 3.6 | 0.50 | 0.5 | 0.80 | 2.5 |
| 51 | C 62 | 0.20 | 2.5 | 0.18 | 2.0 | 0.15 | 1.0 |
| 52 | Sz 60W | 0.70 | 5.7 | 0.50 | 3.0 | 0.50 | 2.0 |
| 53 | Sz 60E | 0.30 | 1.6 | 0.18 | 1.0 | 0.20 | 1.0 |
| 54 | IRAS 13036-7644 / BHR 86 | – | – | – | – | – | – |
| 55 | Hn 26 | 0.57 | 4.5 | 0.35 | 2.0 | 0.40 | 2.5 |
| 56 | Sz 61 | 1.40 | 4.5 | 0.60 | 1.0 | 1.00 | 2.5 |
| 57 | C 66 | 0.17 | 4.5 | 0.20 | 5.0 | 0.15 | 10.0 |
| 58 | IRAS F13052-7653NW / CHIIXR 60 | 0.75 | 14.3 | 0.60 | 7.0 | 0.50 | 2.0 |
| 59 | IRAS F13052-7653N / CHIIXR 60 | 0.62 | 3.6 | 0.40 | 2.0 | 0.40 | 2.5 |
| 60 | Sz 62 | 0.50 | 2.3 | 0.30 | 1.0 | 0.30 | 1.5 |
| 61 | Sz 63 | 0.40 | 2.5 | 0.25 | 1.0 | 0.30 | 1.0 |
| 62 | 2MASS13125238-7739182 | 0.25 | 1.3 | 0.18 | 1.5 | 0.15 | 1.5 |
| 63 | Sz 64 | 0.18 | 2.0 | 0.16 | 2.0 | 0.15 | 1.0 |
| B98&C00† | DM98‡ | PS99ℵ | ||
|---|---|---|---|---|
| Mean mass (M⊙) | 0.59 | 0.38 | 0.50 | |
| Total massΘ (M⊙) | 30.0 | 22.0 | 24.6 | |
| PMS | IMF slopeΔ () | 0.360.19 | 0.840.30 | 0.370.20 |
| stars | Mean age (Myr) | 5.76 | 2.87 | 2.83 |
| SFEΩ (%) | 2.3-4.1 | 1.7-3.0 | 1.9-3.4 | |
| SF rate (M⊙/Myr) | 5.4 | 7.6 | 8.69 | |
| Mean mass (M⊙) | 0.55 | 0.36 | 0.48 | |
| Total massΘ (M⊙) | 31.4 | 23.0 | 25.8 | |
| PMS stars | IMF slopeΔ () | 0.480.22 | 0.920.28 | 0.420.19 |
| +candidates | Mean age (Myr) | 5.60 | 2.94 | 3.05 |
| SFEΩ (%) | 2.5-4.3 | 1.8-3.2 | 2.0-3.5 | |
| SF rate (M⊙/Myr) | 5.6 | 7.8 | 8.5 | |
| Mean mass (M⊙) | 0.62 | 0.34 | 0.47 | |
| Total massΘ (M⊙) | 15.0 | 10.6 | 11.0 | |
| YSOs | Mean age (Myr) | 4.06 | 2.22 | 2.50 |
| SFEΩ (%) | 1.2-2.1 | 0.8-1.5 | 0.9-1.5 | |
| SF rate (M⊙/Myr) | 3.7 | 4.8 | 4.4 |