Deep ACS Imaging in the Globular Cluster NGC: Dynamical Models
Abstract
We present -body models to complement deep imaging of the metal-poor core-collapsed cluster NGC obtained with the Hubble Space Telescope. All simulations include stellar and binary evolution in-step with the stellar dynamics and account for the tidal field of the Galaxy. We focus on the results of a simulation that began with objects (stars and binaries), 5% primordial binaries and Population II metallicity. After Gyr of evolution the model cluster has about 20% of the stars remaining and has reached core-collapse. We compare the color-magnitude diagrams of the model at this age for the central region and an outer region corresponding to the observed field of NGC (about – half-light radii from the cluster centre). This demonstrates that the white dwarf population in the outer region has suffered little modification from dynamical processes – contamination of the luminosity function by binaries and white dwarfs with non-standard evolution histories is minimal and should not significantly affect measurement of the cluster age. We also show that the binary fraction of main-sequence stars observed in the NGC field can be taken as representative of the primordial binary fraction of the cluster. For the mass function of the main-sequence stars we find that although this has been altered significantly by dynamics over the cluster lifetime, especially in the central and outer regions, that the position of the observed field is close to optimal for recovering the initial mass function of the cluster stars (below the current turn-off mass). More generally we look at how the mass function changes with radius in a dynamically evolved stellar cluster and suggest where the best radial position to observe the initial mass function is for clusters of any age. We discuss computational constraints that restrict the -body method to non-direct models of globular clusters currently, how this affects the interpretation of our results regarding NGC, and future plans for models with increased realism.
1 Introduction
As part of a program to measure the white dwarf (WD) cooling ages of globular clusters a dataset of the nearby cluster NGC has been obtained that is unprecedented in its depth (Richer et al. 2006). This involved imaging a single field with the Advanced Camera for Surveys (ACS) on the Hubble Space Telescope (HST) for 126 orbits during Cycle 13. The field in question is located 5 arcminutes SE of the cluster core and is complemented by simultaneous exposures of the cluster core obtained with the Wide Field Planetary Camera (WFPC2). Results obtained to date from this rich dataset include: observational confirmation of the theoretical prediction for the termination point of the stellar main-sequence at the low-mass end (Richer et al. 2006); presentation of the colour-magnitude diagram and analysis of the luminosity function of the cluster stars (Richer et al. 2007); determination of the WD cooling age (Hansen et al. 2007); a study of the radial distribution of the cluster WDs (Davis et al. 2008a); calculation of the space motion of the cluster (Kalirai et al. 2007); and, measurement of the binary fraction of NGC (Davis et al. 2008b). In the majority of these publications the results of realistic -body models of star cluster evolution have been utilised in varying degrees to ascertain the extent to which dynamical evolution has impacted the observed data. The function of this paper is to provide the necessary background to the -body models and to look at the model results in more detail.
NGC is located in the inner halo of the Galaxy and has an age in the range of Gyr (Pasquini et al. 2004; Hansen et al. 2007). It has previously been shown to have a “collapsed” core (Djorgovski & King 1986), meaning that it has evolved past the potentially catastrophic phase of core-collapse and is dynamically old (Spitzer 1987). It has also been shown to exhibit mass segregation (King et al. 1998, for example). Mass-segregation is a direct consequence of the tendency towards equipartition of kinetic energies for stars in a bound stellar system. This means that heavier stars move more slowly on average and sink towards the center of the system, while low-mass stars move outwards in radius. The observed mass function (MF) of a star cluster will therefore be affected by mass segregation and the extent to which it is affected can be expected to depend on the prior dynamical evolution of the cluster – as previously observed by Piotto & Zoccali (1999).
Methods used to quantify the effects of mass-segregation include equilibrium models, such as King (1966), and simulations that follow the dynamical evolution of a star cluster. The latter typically employ either the direct -body method (Baumgardt & Makino 2003, for example) or the statistical Monte Carlo (e.g. Fregeau et al. 2002) and Fokker-Planck (e.g. Drukier 1995) methods. While much can be learnt by studying the relatively “clean” problem of mass-segregation in a self-gravitating system with only two stellar mass groups (Khalisi, Amaro-Seoane & Spurzem 2007) the effect on the MF of a cluster as it evolves is more directly understood by employing a distribution of masses. Giersz & Heggie (1996) used -body models starting with stars and masses distributed according to an initial mass function (IMF) to demonstrate that a state of true energy equipartition is never achieved in practice. The evolution of the MF was explored in detail by Vesperini & Heggie (1997) through -body models with – stars and including effects such as stellar evolution, the external tidal field of the Galaxy and disk-shocking. More recently this has been extended to models starting with as many as stars by Baumgardt & Makino (2003). In this work we study the MF of a dynamically old cluster using -body models that start with and include primordial binaries (shown to be important by de la Fuente Marcos 1996). We extend the study by also looking at the expected color-magnitude diagram of such a cluster as well as the radial distributions of the binaries and WDs.
The setup of our models and the simulation method are detailed in Section 2. This includes an initial discussion of issues related to timescales and scaling between the model and real data. An overview of the evolution history of our main model is also given in Section 2. Results are presented in Section 3 with a focus on NGC and this is followed by a discussion in Section 4 of the broader implications and future modeling aims. We briefly summarize our findings in Section 5.
2 The -body Models
2.1 Overview of the -body Code and Method
To investigate the long-term evolution of star clusters we use the Aarseth NBODY4 code (Aarseth, 1999). This is a brute force -body code that directly integrates the individual equations of motion for the bodies (stars or binaries) that make up a cluster. Unlike galaxy-scale -body simulations there is no softening involved in the force equation – collisional dynamics is an essential aspect of star cluster evolution. Cumulative weak gravitational interactions drive dynamical relaxation which sets the timescale for processes such as mass-segregation and core-collapse. Stronger interactions can lead to binary formation and the ejection of stars from the cluster. Also important is the feedback between the stellar and binary evolution of the cluster components and the evolution of the cluster itself. For example, mass-loss from stars affects the gravitational potential of the cluster and must be accounted for in self-consistent simulations. Furthermore, star clusters do not evolve in isolation so the tidal field of the host galaxy must also be considered. The strength of the tidal field restricts the physical size of the cluster and also the dynamical evolution timescale.
Traditionally the -body method has been the preferred approach for producing realistic models of star cluster evolution as it lends itself well to incorporating the necessary physics. However, alternatives such as the Monte-Carlo method are quickly catching up and can cope with larger particle numbers (Fregeau et al. 2003). In the meantime, non-direct -body models are very useful for understanding the evolution of larger star clusters. For a review of star cluster evolution and modeling approaches we recommend Meylan & Heggie (1997).
In NBODY4 stellar evolution is provided through the algorithms developed by Hurley, Pols & Tout (2000) which in turn are based on the detailed models of Pols et al. (1998). As such, the radii and masses of the cluster stars are updated in-step with the dynamical evolution of the cluster. Binary evolution is included via the rapid binary evolution algorithm described in Hurley, Tout & Pols (2002). This covers processes such as steady mass-transfer, common-envelope evolution, angular momentum loss through tidal interaction, and coalescence. Dynamical encounters between binaries and single stars are followed. These can lead to significant perturbation of the orbital parameters of binaries and even chaotic orbits or disassociation (Mardling & Aarseth 2001). The formation of triple-star and four-body subsystems, the exchange of stars in and out of binary systems and the possibility of collisions (hyperbolic or within highly-eccentric binaries) are also accounted for. The method in NBODY4 for modelling the tidal field of the Galaxy is to place the cluster on a circular orbit at a specified radial distance, , from the center of a point-mass, , which is the Galactic mass within (see Giersz & Heggie 1997). As suggested by Chernoff & Weinberg (1990) the circular speed of the orbit is taken as for all orbits with kpc. This is clearly an idealized model of the Galaxy and more elaborate external potentials will be explored in future models. Disk shocking – the tidal shocks that a cluster receives as it passes through the Galactic disk (Chernoff, Kochanek & Shapiro 1986) – is an option in NBODY4 but is not implemented in the models presented here. A full overview of the NBODY4 code is given in Aarseth (2003).
2.2 Description of the Model Family
In this work we have a series of NBODY4 models at our disposal that each started with and were performed on the GRAPE-6 boards (Makino, 2002) located at the American Museum of Natural History. The setup of each model was identical except for the fraction of stars in primordial binaries and the strength of the Galactic tidal field. In terms of primordial binaries the fractions considered were , 0.05 and 0.1 where , for single stars and binaries, and . For the tidal field, clusters were placed on circular orbits at either kpc or kpc (the Solar distance) from the Galactic center using the point-mass galaxy approach outlined above. In summary, the models available for analysis are:
-
•
0% primordial binaries and orbiting at kpc;
-
•
0% primordial binaries and orbiting at kpc;
-
•
5% primordial binaries and orbiting at kpc; and,
-
•
10% primordial binaries and orbiting at kpc.
Two realizations of each model were evolved and results presented will be an average of these unless otherwise stated.
In each starting model the masses of the single stars were drawn from the IMF of Kroupa, Tout & Gilmore (1993) between the mass limits of 0.1 and . Each binary mass was chosen from the IMF of Kroupa, Tout & Gilmore (1991), as this had not been corrected for the effect of binaries, and the component masses were set by choosing a mass-ratio from a uniform distribution. This gave an initial total mass of about . The orbital separations of the primordial binaries were drawn from the log-normal distribution suggested by Eggleton, Fitchett & Tout (1989) with a peak at au. A maximum separation of au was imposed. Orbital eccentricities were assumed to follow a thermal distribution (Heggie, 1975). We used a Plummer density profile (Plummer, 1911) and assumed the stars are in virial equilibrium when assigning the initial positions and velocities. The Plummer model is a common choice for the initial density distribution of a model star cluster because of its ease of use numerically (e.g. Aarseth, Hénon & Wielen 1974). There is no evidence that such a model approximates the real density profile of a globular cluster at birth. However, dynamical evolution quickly erases the Plummer profile signature.
A metallicity of was assumed for the stars in these simulations. This is higher than the actual value for NGC which is based on (Harris 1996). However, Hurley et al. (2004) have demonstrated that there is little to no difference in the evolution of cluster models that switch from to . This is because the stellar evolution and mass-loss timescales are similar for these two metallicities. Conversely there are significant differences, such as the timescale for core-collapse, between models based on Population I () and Population II (typically or lower) composition. This is a direct result of differing stellar evolution timescales – the main-sequence lifetime of a solar-mass Population II star is a factor of two shorter than for its Population I counterpart, for example.
2.3 The Main -body Model
It has been established for some time now that globular clusters are born with at least some primordial binaries (Hut et al. 1992) so the 0% models can be considered as reference models rather than models for comparison to NGC. On the other hand, observations of NGC, combined with the results of dynamical models that will be discussed further in Section 3.2, indicate only a modest fraction of primordial binaries (Davis et al. 2008b). As such the model with 5% primordial binaries is preferred to that with 10%.
The orbit of NGC within the Galaxy ranges from a perigalacticon of kpc to an apogalacticon of kpc (Dauphole et al. 1996; Milone et al. 2006; Kalirai et al. 2007). Baumgardt (2001: see also King 1962) showed that when approximating the orbit of a cluster as circular it is preferable to place the cluster near its perigalactic distance – for NGC that means it would be best represented by a model cluster orbiting at –kpc from the Galactic centre. Unfortunately the model placed at kpc has dissolved by an age of Gyr and is thus of little use in comparison to an old globular cluster such as NGC. In contrast, the models placed at kpc have % of their stars remaining after Gyr of evolution and 10% remaining when the simulations are halted at Gyr. Having a model orbit closer to the Galactic center speeds up the cluster evolution and hastens cluster dissolution – effectively the stronger tidal field gives a smaller tidal radius which in turn means a smaller half-mass radius and a shorter half-mass relaxation timescale. That in turn means earlier core-collapse – the star model orbiting at kpc reached core-collapse at Gyr compared to Gyr for the models orbiting at kpc.
It is certainly important for our investigation of NGC to compare the observed data with a model that is at a similar dynamical age. That means post-core collapse. However, we must be careful not to extend the comparison too far into this phase as mass-segregation and the escape of stars, for example, will continue to develop and affect the model parameters. Notably, Baumgardt & Makino (2003) have demonstrated that the modification of the MF slope by dynamical evolution can be quantified in terms of the fractional mass lost from the cluster (see their eq. 14). Our model at kpc has 20% of its initial mass remaining at Gyr. Using eq. 11 of Vesperini & Heggie (1997), with the escape rate of stars and amount of stellar evolution mass-loss calibrated to this model, we can estimate the starting required to give the same fractional mass but at an age of Gyr for a cluster orbiting at kpc (the approximate age and of NGC). The answer is . We can also estimate, based on the initial half-mass relaxation timescale, that such a model would reach core collapse at Gyr. This would therefore be a more appropriate model for comparison to NGC – we have started a model with these parameters but it will take at least a year to complete. As discussed in Section 4 an even larger starting than is required in order to generate a direct model of NGC and such an is not feasible with current computational capabilities. We emphasise at this early stage that the models used in our current study are not direct models of NGC. The impact of this on our analysis as well as future improvements to the model, including consideration of a more elaborate tidal field with tidal shocks, will also be discussed further in Section 4.
All things considered, the model starting with , 5% primordial binaries, and on a circular orbit at kpc from the Galactic center will be the focus of our study. This is our main model for comparison to the NGC data and as such will often be referred to simply as the -body model. The remaining models will be used for comparative purposes.
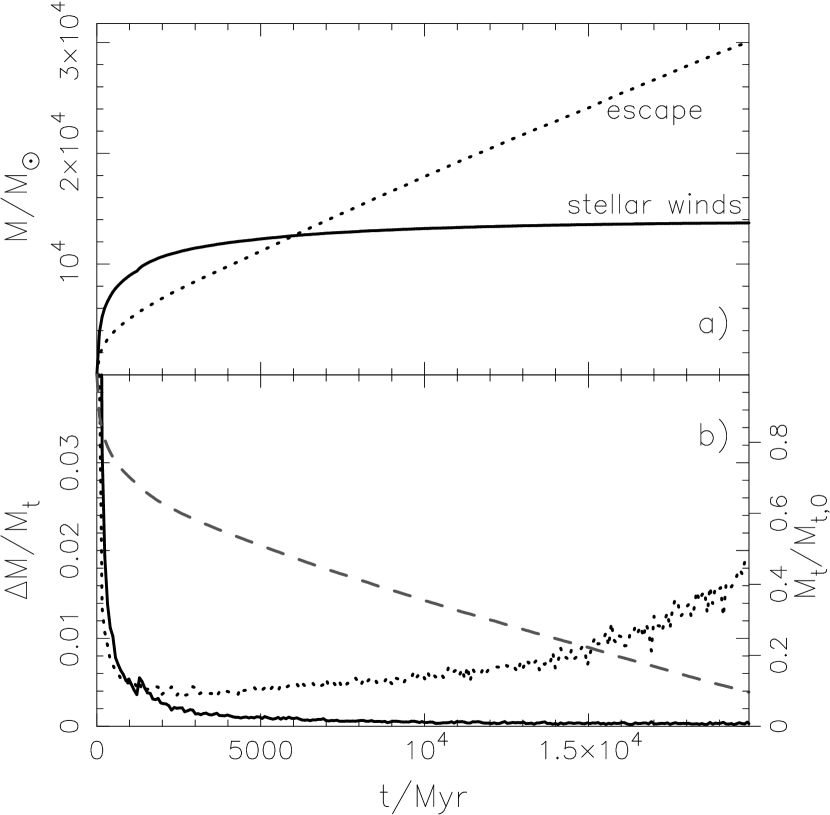
In using our main model we will be applying the results of post-core-collapse models of Gyr or more to understand observations of a post-core-collapse cluster that is Gyr old. So we have a good model in terms of the dynamical state but the stellar evolution ages of the simulated and actual clusters are out of synch by at least Gyr. This is not so much of a concern as it may seem at first glance because stellar evolution, and in particular mass-loss from stellar evolution, is most important during the early stages of cluster evolution and its role diminishes as the cluster population ages (unless the cluster is close to complete dissolution). Figure 2 compares the mass-loss from stellar evolution to that of escaping stars as a function of cluster age for our main model. We can clearly see that the stellar evolution mass-loss rate slows down with time and that escaping stars dominate in the latter stages. As noted by Baumgardt & Makino (2003), the bulk of mass-loss owing to stellar evolution is complete prior to other, dynamically-driven, mass-loss mechanisms coming into play. Consider also that the turn-off mass for a cluster only decreases from to between –Gyr and that the mass of the white dwarfs being produced only varies by over the same timeframe. So the effect of the mismatched stellar evolution age on the mass-segregation observed in the post-core-collapse models is expected to be negligible.
2.4 Evolution Overview
To conclude this section we will give an overview of the evolution of the main -body model. The initial parameters of the single stars and binaries were determined as described above in Section 2.2. Residing at kpc and with an initial mass of produced a tidal radius, , of about pc for the initial model. The initial half-mass radius, , was pc. Note that as demonstrated by Hurley (2007) the two-dimensional projected half-light radius is typically a factor of two less than the three-dimensional half-mass radius. Formally, the Plummer model used for the initial density profile extends to infinite radius but in practice stars placed at great distances are not accepted for the starting model. The ratio of the Plummer model scale-radius, , to the tidal radius of the initial model was 0.1 while the ratio of the radius containing the inner 99% of the cluster mass, , to was 0.77 (0.02% of the cluster by mass lay outside of initially). We note that it takes of order a half-mass relaxation time for the cluster to evolve to a point where the density profile starts to resemble that of a real globular cluster (as described by King 1962). As such it is relevant to compare radii of the model at an age of Gyr (when the evolution age and half-mass relaxation timescale were equal) to the tidal radius: and (increased from 0.13 initially).
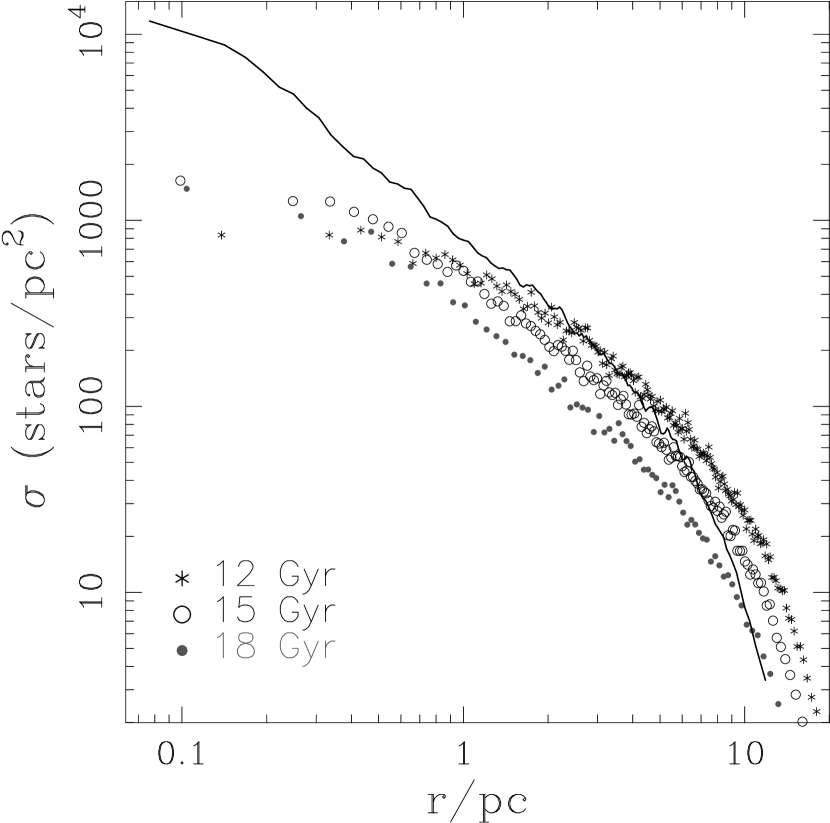
The model cluster was evolved to an age of Gyr. At regular intervals (Myr) snapshots of the cluster are saved which enable post-simulation analysis of the cluster structure and stellar populations. Events occurring between snapshots, such as collisions, are also stored. After an initial phase of expansion the size of the cluster core steadily decreased until reaching a minimum at about Gyr of age. From that point on the cluster is assumed to be post-core-collapse. The half-mass relaxation timescale at core-collapse was Myr, reduced from Myr initially. The core density increased from initially to a local maximum of at Gyr and a maximum of just prior to termination at Gyr. The cluster parameters at various times in the evolution are summarised in Table 1. In Figure 1 we show the evolution of the cluster density profile. This demonstrates that the profile steepens as the model evolves from pre-core-collapse (Gyr), to near core-collapse (Gyr) and then post-core-collapse (Gyr). For comparison, the profile of the cluster evolved on an orbit with kpc is shown at an age of Gyr. This is just prior to the end of the core-collapse phase and finds the model cluster at a comparable dynamical age to that of our main model at Gyr. Clearly the stronger tidal field experienced by the model orbiting closer to the Galactic center has lead to a more centrally-concentrated cluster.
3 Results
We now look at results of the -body model that are particularly relevant to analysis of the NGC observations. All results refer to the main -body model (see Section 2.3) unless otherwise stated. At times we will talk of the ‘outer’ region of the cluster which is intended to correspond to the ACS ‘outer’ field of NGC. The observed field covers a region approximately – half-light radii from the cluster center which for the model corresponds to – half-mass radii from the model center. As such, ‘outer’ is only used in comparison to a central, or ‘inner’, region and does not refer to the very outer, or halo, of the cluster which extends to the tidal radius (typically – half-mass radii).
3.1 Colour-Magnitude Diagram
In Figure 3 we show the model color-magnitude diagram (CMD) at Gyr for stars in the region corresponding to the ACS field (the outer field) and compare this to the CMD of stars in the center of the model. We have not attempted to synthesize photometric error in order to produce scatter in our model CMDs. As such, the narrow, well-defined sequences in the model CMDs are composed of single stars while the more scattered sequences are produced primarily by unresolved binaries. It is evident that the inner region is more abundant in giant and horizontal branch stars, as we would expect from mass-segregation, while the outer region is almost devoid of binaries on the upper main-sequence (MS). We note that the lower end of the MS in Figure 3 extends only to while the observed MS of NGC reaches at the hydrogen-burning limit (see the right-hand panel of Figure 3 and also Fig. 6 of Richer et al. 2007). This is simply a result of choosing as the lower limit to the IMF used in the -body models whereas the mass at the hydrogen-burning limit is reported to be (Richer et al. 2007). The difference in between models of and (taken from the stellar models of Dotter et al. 2007) corresponds roughly to the difference between the end-points of the model and observed CMDs. Note also that reddening has not been applied to the model CMD but this gives only (Hansen et al. 2007).
An age of Gyr corresponds to the approximate stellar evolution age of NGC. However, as discussed in Section 2.3, it is more pertinent for our study to investigate models that correspond to the dynamical age of the cluster. With this in mind we show in Figure 4 the inner and outer field CMDs at a model age of Gyr, when the model cluster has reached the post-core-collapse phase. Once again giant stars, horizontal branch stars and upper-MS binaries are more abundant in the inner field compared to the outer field. We now also have blue straggler stars present but residing in the inner region only. This is a clear demonstration of the ‘binary-burning’ effect expected in globular cluster cores during the late stages of core-collapse (McMillan, Hut & Makino 1990). We also see that in the outer region the white dwarf (WD) sequence is very ‘clean’, meaning that there is minimal contamination from double-white dwarf binaries and divorced single white dwarfs (those that were members of a binary and have followed a non-standard evolution path as a result of mass-transfer and/or a merger). Note also that hot WDs are more likely to be found in the inner field than the outer field. These points regarding white dwarfs will be discussed further in Section 3.4. For comparison we have reproduced the NGC CMD obtained by Richer et al. (2007: see their Figure 5) in both Figures 3 and 4. We find that in all of the obvious stellar population aspects that the outer field CMD of the model at Gyr compares well to the corresponding NGC field (see Richer et al. 2007).
3.2 Binary Fractions
Davis et al. (2008b) have derived a binary fraction of 0.02 for the ACS outer field of NGC. As shown by Hurley, Aarseth & Shara (2007) this should be a good indicator of the primordial binary fraction of the cluster – owing to mass-segregation the binary fraction in the core increases with time but outside of the half-mass radius the binary fraction varies little from the primordial value. To emphasize this point we show in Figure 5 the evolution with cluster age of the binary fractions in the inner and outer fields of our model. After Gyr the inner binary frequency is 9% and the outer frequency is 5% (same as the primordial binary value). This is when all cluster stars (and binaries) are considered. The binary fraction derived by Davis et al. (2008b) was for MS objects only and we show the corresponding binary fraction in Figure 5. In the center of the cluster this fraction is noticeably higher (0.15 at Gyr) than the overall fraction. However, in the outer field there is not such a clear distinction and the MS binary fraction is similar to the primordial binary fraction.
For interest sake we also show in Figure 5 the MS binary fraction if MS-MS binaries with mass-ratios, , less than 0.5 are incorrectly classified as single stars. This is to mimic observational methods that identify binaries through inspection of the CMD MS and cannot distinguish low- binaries from single MS stars as they do not separate clearly from the single MS. This gives an underestimate of the true binary fraction. However, Figure 5 shows that the error induced is not large (although the effect is dependent on the assumed distribution of the primordial binaries). The choice of as the boundary mass-ratio was partly motivated by the work of Hurley & Tout (1998) which showed that binaries with , and primary masses in the range –, sit very close to the single star MS. Davis et al. (2008b) have shown that this condition could be relaxed to , or even 0.3, for the portion of the CMD that is of interest for the analysis of the NGC data (, corresponding to primary masses of or less). If we instead classify binaries with as single stars the difference between the derived binary fraction and the correct MS binary fraction is greatly reduced (compared to using ). Of course, when deriving cluster binary fractions the existence of low- binaries amongst the single star MS can be modeled by making assumptions about the underlying distribution, as has been done by Davis et al. (2008b). What is more difficult to account for is the possible contamination owing to MS-WD binaries where the WD is sufficiently cool that the MS star dominates the light. Such binaries have been counted as single stars when calculating the MS binary fractions shown in Figure 5 but do not make a significant contribution (2% or less of the stars).
3.3 Mass Functions
In Figure 6 we look at how the mass function varies with radius in a model just prior to the end of the core-collapse phase (Gyr). This is supplemented by Figure 7 which does the same for a post-core-collapse model (Gyr). The latter age corresponds to the dynamical age assumed by Richer et al. (2007) in their analysis of the NGC luminosity function. In Figures 6 and 7 only MS stars below the cluster turn-off are included as these have suffered no mass-loss and are therefore potential indicators of the IMF. We divide the cluster into six radial regions chosen such that the number of stars in each region is similar. For each region we show the local MF and compare this to the global MF of the model cluster at that age and the IMF (both are normalized to the local MF). Comparison of the global MF to the IMF (see any panel of Figure 6) shows clearly the effect of the cluster environment in modifying the appearance of the MF – the evolved MF is deficient in low-mass stars and has an overabundance of high-mass stars. This is accentuated in Figure 7, demonstrating that it is an evolutionary effect. Basically, mass-segregation causes stars more massive than the average to sink towards the center of the cluster while stars of lower mass move outwards. As a result low-mass stars are preferentially stripped from the cluster by the tidal field of the host galaxy. This means that the global MF of a dynamically evolved star cluster can not be used to infer the IMF, unless of course the intervening dynamical evolution is properly accounted for (as in Richer et al. 2007).
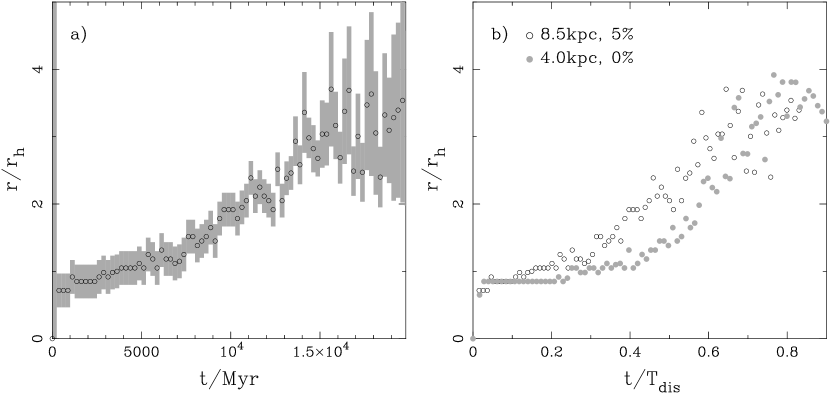
The process of mass-segregation is clearly evident in the radial variation of the MF – in the center of the cluster massive MS stars are more abundant than low-mass stars and the situation reverses as we look progressively further out from the center. At both and Gyr the model indicates that the MF in the – region (corresponding to the NGC field) gives the best representation of the global MF for the same age. This agrees with the earlier findings of King (1996) in relation to NGC. In terms of recovering the IMF, a region slightly further out offers the best hope at Gyr (–) while at Gyr one must look even further from the center. In Figure 8a we show how this optimal region for recovering the IMF varies with cluster age. We see that it moves progressively outwards as the cluster evolves and also becomes less well defined. This result is compared to the behaviour of the model with 0% primordial binaries and orbiting at kpc from the Galactic Center in Figure 8b (with time scaled by the cluster dissolution time – see caption for details). The scaled behaviour of the models is similar except perhaps at intermediate ages – leading up towards core-collapse – where the optimal MF region is relatively closer to the cluster center for the model cluster on a tighter orbit.
Davis et al. (2008b) present the MFs for NGC stars observed in the WFPC2 (central) and ACS (outer) fields. The MF for MS stars in the central field rises towards higher masses and then flattens out – this agrees well with what we observe in the central region of the model (upper-left panel of Fig. 6). The MF in the outer field does the opposite, rising towards lower masses, which again is in good agreement with the corresponding model region (middle-left panel of Fig. 6). However, Davis et al. (2008b) find a turnover in the outer field MF at a mass of about which is not observed in the model MF. The MF of the model cluster in the region certainly does flatten at the low-mass end as the cluster evolves (comparing Figs. 6 and 7) but at no stage do we see a turn-over at the low-mass end, even when looking at the very outer regions. One could expect that this behaviour will be dependent on the strength of the external tidal field – a stronger tidal field will be more efficient at removing low-mass stars. Taking our star model evolved on an orbit at kpc from the Galactic Center (as opposed to kpc) and looking at the MFs at an age of Gyr we do see evidence of the MF ‘turning-over’ at the low-mass end. We note though that the data are rather noisy in this case and we will need to wait until simulations with a larger initial are completed before investigating this fully.
3.4 White Dwarfs
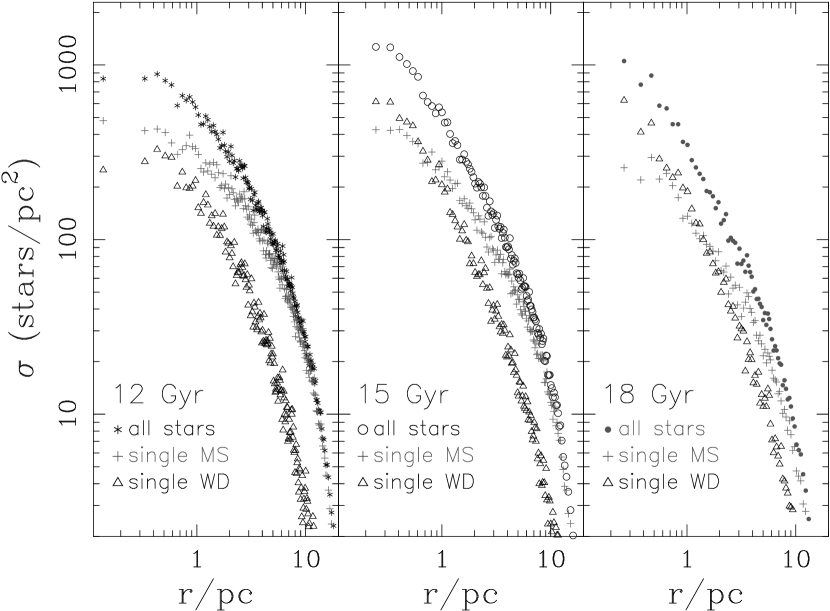
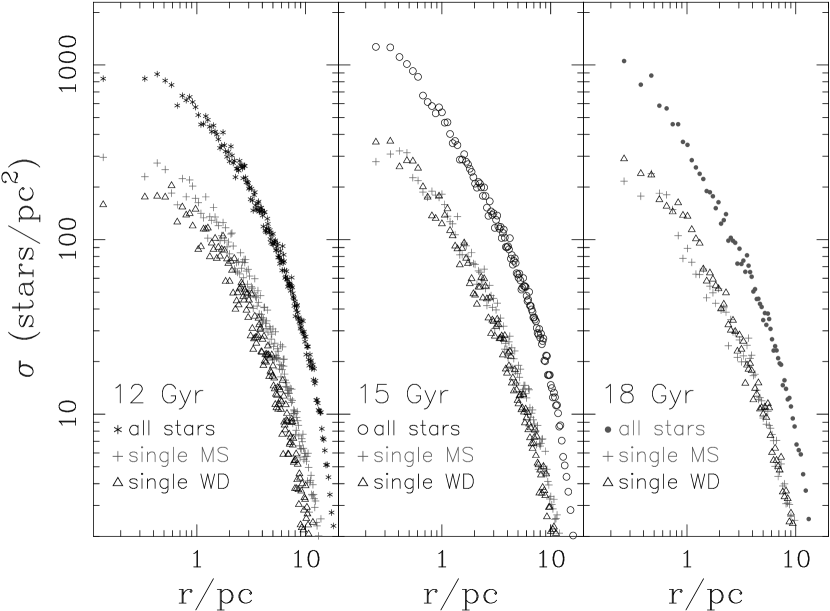
We next turn our attention to the white dwarf population. Considering that white dwarfs are born from relatively massive cluster stars (which are more likely to reside in the cluster center: see Figure 4 or Figure 6) it is to be expected that the WD population of a dynamically old cluster should be more centrally condensed than that of the MS stars. This is demonstrated in Figure 9. However, it is also true in old clusters that WDs born in the core will segregate outwards in radius as they will be less massive than the average mass of objects (stars and binaries) in the core. If we instead look at WDs and MS stars in the same mass range (–: Figure 10) we actually find that they follow similar distributions. The point here is that the structure of the WD population will vary across the cluster and the variation depends on the stellar and dynamical age of the cluster. Another issue that has been raised recently is the possibility that WDs receive a small velocity kick at birth (Fellhauer et al. 2003; Davis et al. 2008a). The young WDs observed in NGC have been shown by Davis et al. (2008a) to have a more extended radial distribution than predicted by the -body models presented here and these models do not include natal kicks for WDs.
Of interest is the possible presence in the WD cooling sequence of double-WD binaries and non-standard, or ‘divorced’, single WDs that may affect the determination of the true WD cooling age of the cluster. Double-WDs are less of a concern as they are generally distinguishable in the CMD. They are also less likely to be present in a field outside of the cluster center, as is shown in Figure 4. However, ‘divorced’ WDs – those that have had their stellar clock reset by mass-transfer in a binary that was subsequently disrupted – are more difficult to distinguish. In Figure 11 we show the radial distribution of the divorced-WD fraction at ages of , and Gyr. Prior to core-collapse the fraction is clearly higher in the center compared to the outer regions and it would make sense to observe a field in the latter. As the cluster becomes further evolved the fraction of divorced-WDs increases and the radial variation diminishes. However, the percentage of these WDs always remains below 10% and as shown in Hansen et al. (2007) the majority will not have had their stellar clocks affected sufficiently to affect the resulting WD luminosity function. One area where divorced WD contamination may be an issue is in the detection of post-cataclysmic variables which are expected to lie slightly off the standard WD sequence owing to residual heat from the mass-accretion process (e.g. Townsley & Bildsten 2002). Looking at Figures 3 and 4 we see that divorced WDs, which are similarly affected by mass accretion, could present confusion amongst such detections.
4 Discussion
Considering that observed data is generally only obtained for a portion of a globular cluster, and that the location of the portion with respect to the cluster center may vary from study-to-study and cluster-to-cluster, it is important to understand how the local MF of a cluster varies with distance from the cluster center and how this compares to the global MF. We have shown that the local MF provides a good match to the global MF at, or just outside of, the half-mass radius of a cluster. This result is true at any age, including post-core-collapse. An earlier study by Vesperini & Heggie (1997) also found that the MF in the intermediate region of a cluster provides a good resemblance to the global MF throughout the entire evolution. In this work the results were primarily based on -body simulations with but with the claim that with careful scaling of the simulation time by the relaxation timescale the results could be taken to represent clusters starting with in stars. This is comparable to the actual initial mass of our simulation and indicates that the Vesperini & Heggie (1997) results do scale well to larger (or ). More recently Baumgardt & Makino (2003) have looked at MF evolution based on -body models with the initial ranging from to stars. They also found that the intermediate region, and in particular the region just outside of the half-light radius, gives the best agreement with the global MF.
Interior to the half-mass radius the local MF becomes dominated by massive stars and has a flatter (or even reversed) slope compared to the global MF. Conversely, measuring the local MF in the halo of a cluster produces a steeper slope than that of the global MF. As discussed by Vesperini & Heggie (1997) the evolution of the MF is a competition between mass-segregation and the escape (or evaporation) of stars owing to relaxation. The former effect flattens the MF in the inner regions of the cluster as it evolves while steepening the MF in the outer regions. However, the loss of stars from the outer region will act to flatten the MF so that the actual appearance of the MF in this region will depend on the relative efficiency of the two processes. Comparing the IMF and the local MF in the outermost shell of Figure 6 we see that the slopes are similar, with some flattening at the low-mass end. So at this age (Gyr: near core-collapse) the escape of stars is only slightly more efficient than the process of mass-segregation. Looking at the cluster later (Figure 7) the MF of the outermost shell is significantly flattened showing that the escape of stars is dominating as the cluster moves closer to dissolution. In Figure 8 we have attempted to give some indication of what is the best region of a cluster to observe in order to determine the IMF. In reality, owing to the dynamical processes just discussed, the present day MF quickly loses memory of the IMF (see also Vesperini & Heggie 1997). Certainly by the time a cluster has reached core-collapse there is little hope of inferring the IMF unless the intervening action of the cluster dynamics is properly modeled. In the past it has often been the practice to fit multi-mass King-Michie models to the observed mass (or luminosity) function in order to correct for the effects of mass-segregation. However, these models assume energy equipartition and while clusters tend towards such a state it has been shown with -body models that energy equipartition is only reached at late stages in the evolution, if at all in the outer regions (Giersz & Heggie 1996; Baumgardt & Makino 2003). We tend to agree with Baumgardt & Makino (2003) that the effect of mass segregation, which is driven by energy equipartition, is best modeled by dynamical models.
A distinction between our models and those presented previously by Vesperini & Heggie (1997) and Baumgardt & Makino (2003), for example, is that we have included primordial binaries. Looking at the radial variation of the MF in our 0% binary reference model we do find that the local and global MFs generally match slightly nearer to the cluster center than they do for the 5% binary models at the same age. This makes some sense owing to the difference in dynamical ages at the same physical age – models with primordial binaries loses stars at a faster rate and thus have a shorter relaxation timescale compared to models without primordial binaries. As a result mass-segregation is more developed in the center of a primordial binary model and one must look further out to get a match to the global MF (or the IMF: the effect is noticeable in Figure 8). However, observing near the half-mass radius is still optimal for recovering the global MF of an evolved star cluster, with or without binaries. The radial variation of the MF in our model with 10% primordial binaries is indistinguishable from that of the 5% model.
Previous studies have demonstrated that the evolution of the mass function slope of a star cluster is strongly influenced by the position of a cluster with respect to the Galactic center (Vesperini & Heggie 1997; Baumgardt & Makino 2003). This is a result of the evaporation of stars across the tidal boundary owing to two-body relaxation proceeding at a faster rate for clusters at smaller . We have touched on this topic in Section 2 when comparing the evolution timescales of model clusters at of 4 and kpc. The issue will be investigated further in the near future when we present updated models for comparison to NGC (see below). However, Baumgardt & Makino (2003) have demonstrated that scaling model ages by their half-mass relaxation times removes the scaling of the MF evolution. It is also interesting to note that Vesperini & Heggie (1997) found that the initial concentration of a cluster caused only a slight change in the two-body relaxation driven evaporation rate and thus had little effect on the MF slope. This is an important point considering that our current model has a lower core density than large core-collapse clusters such as NGC. Baumgardt & Makino (2003) also showed that the density profile of a cluster was not a major factor in the MF evolution. Furthermore, they found that the MF behaviour could be scaled with provided that models were compared at the same fractional lifetime. So we can be fairly comfortable comparing our model to the NGC data at similar dynamical ages.
An effect that does have a potential bearing on the observed MF slope is disk-shocking. This has not been included in our model. Disc shocking has been shown by Vesperini & Heggie (1997) to flatten the MF slope for clusters near the Galactic center (kpc) but causes only minor differences for clusters on more distant orbits (kpc). As noted by Vesperini & Heggie (1997) disk shocking is a mass-independent process in that the velocity change induced for a particular star depends only on the distance from the cluster center and not on the stellar mass. This means that disk shocking alone cannot alter the MF slope but in combination with mass segregation it can have a noticeable effect. The tidal shocks produced by frequent disk passages are certain to have played a role in the dynamical evolution of NGC – the disk crossing time is Myr (Kalirai et al. 2007) which is comparable to the current half-mass relaxation time of Myr (Harris 1996). This is an aspect we will be aware of when presenting future models for comparison with this cluster. Driven in part by the computational constraints that have kept small there has historically been little need for more than a simplistic treatment of tidal fields in -body codes. Circular orbits about a point-mass galaxy and with an absence of disk-shocking are adequate for comparison to open clusters that reside in the Galactic disk. However, now that comparisons to globular cluster evolution are being considered, such a tidal field is a clear simplification. An obvious way to overcome this is to compute the orbit of the cluster in a realistic (and time-varying) Galactic potential and to do this in-step with modeling the cluster evolution. Such an approach will also be considered in future work.
The results presented here and in Hurley et al. (2007), coupled with the binary frequency of 2% measured by Davis et al. (2008b) for NGC, indicate a very modest primordial binary content for the cluster. Indeed, Figure 5 shows that the binary fraction for MS stars may actually be an overestimate of the binary fraction for all stars in an evolved cluster. So 2% may be an upper limit for the primordial binary frequency of NGC. However, there are other considerations. The distribution of orbital separations of the primordial binaries in the -body model was capped at au. If distributions of orbital parameters derived for field binaries, such as those of Duquennoy & Mayor (1991) showing periods extending to d, are taken as relevant to binaries formed in globular clusters (which is not necessarily the case) then this means that a number of wide binaries have been neglected from the starting model. These neglected binaries will be loosely bound, or “soft”, and quickly broken-up in encounters with other stars or binaries (Heggie 1975). Therefore they will be of little consequence to the dynamical evolution of the cluster but they will impact the primordial binary fraction inferred from later values. The effect is discussed more fully in Hurley et al. (2007) and the worst-case scenario has the true primordial binary fraction being twice that used in the model. So the primordial binary frequency of NGC could have been closer to 5% but certainly nowhere near as high as the 100% that has been proposed to explain current observations of the core binary fractions of clusters such as 47 Tucanae (Ivanova et al. 2005 – although there are differences in the models presented in that study and here that need to be resolved). We note that our model starting with 10% primordial binaries has a binary frequency of 9% in the outer field at Gyr.
It is important to realize that none of the -body models utilized in this work are being put forward as specific models of NGC. Instead we are using models that combine dynamical, stellar and binary evolution processes to aid our interpretation of the HST data for this cluster. NGC is a core-collapsed cluster so we have chosen to focus on our simulated cluster at Gyr, when it first reaches core-collapse, and up to Gyr. Beyond this point the number of stars remaining decreases to levels where it becomes difficult to draw statistically significant inferences, especially when looking at radial variations within a model. We are not claiming that any of these times correspond to the age of NGC and ideally we would have a post-core-collapse model at Gyr earlier for comparison. However for old clusters such a difference is not substantial in stellar evolution terms (mass-loss rates and the main sequence turn-off mass, for example) so a comparison between the model and the data remains useful, especially when trying to understand the dynamical state of the cluster. To produce a model that exhibits core-collapse at an earlier age can be achieved by placing the cluster on an orbit closer to the Galactic center. As we have demonstrated this brings forward the onset of core-collapse but also leads to earlier cluster dissolution. Therefore, a corresponding increase in is also required in order to have stars remaining at the age of interest.
Ideally we would perform a direct -body model of NGC with star-to star correspondence between the real and model cluster as has been done for open clusters such as M67 (Hurley et al. 2005). However, even when using special-purpose hardware such as the GRAPE boards the scaling of the -body problem makes this computationally unfeasible. Consider that the simulations each took between –months to complete (with those orbiting at kpc being the quickest) and had at most of stars remaining at the age of NGC. This is a factor of 5–10 less than the estimated current mass of the cluster (Drukier 1995; Gnedin & Ostriker 1997). To evolve a cluster on an orbit at –kpc from the Galactic center and have this much mass remaining at about Gyr would require a starting model with , as a rough estimate. This is clearly outside the scope of current -body models and will only be realised with future hardware advances.
Currently we have started an NBODY4 simulation with stars and 2% primordial binaries on an orbit at kpc from the Galactic center (closer to the true orbit of NGC). This is projected to experience core-collapse at an age of –Gyr with stars remaining but will also take up to a year to complete on a single 32-chip GRAPE-6 board. We note that while this improves the timescale problem it will still not be a direct model of NGC and scaling issues related to the mismatch of , such as differences in the central density and velocity dispersion, will remain. However, when completed, this model in combination with the NGC HST data will further enhance our understanding of globular cluster evolution.
5 Summary
We have presented -body models of star cluster evolution created with the NBODY4 code. A range of models each starting with stars and/or binaries have been considered with the proportion of primordial binaries (0, 5 or 10%) and the galactocentric radius of the cluster orbit ( or kpc) being the parameters varied across the models. The model with 5% primordial binaries on a circular orbit at kpc from the Galactic center is the main focus of this work. This model reached core-collapse at an age of Gyr and was terminated at Gyr when 9% of the initial cluster mass remained bound.
To mimic observations of the globular cluster NGC we have contrasted the appearance of the model cluster in the center of the cluster with that in a region just outside of the half-mass radius. We look in detail at the evolution of the mass function and show that the local mass function of main-sequence stars near the half-mass radius is a good representation of the global mass function of a post-core-collapse cluster. The development of mass segregation is demonstrated – our models complement previous work in this area that has been performed without the inclusion of primordial binaries. The mass functions and color-magnitude diagrams of the model are a good match to observations of NGC. We have also confirmed that the binary fraction of 0.02 observed near the half-mass radius of NGC can be taken as representative of the primordial binary fraction of the cluster.
We have discussed the validity of comparing a non-direct model with observations of NGC in terms of the number of stars, the stellar evolution age, the density of stars and position within the Galaxy. Future models will be performed with twice the number of stars and will look at incorporating a non-idealized model of the Galactic potential as well as the effects of disk shocking.
References
- Aarseth, Hénon & Wielen (1974) Aarseth, S., Hénon, M., & Wielen, R. 1974, A&A, 37, 183
- Aarseth (1999) Aarseth, S.J. 1999, PASP, 111, 1333
- Aarseth (2003) Aarseth, S.J. 2003, Gravitational N-body Simulations: Tools and Algorithms (Cambridge Monographs on Mathematical Physics). Cambridge University Press, Cambridge
- Baumgardt (2001) Baumgardt, H. 2001, MNRAS, 325, 1323
- Baumgardt & Makino (2003) Baumgardt, H., & Makino, J. 2003, MNRAS, 340, 227
- Bergeron, Wesemael & Beauchamp (1995) Bergeron, P., Wesemael, F., & Beauchamp, A., 1995, PASP, 107, 1047
- Castelli & Kurucz (2003) Castelli, F., & Kurucz, R.L. 2003, in Proc. IAU Symp. 210, Modelling of Stellar Atmospheres, ed. N. Piskunov, W.W. Weiss & D.F. Gray (San Francisco: ASP), A20
- Chernoff, Kochanek & Shapiro (1986) Chernoff, D.F., Kochanek, C.S., & Shapiro, S.L. 1986, ApJ, 309, 183
- Chernoff & Weinberg (1990) Chernoff, D.F., & Weinberg, M.D. 1990, ApJ, 351, 121
- Dauphole et al. (1996) Dauphole, B., Geffert, M., Colin, J., Ducourant, C., Odenkirchen, M., & Tucholke, H.-J. 1996, A&A, 313, 119
- Davis et al. (2008a) Davis, S., Richer, H.B., King, I., Anderson, J., Coffey, J., Fahlman, G.G., Hurley, J., & Kalirai, J.S. 2008a, MNRAS, 383, L20
- Davis et al. (2008b) Davis, S., et al. 2008b, AJ, submitted
- de la Fuente Marcos (1996) de la Fuente Marcos, R. 1996, A&A, 314, 453
- Djorgovski & King (1986) Djorgovski, S., & King, I.R. 1986, ApJ, 305, L61
- Dotter et al. (2007) Dotter, A., Chaboyer, B., Jevremović, D., Baron, E., Ferguson, J.W., Sarajedini, A., & Anderson, J. 2007, AJ, 134, 376
- Drukier (1995) Drukier, G.A. 1995, ApJS, 100, 347
- Duquennoy & Mayor (1991) Duquennoy, A., & Mayor, M. 1991, A&A, 248, 485
- Eggleton, Fitchett & Tout (1989) Eggleton, P.P., Fitchett, M., & Tout, C.A. 1989, ApJ, 347, 998
- Fellhauer et al. (2003) Fellhauer, M., Lin, D.N.C., Bolte, M. Aarseth, S.J., & Williams, K.A. 2003, ApJ, 595, L53
- Fregeau et al. (2002) Fregeau, J.M., Joshi, K.J., Portegies Zwart, S.F., & Rasio, F.A. 2002, ApJ, 570, 171
- Fregeau et al. (2003) Fregeau, J.M., Gürkan, M.A., Joshi, K.J., & Rasio, F.A. 2003, ApJ, 593, 772
- Giersz & Heggie (1996) Giersz, M., & Heggie, D.C. 1996, MNRAS, 279, 1037
- Giersz & Heggie (1997) Giersz, M., & Heggie, D.C. 1997, MNRAS, 286, 709
- Gnedin & Ostriker (1997) Gnedin, O.Y., & Ostriker, J.P. 1997, ApJ, 474, 223
- Hansen et al. (2007) Hansen, B.M.S., Anderson, J., Brewer, J., Dotter, A., Fahlman, G.G., Hurley, J., Kalirai, J., King, I., Reitzel, D., Richer, H.B., Rich, R.M., Shara, M.M., & Stetson, P.B. 2007, ApJ, 671, 380
- Harris (1996) Harris, W.E. 1996, AJ, 112, 1487
- Heggie (1975) Heggie, D.C. 1975, MNRAS, 173, 729
- Hurley (2007) Hurley, J.R. 2007, MNRAS, 379, 93
- Hurley, Aarseth & Shara (2007) Hurley, J.R., Aarseth, S.J., & Shara, M. M. 2007, ApJ, 665, 707
- Hurley, Pols & Tout (2000) Hurley, J.R., Pols, O.R., & Tout, C.A. 2000, MNRAS, 315, 543
- Hurley et al. (2005) Hurley, J. R., Pols, O.R., Aarseth, S.J., & Tout, C. A. 2005, MNRAS, 363, 293
- Hurley & Tout (1998) Hurley, J. R., & Tout, C. A. 1998, MNRAS, 300, 977
- Hurley, Tout & Pols (2002) Hurley, J. R., Tout, C. A., & Pols, O.R. 2002, MNRAS, 329, 897
- Hut et al. (1992) Hut, P., McMillan, S., Goodman, J., Mateo, M., Phinney, E. S., Pryor, C., Richer, H. B., Verbunt, F., & Weinberg, M. 1992, PASP, 104, 981
- Ivanova et al. (2005) Ivanova, N., Belczynski, K., Fregeau, J.M., & Rasio, F.A. 2005, MNRAS, 358, 572
- Kalirai et al. (2007) Kalirai, J.S., Anderson, J., Richer, H.B., King, I.R., Brewer, J., Carraro, G., Davis, S.D., Fahlman, G.G., Hansen, B.M.S., Hurley, J.R., Lépine, S., Reitzel, D., Rich, R.M., Shara, M.M., & Stetson, P.B. 2007, ApJ, 657, L93
- Khalisi, Amaro-Seoane & Spurzem (2007) Khalisi, E., Amaro-Seoane, P., & Spurzem, R. 2007, MNRAS, 374, 703
- King (1962) King, I.R. 1962, AJ, 67, 471
- King (1966) King, I.R. 1966, AJ, 71, 64
- King (1996) King, I.R. 1996, in Proc. IAU Symp. 174, Dynamical evolution of star clusters: confrontation of theory and observations, ed. P. Hut & J. Makino (Dordrecht: Kluwer), 29
- King et al. (1998) King, I.R., Anderson, J., Cool, A.M., & Piotto, G. 1998, ApJ, 492, L37
- Kroupa, Tout & Gilmore (1991) Kroupa, P., Tout, C. A., & Gilmore, G. 1991, MNRAS, 251, 293
- Kroupa, Tout & Gilmore (1993) Kroupa, P., Tout, C. A., & Gilmore, G. 1993, MNRAS, 262, 545
- Makino (2002) Makino, J. 2002, in ASP Conference Series 263, Stellar Collisions, Mergers and their Consequences, ed. M.M. Shara (San Francisco: ASP), 389
- Mardling & Aarseth (2001) Mardling, R.A., & Aarseth, S.J. 2001, MNRAS, 321, 398
- McMillan, Hut & Makino (1990) McMillan, S., Hut, P., & Makino, J. 1990, ApJ, 362, 522
- Meylan & Heggie (1997) Meylan, G., & Heggie D.C. 1997, A&ARv, 8, 1
- Milone et al. (2006) Milone, A.P., Villanova, S., Bedin, L.R., Piotto, G., Carraro, G., Anderson, J., King, I.R., & Zaggia, S. 2006, A&A, 456, 517
- Pasquini et al. (2004) Pasquini, L., Bonifacio, P., Randlich, S., Galli, D., & Gratton, R.G. 2004, A&A, 426, 651
- Piotto & Zoccali (1999) Piotto, G., & Zoccali, M. 1999, A&A, 345, 485
- Plummer (1911) Plummer, H.C. 1911, MNRAS, 71, 460
- Pols et al. (1998) Pols, O.R., Schröder, K.-P., Hurley, J.R., Tout, C.A., & Eggleton, P.P. 1998, MNRAS, 298, 525
- Richer et al. (2006) Richer, H.B., Anderson, J., Brewer, J., Davis, S., Fahlman, G.G., Hansen, B.M.S., Hurley, J., Kalirai, J.S., King, I.R., Reitzel, D., Rich, R.M., Shara, M.M., & Stetson, P.B. 2006, Science, 313, 936
- Richer et al. (2007) Richer, H.B., Dotter, A., Hurley, J., Anderson, J., King, I., Davis, S., Fahlman, G.G., Hansen, B.M.S., Kalirai, J., Paust, N., Rich, R.M., & Shara, M.M. 2007, AJ, accepted (astro-ph/0708.4030)
- Spitzer (1987) Spitzer, L.Jr. 1987, Dynamical Evolution of Globular Clusters. Princeton University Press, Princeton
- Townsley & Bildsten (2002) Townsley, D.M., & Bildsten, L. 2002, ApJ, 565, L35
- Vesperini & Heggie (1997) Vesperini, E., & Heggie, D.C. 1997, MNRAS, 289, 898


| 0.0 | 100000 | 0.050 | 51910 | 2.72 | 6.66 | 1400.0 | 3.63 |
| 2000.0 | 84510 | 0.048 | 32830 | 3.40 | 8.58 | 2215.0 | 2.67 |
| 4000.0 | 74660 | 0.048 | 28455 | 3.06 | 8.56 | 2120.0 | 2.51 |
| 6000.0 | 64440 | 0.048 | 24845 | 2.63 | 8.15 | 1850.0 | 2.40 |
| 8000.0 | 54450 | 0.049 | 21590 | 2.21 | 7.50 | 1505.0 | 2.34 |
| 10000.0 | 44910 | 0.051 | 18525 | 1.61 | 6.89 | 1200.0 | 2.26 |
| 12000.0 | 36150 | 0.052 | 15670 | 0.97 | 6.10 | 905.0 | 2.20 |
| 14000.0 | 28100 | 0.053 | 12925 | 0.68 | 5.44 | 670.0 | 2.13 |
| 16000.0 | 20710 | 0.054 | 10140 | 0.17 | 4.97 | 490.0 | 1.96 |
| 18000.0 | 14190 | 0.053 | 7405 | 0.34 | 4.77 | 390.0 | 1.76 |
| 20000.0 | 8950 | 0.055 | 4895 | 0.17 | 4.12 | 250.0 | 1.55 |
Note. — Columns show the cluster age (Myr), number of objects (stars and binaries), binary fraction, total mass (), core-radius (pc), half-mass radius (pc), half-mass relaxation timescale (Myr) and velocity dispersion ().