Phase diagram of a solution undergoing inverse melting
Abstract
The phase diagram of -cyclodextrin/water/4-methylpyridine solutions, a system undergoing inverse melting, has been studied by differential scanning calorimetry, rheological methods, and X-rays diffraction. Two different fluid phases separated by a solid region have been observed in the high -cyclodextrin concentration range (150 mg/ml). Decreasing , the temperature interval where the solid phase exists decreases and eventually disappears, and a first order phase transition is observed between the two different fluid phases.
pacs:
61.10.Nz, 61.25.Em, 64.70.-pInverse melting indicates the counter-intuitive phenomenon of the solidification of a liquid upon heating. This phenomenon implies the existence of solids with entropy higher than their liquid counterparts, and this is recently attracting the attention of both theoretical and experimental works Rastogi et al. (1991, 1999); Greer (2000); Portmann et al. (2003); Stillinger and Debenedetti (2003); Schupper and Shnerb (2005); Sellitto (2006); Schupper and Shnerb (2004); Crisanti and Leuzzi (2005); Feeney et al. (2003). A list of materials showing inverse melting are reported in ref. Schupper and Shnerb (2005). Theoretical studies, due to the difficulties of describing real systems, developed different ad-hoc models. All these models allow for the competition between different interparticle multiple interactions, a feature which may lead to ”crystal” with an entropy content higher than the corresponding ”liquid”. Examples are: i) a spin model for fragile glass-forming liquids Sellitto (2006); ii) spin glasses Schupper and Shnerb (2004, 2005); Crisanti and Leuzzi (2005); and iii) particles interacting with a specific model potential Feeney et al. (2003). These studies derive the temperature vs crystal field phase diagrams, which turn out to be characterized by: i) an inverse transition from a paramagnetic phase to a glass Sellitto (2006), or to a spin glass Crisanti and Leuzzi (2005); Schupper and Shnerb (2005, 2004) phase for certain values of the crystal field; ii) a reentrance in the transition line Crisanti and Leuzzi (2005); Schupper and Shnerb (2005, 2004); Sellitto (2006); and iii) a first-order transition line between two paramagnetic phases ending in a critical point at high values of the crystal field Sellitto (2006).
On the experimental side, real systems showing inverse melting, also display complex and exotic phase diagrams due to the variety of microscopic interactions. This, together with the extreme thermodynamic conditions often required, prevents comprehensive investigations of the inverse melting phenomenon. With this respect, a particularly interesting system is the solutions composed of -cyclodextrin (CD) (C36H60O30), water and 4-methylpyridyne (4MP) (C6H7N). This system has been recently discovered by Plazanet et al. Plazanet et al. (2004) to undergo inverse melting at easily accessible thermodynamic conditions. These solutions, in fact, show a ”low temperature” liquid (LTL) phase which solidifies upon heating Plazanet et al. (2004); R.Angelini and G.Ruocco (2007); Tombari et al. (2005) into a high temperature crystal phase (HTC). Therefore, they provide an ”ideal” situation to study experimentally the variety of phenomenologies recently predicted theoretically.
In this work, using differential scanning calorimetry, rheological methods and X-rays diffraction, we further investigate the phase diagram of -cyclodextrin (CD) (C36H60O30), water and 4-methylpyridyne (4MP) (C6H7N) solutions, extending the concentration and temperature ranges with respect to previous studies. At CD concentrations 150 mg/ml we find that the ”high temperature” crystal (HTC), if further heated, melt into a fluid phase, that we refer to as the ”high temperature” fluid (HTF). By decreasing the concentration, the temperature range of existence of the HTC decreases, and eventually disappears, and we observe a phase transition between two fluid phases. Specifically, we found that: i) in the range of concentration 150 mg/ml of CD in 4MP, two fluid phases exist in two different temperature ranges, separated by a temperature interval where the material is in a crystalline phase, ii) at concentration smaller than 150 mg/ml, the crystal phase is no longer observable and the two fluids are contiguous in the phase diagram, and iii) the phase transition between the two fluids is of first order nature.
Differential scanning calorimetric (DSC) measurements, using a Diamond Perkin-Elmer calorimeter, have been used to locate the different phase transitions, and to measure the latent heat of transformation. Sealed standard aluminium sample pans with a volume of 10 and 50 l have been used as cells and references. Samples have been prepared using alpha-cyclodextrin hydrate (Aldrich), water and 4MP (Aldrich) at different concentrations with molar ratios respectively of 1:6:x, and x varying between 30-200. The powder was dispersed in 4MP and water and then stirred for almost 4 hours until the suspensions were cleared. The thermograms shown in Fig 1, i.e. the heat flows () as a function of temperature, have been obtained at a heating rate =10 K/min. The measurements were repeated at least five times for each concentration, and all transitions have been found to be reproducible and reversible.

In the concentration region 170-340 mg/ml of CD in 4MP, as shown in Fig. 1, three endothermic peaks are detected on increasing temperature: the first one, signature of inverse melting, corresponds to the LTL-HTC transition Plazanet et al. (2004), the intermediate one has been associated to a solid-solid transition between two of the five crystalline phases detected by X-rays on similar samples Plazanet et al. (2006). The third one corresponds to the melting of HTC into the HTF phase.
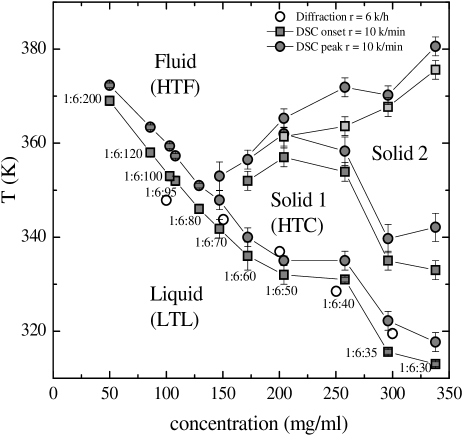
The solid and liquid nature of the HTC, LTL and HTF phases have been assessed by visual inspection. The transition temperatures, as determined from the thermograms, are shown as a function of the concentration in Fig. 2. The temperatures of the peak (Tpeak) and of the onset (Tonset) are shown as full circles and squares respectively, and provide a range for the absolute value of the transition temperatures. In the high concentration range, the phase diagram in Fig. 2, beside reproducing the known inverse melting LTL-HTC transition, also reports the melting of the crystal in the high temperature fluid, HTF. At lower concentrations, below and close to =150 mg/ml, not only the intermediate solid-solid transition is no longer visible, but the whole solid phase disappears and the LTL-HTC and HTC-HTF transition lines merge into each other. Most importantly, as shown in Fig. 3, for concentration 130 mg/ml, the thermograms show only one well defined peak.

The endothermic peak of Fig. 3 is observable down to =50 mg/ml of CD in 4MP, and below this concentration it falls below the sensitivity of the present experiment. The peak area is reported in the inset of Fig. 3 as a function of the CD/4MP mass ratio. These data indicate the decrease of the heat necessary to the system to complete the LTL-HTF transition.
.
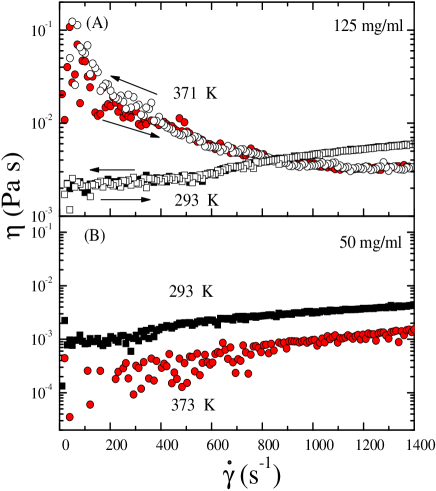
A different rheological behavior between the LTL and HTF is also observed in the shear dependent viscosity measurements reported in Fig. 4. In Fig. 4A, as an example, we report shear viscosity measurements as a function of shear rate at c=125 mg/ml in the HTF (circles) and LTL (squares) phases, which show an opposite behavior: shear thinning for the HTF and shear thickening for the LTL. In Fig. 4B we report shear viscosity measurements at almost the same temperatures of Fig. 4A for a much lower concentration sample, c=50 mg/ml, in the LTL phase, the behavior is again shear thickening-like. In conclusion, the HTF is structurally different from the LTL.
The phenomenology described so far provides only a macroscopic description of the two liquid phases, without suggestion on how they differ from each other at the microscopic level. In order to investigate this point, the HTF and LTL phases have been studied by X-ray diffraction. The experiment has been performed on the beamline BM29 at the European Synchrotron Radiation Facility, using 15 keV ( = 0.86 ) incident photons. The samples were contained in a 2 mm diameter boro-silicate capillary. The scattered intensity was collected using a MAR345 image plate detector, and the geometrical parameters were calibrated via Ag standard. The data analysis was performed using the FIT2D software package Hammersley et al. (1996). We investigated three CD-water-4MP solutions with =50, 86 and 108 mg/ml. As an example, data at =108 mg/ml and in the temperature range 295413 K are shown in Fig. 5 after empty cell subtraction. The diffraction data, I(Q), reproduce the typical shape of the static structure factor of a liquid, both below and above the LTL-HTF transition. More important, the temperature dependence of I(Q) shows changes in the -region of the first minimum and first maximum.
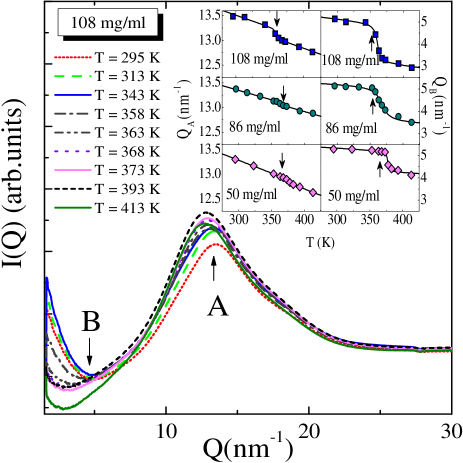
In order to qualitatively represent the temperature changes of the structural features we arbitrarily selected two representative points. Namely, we chose the positions of the first maximum (around = 13 nm-1) and minimum (around = 4 nm-1), identified as and . The values of these two points are reported in the insets of Fig. 5 as a function of temperature for the three investigated concentrations. Each curve shows a jump at the temperatures which are reported (stars) in the phase diagram of Fig. 2. They, within the error bars, are in agreement with the DSC measurements. We also note that the amplitude of the jumps in Fig. 5 are more pronounced at the higher concentration, suggesting, similarly to the inset of Fig. 3, that the phase transition line between the LTL and HTF tends to disappear on lowering . The present diffraction data do not allow to determine the structure of the LTL and HTF phases at the molecular level, although they clearly underline the presence of a marked structural difference. These results therefore stimulate further experimental and theoretical investigations. In particular a point which needs to be assessed and which cannot be completely excluded on the basis of the present measurements, is the presence of a phase separation in the HTF.
In conclusion, combined DSC, shear viscosity and X ray diffraction studies on a molecular solution undergoing inverse melting, allowed us to observe the existence of two fluid phases in two different temperature ranges separated by a temperature interval where the material is in a crystalline phase. Most importantly, by changing the CD concentration control parameter, we identify the existence of a region in the phase diagram where two contiguous fluid phases are separated by a first order phase transition line. These experimental results can be framed within the recent theoretical prediction of inverse melting in a spin model for fragile glasses Sellitto (2006). They also call for further experimental and simulation works aiming to understand the interacting mechanism leading to such phenomenology.
R.A. thanks L. Leuzzi for discussions.
References
- Rastogi et al. (1991) S. Rastogi, M. Newman, and A. Keller, Nature 353, 55 (1991).
- Rastogi et al. (1999) S. Rastogi, G. W. H. Höhne, and A. Keller, Macromolecules 32, 8897 (1999).
- Greer (2000) A. L. Greer, Nature 404, 134 (2000).
- Portmann et al. (2003) O. Portmann, A. Vaterlaus, and D. Pescia, Nature 412, 701 (2003).
- Stillinger and Debenedetti (2003) F. H. Stillinger and P. G. Debenedetti, Biophys. Chem. 105, 211 (2003).
- Schupper and Shnerb (2005) N. Schupper and N. M. Shnerb, Phys. Rev. E 72, 046107 (2005).
- Sellitto (2006) M. Sellitto, PRB 73, 180202(R) (2006).
- Schupper and Shnerb (2004) N. Schupper and N. M. Shnerb, Phys. Rev. Lett. 93, 037202 (2004).
- Crisanti and Leuzzi (2005) A. Crisanti and L. Leuzzi, Phys. Rev. Lett. 95, 087201 (2005).
- Feeney et al. (2003) M. R. Feeney, P. G. Debenedetti, and F. H. Stillinger, J. Chem. Phys. 119, 4582 (2003).
- Plazanet et al. (2004) M. Plazanet, C. Floare, M. R. Johnson, R. Schweins, and H. Trommsdroff, J. Chem. Phys. 121, 5031 (2004).
- R.Angelini and G.Ruocco (2007) R.Angelini and G.Ruocco, Phil. Mag. 87, 553 (2007).
- Tombari et al. (2005) E. Tombari, C. Ferrari, G. Salvietti, and G. P. Johari, J. Chem. Phys. 123, 051104 (2005).
- Plazanet et al. (2006) M. Plazanet, M. Dean, M. Merlini, H. Huller, H. Hemerich, C. Meneghini, M. Johnson, and H. Trommsdroff, J. Chem. Phys. 125, 154504 (2006).
- Hammersley et al. (1996) A. P. Hammersley, S. O. Svensson, M. Hanfland, A. N. Fitch, and D. H usermann., High Pres. Res. 14, 235 (1996).