66email: jean-philippe.lenain@obspm.fr 77institutetext: IRFU/DSM/CEA, CE Saclay, Gif-sur-Yvette, France 88institutetext: University of Durham, Department of Physics, Durham, UK 99institutetext: Unit for Space Physics, North-West University, Potchefstroom, South Africa 1010institutetext: Laboratoire Leprince-Ringuet, Ecole Polytechnique, CNRS/IN2P3, Palaiseau, France 1111institutetext: Laboratoire d’Annecy-le-Vieux de Physique des Particules, CNRS/IN2P3, Annecy-le-Vieux, France 1212institutetext: Astroparticule et Cosmologie (APC), CNRS, Universite Paris 7 Denis Diderot, Paris, France ††thanks: UMR 7164 (CNRS, Université Paris VII, CEA, Observatoire de Paris) 1313institutetext: Dublin Institute for Advanced Studies, Dublin, Ireland 1414institutetext: Landessternwarte, Universität Heidelberg, Heidelberg, Germany 1515institutetext: Laboratoire de Physique Théorique et Astroparticules, CNRS/IN2P3, Université Montpellier II, Montpellier, France 1616institutetext: Universität Erlangen-Nürnberg, Physikalisches Institut, Erlangen, Germany 1717institutetext: Laboratoire d’Astrophysique de Grenoble, INSU/CNRS, Université Joseph Fourier, Grenoble, France 1818institutetext: Institut für Astronomie und Astrophysik, Universität Tübingen, Tübingen, Germany 1919institutetext: LPNHE, Université Pierre et Marie Curie Paris 6, Université Denis Diderot Paris 7, CNRS/IN2P3, Paris, France 2020institutetext: Institute of Particle and Nuclear Physics, Charles University, Prague, Czech Republic
2020email: dalibor.nedbal@mpi-hd.mpg.de 2121institutetext: Institut für Theoretische Physik, Lehrstuhl IV: Weltraum und Astrophysik, Ruhr-Universität Bochum, Bochum, Germany 2222institutetext: University of Namibia, Windhoek, Namibia 2323institutetext: Obserwatorium Astronomiczne, Uniwersytet Jagielloński, Kraków, Poland 2424institutetext: Nicolaus Copernicus Astronomical Center, Warsaw, Poland 2525institutetext: School of Physics & Astronomy, University of Leeds, Leeds, UK 2626institutetext: School of Chemistry & Physics, University of Adelaide, Adelaide, Australia 2727institutetext: Toruń Centre for Astronomy, Nicolaus Copernicus University, Toruń, Poland 2828institutetext: European Associated Laboratory for Gamma-Ray Astronomy, jointly supported by CNRS and MPG
Discovery of VHE -rays from the high-frequency-peaked
BL Lac object RGB J0152017
Abstract
Aims. The BL Lac object RGB J0152017 () was predicted to be a very high-energy (VHE; GeV) -ray source, due to its high X-ray and radio fluxes. Our aim is to understand the radiative processes by investigating the observed emission and its production mechanism using the High Energy Stereoscopic System (H.E.S.S.) experiment.
Methods. We report recent observations of the BL Lac source RGB J0152017 made in late October and November 2007 with the H.E.S.S. array consisting of four imaging atmospheric Cherenkov telescopes. Contemporaneous observations were made in X-rays by the Swift and RXTE satellites, in the optical band with the ATOM telescope, and in the radio band with the Nançay Radio Telescope.
Results. A signal of 173 -ray photons corresponding to a statistical significance of 6.6 was found in the data. The energy spectrum of the source can be described by a powerlaw with a spectral index of . The integral flux above 300 GeV corresponds to 2% of the flux of the Crab nebula. The source spectral energy distribution (SED) can be described using a two-component non-thermal synchrotron self-Compton (SSC) leptonic model, except in the optical band, which is dominated by a thermal host galaxy component. The parameters that are found are very close to those found in similar SSC studies in TeV blazars.
Conclusions. RGB J0152017 is discovered as a source of VHE -rays by H.E.S.S. The location of its synchrotron peak, as derived from the SED in Swift data, allows clear classification as a high-frequency-peaked BL Lac (HBL).
Key Words.:
galaxies: BL Lacertae objects: individual: RGB J0152+017 – gamma rays: observations – galaxies: BL Lacertae objects: general – galaxies: active1 Introduction
First detected as a radio source (Becker et al. 1991) by the NRAO Green Bank Telescope and in the Parkes-MIT-NRAO surveys (Griffith et al. 1995), RGB J0152017 was later identified as a BL Lac object by Laurent-Muehleisen et al. (1998), who located it at , and was claimed as an intermediate-frequency-peaked BL Lac object by Laurent-Muehleisen et al. (1999). Brinkmann et al. (1997) report the first detection of RGB J0152017 in X-rays in the ROSAT-Green Bank (RGB) sample. The host is an elliptical galaxy with luminosity (Nilsson et al. 2003). The source has high radio and X-ray fluxes, making it a good candidate for VHE emission (Costamante & Ghisellini 2002), motivating its observation by the H.E.S.S. experiment.
The broad-band SED of BL Lac objects is typically characterised by a double-peaked structure, usually attributed to synchrotron radiation in the radio-to-X-ray domain and inverse Compton scattering in the -ray domain, which is frequently explained by SSC models (see, e.g., Aharonian et al. 2005). However, since the flux of BL Lac objects can be highly variable (e.g. Krawczynski et al. 2000), stationary versions of these models are only relevant for contemporaneous multi-wavelength observations of a non-flaring state. The contemporaneous radio, optical, X-ray, and VHE observations presented here do not show any significant variability, and thus enable the first SSC modelling of the emission of RGB J0152017.
2 H.E.S.S. observations and results
RGB J0152017 was observed by the H.E.S.S. array consisting of four imaging atmospheric Cherenkov telescopes, located in the Khomas Highland, Namibia (Aharonian et al. 2006a). The observations were performed from October 30 to November 14, 2007. The data were taken in wobble mode, where the telescopes point in a direction typically at an offset of 0.5° from the nominal target position (Aharonian et al. 2006a). After applying selection cuts to the data to reject periods affected by poor weather conditions and hardware problems, the total live-time used for analysis amounts to 14.7 h. The mean zenith angle of the observations is °.
The data are calibrated according to Aharonian et al. (2004). Energies are reconstructed taking the effective optical efficiency evolution into account (Aharonian et al. 2006a). The separation of -ray-like events from cosmic-ray background events was made using the Hillas moment-analysis technique (Hillas 1985). Signal extraction was performed using standard cuts (Aharonian et al. 2006a). The on-source events were taken from a circular region around the target with a radius of °. The background was estimated using reflected regions (Aharonian et al. 2006a) located at the same offset from the centre of the observed field as the on-source region.
A signal of 173 -ray events is found from the direction of RGB J0152017. The statistical significance of the detection is 6.6 according to Li & Ma (1983). The preliminary detection was reported by Nedbal et al. (2007). A two-dimensional Gaussian fit of the excess yields a position , . The measured position is compatible with the nominal position of RGB J0152017 (, ) at the 1 level. Given this spatial coincidence, we identify the source of -rays with RGB J0152017. The angular distribution of events coming from RGB J0152017, shown in Fig. 1, is compatible with the expectation from the Monte Carlo simulations of a point source.
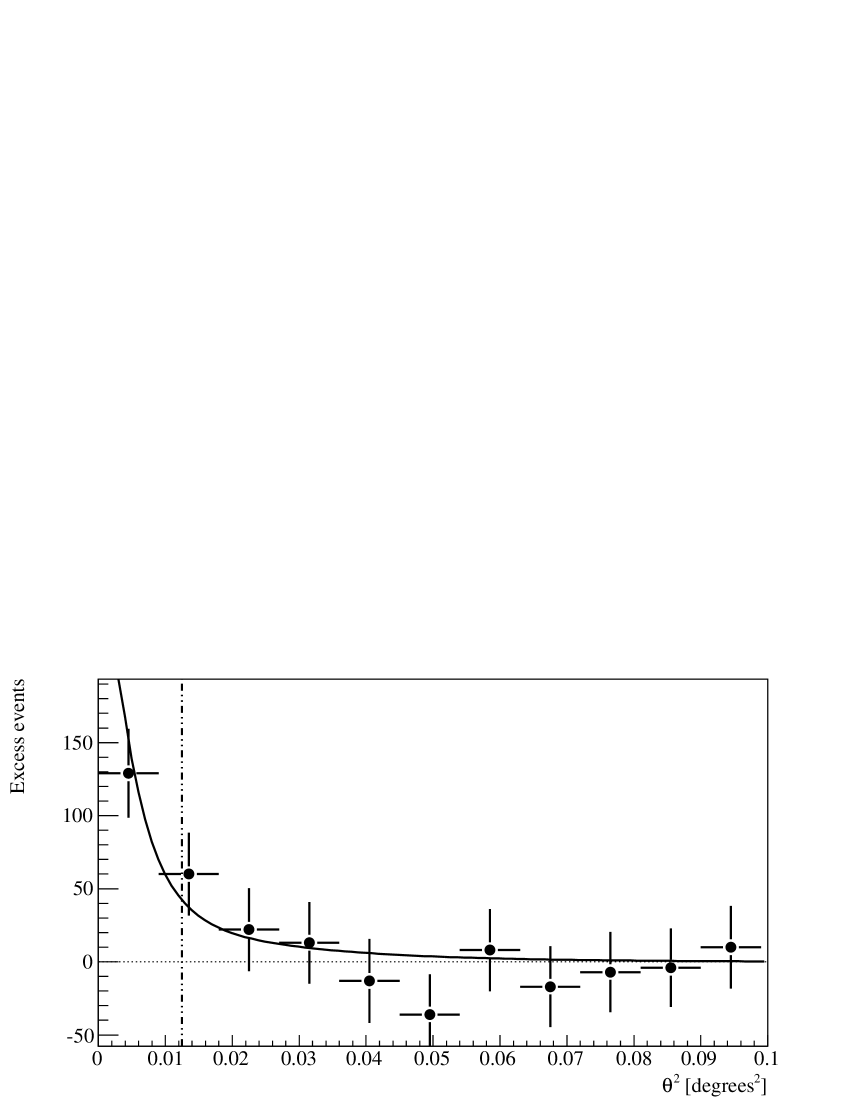
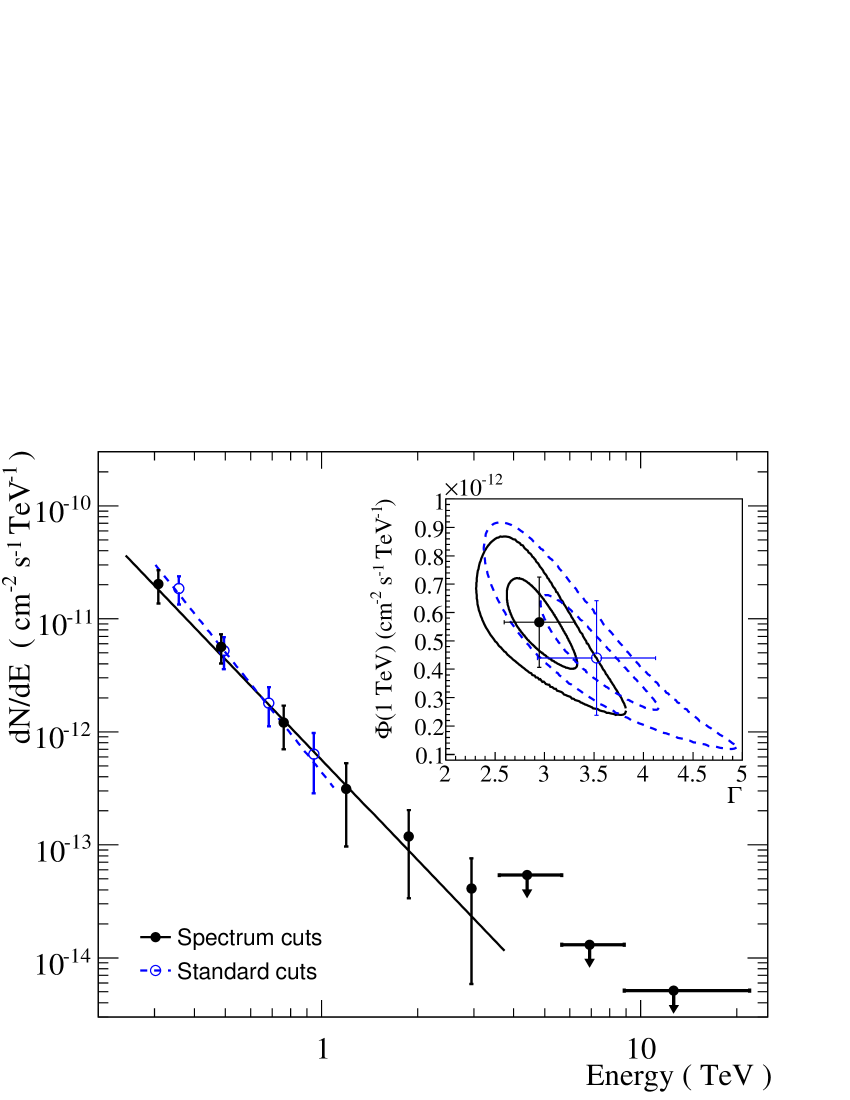
Figure 2 shows the time-averaged differential spectrum. The spectrum was derived using standard cuts with an energy threshold of 300 GeV. Another set of cuts, the spectrum cuts described in Aharonian et al. (2006b), were used to lower the energy threshold and improve the photon statistics (factor 2 increase above the standard cuts). Both give consistent results (see inlay in Fig. 2 and caption). Because of the better statistics and energy range, we use the spectrum derived using spectrum cuts in the following. Between the threshold of 240 GeV and 3.8 TeV, this differential spectrum is described well (/d.o.f.=2.16/4) by a power law with a photon index and normalisation at 1 TeV of cm-2 s-1 TeV-1. The 99% confidence level upper limits for the highest three bins shown in Fig. 2 were calculated using Feldman & Cousins (1998).
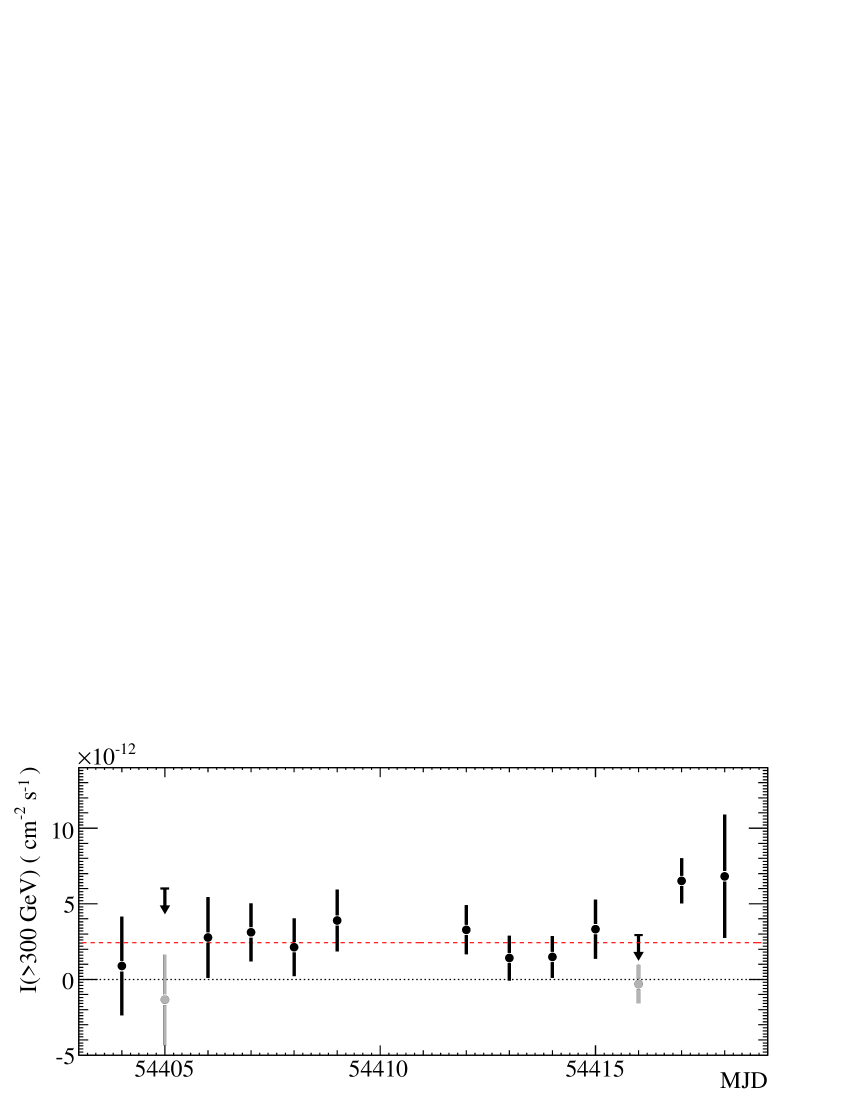
The integral flux above 300 GeV is cm-2 s-1, which corresponds to 2% of the flux of the Crab nebula above the same threshold as determined by Aharonian et al. (2006a). Figure 3 shows the nightly evolution of the -ray flux above 300 GeV. There is no significant variability between nights in the lightcurve. The of the fit to a constant is , corresponding to a probability of 14%.
All results were checked with independent analysis procedures and calibration chain giving consistent results.
3 Multi-wavelength observations with Swift, RXTE, ATOM, and the Nançay Radio Telescope
3.1 X-ray data from Swift and RXTE
Target of opportunity (ToO) observations of RGB J0152017 were performed with Swift and RXTE on November 13, 14, and 15, 2007 triggered by the H.E.S.S. discovery.
The Swift/XRT (Burrows et al. 2005) data (5.44 ks) were taken in photon-counting mode. The spectra were extracted with xselect v2.4 from a circular region with a radius of 20 pixels () around the position of RGB J0152017, which contains of the PSF at 1.5 keV. An appropriate background was extracted from a region next to the source with four times this area. The auxiliary response files were created with the script xrtmkarf v0.5.6 and the response matrices were taken from the Swift package of the calibration database caldb v3.4.1. Due to the low count rate of , any pileup effect on the spectrum is negligible. We find no significant variability during any of the pointings or between the three subsequent days; hence, individual spectra were combined to achieve better photon statistics. The spectral analysis was performed using the tool Xspec v11.3.2. A broken powerlaw () with a Galactic absorption of (LAB Survey, Kalberla et al. 2005) is a good description (), and the resulting unabsorbed flux is and .
Simultaneous observations at higher X-ray photon energies were obtained with the RXTE/PCA (Jahoda et al. 1996). Only data of PCU2 and the top layer were taken to obtain the best signal-to-noise ratio. After filtering out the influence of the South Atlantic Anomaly, tracking offsets, and the electron contamination, an exposure of 3.2 ks remains. Given the low count rate of , the “faint background model” provided by the RXTE Guest Observer Facility was used to generate the background spectrum with the script pcabackest v3.1. The response matrices were created with pcarsp v10.1. Again no significant variations were found between the three observations, and individual spectra were combined to achieve better photon statistics. The PCA spectrum can be described by an absorbed single powerlaw with photon index () between 2 and 10 keV, using the same Galactic absorption as for Swift data. The resulting flux exceeds the one obtained simultaneously with Swift by a factor of 2.5. We attribute this mostly to contamination by the nearby galaxy cluster Abell 267 ( offset from RGB J0152017 but still in the field of view of the non-imaging PCA).
A detailed decomposition is beyond the scope of this paper, so we exclude RXTE data from broadband modelling. The RXTE data-set confirms the absence of variability during November 2007, also in the energy range up to 10 keV. For the SED modelling, the average spectrum is treated as an upper limit. Further observations with RXTE in December 2007 also show no indication of variability.
3.2 Optical data
Optical observations were taken using the ATOM telescope (Hauser et al. 2004) at the H.E.S.S site from November 10, 2007. No significant variability was detected during the nights between November 10 and November 20; R-band fluxes binned nightly show an RMS of 0.02 mag.
Absolute flux values were found using differential photometry against stars calibrated by K. Nilsson (priv. comm.). We measured a total flux of mag (host galaxy + core) in an aperture of radius. The host galaxy was subtracted with galaxy parameters given in Nilsson et al. (2003), and aperture correction given in Eq. (4) of Young (1976). The core flux in the R-band (640 nm) was found to be 0.62 0.08 mJy. This value was not corrected for Galactic extinction.
3.3 Radio data
The Nançay Radio Telescope (NRT) is a meridian transit telescope with a main spherical mirror of 300 m 35 m (Theureau et al. 2007). The low-frequency receiver, covering the band 1.8–3.5 GHz was used, with the NRT standard filterbank backend.
The NRT observations were obtained in two contiguous bands of 12.5 MHz bandwidth, centred at 2679 and 2691 MHz (average frequency: 2685 MHz). Two linear polarisation receivers were used during the 22 60-second drift scan observations on the source on November 12 and 14, 2007. The data have been processed with the standard NRT software packages NAPS and SIR. All bands and polarisations have been averaged, giving an RMS noise of 2.2 mJy. The source 3C 295 was observed for calibration, on November 11, 13, and 15, 2007.
Taking into account a flux density for this source of Jy using the spectral fit published by Ott et al. (1994), we derived a flux density of mJy at 2685 MHz for RGB J0152017. No significant variability was found in the radio data.
4 Discussion
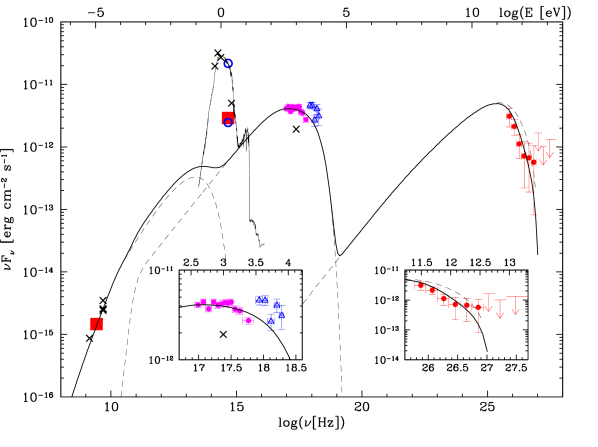
Figure 4 shows the SED of RGB J0152017 with the data from Nançay, ATOM, Swift/XRT, RXTE/PCA, and H.E.S.S. Even though some data are not strictly simultaneous, no significant variability is found in the X-ray and optical bands throughout the periods covered; hence, a common modelling of the contemporaneous X-ray and VHE data appears justified.
The optical part of the SED is mainly due to the host galaxy, which is detected and resolved in optical wavelengths (Nilsson et al. 2003). A template of the spectrum of such an elliptic galaxy is shown in the SED, as inferred from the code PEGASE (Fioc & Rocca-Volmerange 1997). The host-galaxy-subtracted data point from the ATOM telescope might include several additional contributions—from an accretion disk, an extended jet (see below), or a central stellar population—so that it is considered as an upper limit in the following SSC model. A model including the optical ATOM data with possible additional contributions is beyond the scope of this paper.
We applied a non-thermal leptonic SSC model (Katarzyński et al. 2001) to account for the contemporaneous observations by Swift in X-rays and by H.E.S.S. in the VHE band. The radio data are assumed to originate in an extended region, described by a separate synchrotron model for the extended jet (Katarzyński et al. 2001) to explain the low-frequency part of the SED (as in, e.g., Aharonian et al. 2005, 2008).
We should emphasise that the aim of applying this model in this work is not to present a definitive interpretation for this source, but rather to show that a standard SSC model is able to account for the VHE and Swift X-ray observations.
For the SSC model, we describe the system as a small homogeneous spherical, emitting region (blob) of radius within the jet, filled with a tangled magnetic field and propagating with a Doppler factor . Here is the bulk Lorentz factor of the emitting plasma blob, , and is the angle of the velocity vector, with respect to the line-of-sight. The electron energy distribution (EED) is described by a broken powerlaw, with indices and , between Lorentz factors and , with a break at and density normalisation .
The model also accounts for the absorption by the extragalactic background light (EBL) with the parameters given in Primack et al. (2005). RGB J0152017 is too nearby () to add to the constraints on the EBL that were found by H.E.S.S. measurements of other blazars (Aharonian et al. 2006c). In all the models, we assume km s-1 Mpc-1, giving a luminosity distance of cm for RGB J0152017.
The EED can be described by cm-3, , and . The break energy is assumed at and is consistent with the Swift/XRT spectrum, while providing good agreement with the H.E.S.S. data. We assume the canonical index for the low-energy part of the EED, in accordance with standard Fermi-type acceleration mechanisms. The value for the high-energy part of the EED is constrained by the high-energy part of the X-ray spectrum. A good solution is found with the emitting region characterised by , cm, and G.
For the extended jet, the data are described well by cm, , cm-3, G, and at the base of the jet, and pc (all the parameters are detailed in Katarzyński et al. 2001).
Assuming additional contributions in the optical band, the multi-wavelength SED can thus be explained with a standard shock-acceleration process. The parameters derived from the model are similar to previous results for this type of source (see, e.g., Ghisellini et al. 2002).
From the current Nançay radio data and the Swift X-ray data, we obtain a broad-band spectral index between the radio and the X-ray domains. The obtained SED, the corresponding location of the synchrotron peak, and the flux and shape of the Swift spectrum lead us to conclude that RGB J0152017 can clearly be classified as an HBL object at the time of H.E.S.S. observations.
5 Conclusion
The HBL RGB J0152017 was detected in VHE at energies GeV with the H.E.S.S. experiment. The contemporaneous Swift, RXTE, Nançay, ATOM, and H.E.S.S. data allow the multi-wavelength SED for RGB J0152017 to be derived for the first time , and to clearly confirm its HBL nature at the time of the H.E.S.S. observations. In general, large variations of the VHE flux are expected in TeV blazars, making further monitoring of this source to detect high states of the VHE flux (flares) desirable.
Acknowledgements.
The support of the Namibian authorities and of the University of Namibia in facilitating the construction and operation of H.E.S.S. is gratefully acknowledged, as is the support by the German Ministry for Education and Research (BMBF), the Max Planck Society, the French Ministry for Research, the CNRS-IN2P3 and the Astroparticle Interdisciplinary Programme of the CNRS, the U.K. Science and Technology Facilities Council (STFC), the IPNP of the Charles University, the Polish Ministry of Science and Higher Education, the South African Department of Science and Technology and National Research Foundation, and by the University of Namibia. We appreciate the excellent work of the technical support staff in Berlin, Durham, Hamburg, Heidelberg, Palaiseau, Paris, Saclay, and in Namibia in the construction and operation of the equipment. This research made use of the NASA/IPAC Extragalactic Database (NED). The authors thank the RXTE team for their prompt response to our ToO request and the professional interactions that followed. The authors acknowledge the use of the publicly available Swift data, as well as the public HEASARC software packages. This work uses data obtained at the Nançay Radio Telescope. The authors also thank Dr. Mira Véron-Cetty for fruitful discussions.References
- Aharonian et al. (2004) Aharonian, F., Akhperjanian, A. G., Aye, K.-M., et al. (H.E.S.S. Collaboration) 2004, Astroparticle Physics, 22, 109
- Aharonian et al. (2005) Aharonian, F., Akhperjanian, A. G., Bazer-Bachi, A. R., et al. (H.E.S.S. Collaboration) 2005, A&A, 442, 895
- Aharonian et al. (2006a) Aharonian, F., Akhperjanian, A. G., Bazer-Bachi, A. R., et al. (H.E.S.S. Collaboration) 2006a, A&A, 457, 899
- Aharonian et al. (2006b) Aharonian, F., Akhperjanian, A. G., Bazer-Bachi, A. R., et al. (H.E.S.S. Collaboration) 2006b, A&A, 448, L19
- Aharonian et al. (2006c) Aharonian, F., Akhperjanian, A. G., Bazer-Bachi, A. R., et al. (H.E.S.S. Collaboration) 2006c, Nature, 440, 1018
- Aharonian et al. (2008) Aharonian, F., Akhperjanian, A. G., Barres de Almeida, U., et al. (H.E.S.S. Collaboration) 2008, A&A, 477, 481
- Becker et al. (1991) Becker, R. H., White, R. L., & Edwards, A. L. 1991, ApJS, 75, 1
- Brinkmann et al. (1997) Brinkmann, W., Siebert, J., Feigelson, E. D., et al. 1997, A&A, 323, 739
- Burrows et al. (2005) Burrows, D. N., Hill, J. E., Nousek, J. A., et al. 2005, Space Science Reviews, 120, 165
- Costamante & Ghisellini (2002) Costamante, L. & Ghisellini, G. 2002, A&A, 384, 56
- Feldman & Cousins (1998) Feldman, G. J. & Cousins, R. D. 1998, Phys. Rev. D, 57, 3873
- Fioc & Rocca-Volmerange (1997) Fioc, M. & Rocca-Volmerange, B. 1997, A&A, 326, 950
- Ghisellini et al. (2002) Ghisellini, G., Celotti, A., & Costamante, L. 2002, A&A, 386, 833
- Griffith et al. (1995) Griffith, M. R., Wright, A. E., Burke, B. F., & Ekers, R. D. 1995, ApJS, 97, 347
- Hauser et al. (2004) Hauser, M., Möllenhoff, C., Pühlhofer, G., Wagner, S. J., Hagen, H.-J., & Knoll, M. 2004, Astronomische Nachrichten, 325, 659
- Hillas (1985) Hillas, A. M. 1985, International Cosmic Ray Conference, 3, 445
- Jahoda et al. (1996) Jahoda, K., Swank, J. H., Giles, A. B., Stark, M. J., Strohmayer, T., Zhang, W., & Morgan, E. H. 1996, Proc. SPIE, 2808, 59
- Kalberla et al. (2005) Kalberla, P. M. W., Burton, W. B., Hartmann, D., et al. 2005, A&A, 440, 775
- Katarzyński et al. (2001) Katarzyński, K., Sol, H., & Kus, A. 2001, A&A, 367, 809
- Krawczynski et al. (2000) Krawczynski, H., Coppi, P. S., Maccarone, T., & Aharonian, F. A. 2000, A&A, 353, 97
- Laurent-Muehleisen et al. (1998) Laurent-Muehleisen, S. A., Kollgaard, R. I., Ciardullo, R., et al. 1998, ApJS, 118, 127
- Laurent-Muehleisen et al. (1999) Laurent-Muehleisen, S. A., Kollgaard, R. I., Feigelson, E. D., Brinkmann, W., & Siebert, J. 1999, ApJ, 525, 127
- Li & Ma (1983) Li, T.-P., & Ma, Y.-Q. 1983, ApJ, 272, 317
- Nedbal et al. (2007) Nedbal, D., Benbow, W., Costamante, L., et al. 2007, The Astronomer’s Telegram, 1295, 1
- Nilsson et al. (2003) Nilsson, K., Pursimo, T., Heidt, J., et al. 2003, A&A, 400, 95
- Ott et al. (1994) Ott, M., Witzel, A., Quirrenbach, A., et al. 1994, A&A, 284, 331
- Primack et al. (2005) Primack, J. R., Bullock, J. S., & Somerville, R. S. 2005, High Energy Gamma-Ray Astronomy, 745, 23
- Theureau et al. (2007) Theureau, G., Hanski, M. O., Coudreau, N., Hallet, N., & Martin, J.-M. 2007, A&A, 465, 71
- Young (1976) Young, P. J. 1976, AJ, 81, 807