Modeling of diffuse molecular gas applied to HD 102065 observations
Abstract
Aims. We model a diffuse molecular cloud present along the line of sight to the star HD 102065. We compare our modeling with observations to test our understanding of physical conditions and chemistry in diffuse molecular clouds.
Methods. We analyze an extensive set of spectroscopic observations which characterize the diffuse molecular cloud observed toward HD 102065. Absorption observations provide the extinction curve, , C i , , , and column densities and excitation. These data are complemented by observations of , and dust emission. Physical conditions are determined using the Meudon PDR model of UV illuminated gas.
Results. We find that all observational results, except column densities of , and in its excited () levels, are consistent with a cloud model implying a Galactic radiation field ( in Draine’s unit), a density of and a temperature (60-80 K) set by the equilibrium between heating and cooling processes. To account for excited () levels column densities, an additional component of warm () and dense () gas within 0.03 pc of the star would be required. This solution reproduces the observations only if the ortho-to-para H2 ratio at formation is . In view of the extreme physical conditions and the unsupported requirement on the ortho-to-para ratio, we conclude that H2 excitation is most likely to be accounted for by the presence of warm molecular gas within the diffuse cloud heated by the local dissipation of turbulent kinetic energy. This warm H2 is required to account for the column density. It could also contribute to the CH abundance and explain the inhomogeneity of the CO abundance indicated by the comparison of absorption and emission spectra.
Key Words.:
Astrochemistry,ISM:clouds,ISM:molecules,ISM:structure,ISM:individual objects:Chamaeleon clouds, Stars:individual:HD1020651 Introduction
Since the pioneering work of Black & Dalgarno (1977), observations of diffuse molecular clouds continue to motivate and challenge efforts to model the thermal balance and chemistry of interstellar gas illuminated by UV photons. Models allow observers to determine physical conditions from their data and observations contribute to models by quantifying physical processes of general relevance to studies of matter in space such as H2 formation, photo-electric heating, and cosmic ray ionization.
Many models of well characterized lines of sight have been presented (e.g. in the last years: Zsargó & Federman, 2003; Le Petit et al., 2004; Shaw et al., 2006). They are successful in reproducing many observables apart from some molecular abundances, most conspicuously CH+, which points to out-of-equilibrium chemistry. This molecular ion, and several of the molecular species commonly observed in diffuse molecular clouds such as CH, OH and HCO+ may be produced by MHD shocks (Draine & Katz, 1986; Pineau des Forêts et al., 1986; Flower & Pineau des Forêts, 1998), and small scale vortices (Joulain et al., 1998; Falgarone et al., 2006) where H2 is heated by the localized dissipation of the gas turbulent kinetic energy. Turbulent transport between the cold and warm neutral medium may also significantly impact the chemistry of diffuse clouds (Lesaffre et al., 2007).
Independently of gas chemistry, the presence of H2 at higher temperatures than that set by UV and cosmic-rays heating of diffuse molecular clouds, may be probed through observations of the H2 level populations (Cecchi-Pestellini et al., 2006). A correlation between CH+ and rotationally excited H2 was found by Lambert & Danks (1986) using Copernicus observations. Falgarone et al. (2005) reported the detection of the S(0) to S(3) H2 lines in a line of sight towards the inner Galaxy away from star forming regions. They interpret their observation as evidence for traces of warm molecular gas in the diffuse interstellar medium. But the interpretation of the wealth of H2 observations provided by the FUSE satellite is still a matter of debate. Gry et al. (2002) modeled FUSE H2 observations of three stars in Chamaeleon using the Meudon Photon Dominated Regions (PDR) model (Le Bourlot et al., 1993). They show that the model cannot account for H2 column densities in rotational states with . A larger sample of H2 FUSE observations (Tumlinson et al., 2002; Gillmon et al., 2005; Wakker, 2006), including 2 of the 3 Chamaeleon lines of sight of Gry et al. (2002), have been analyzed on the basis of model calculations presented by Browning et al. (2003). Their model, like other PDR models, takes into account the formation of H2 on grains, its photo-dissociation by absorption of resonant UV photons, radiative transfer and vibrational/rotational excitation resulting from collisions, H2 formation and UV pumping. Unlike the latest PDR models (Shaw et al., 2005; Le Petit et al., 2006), the Browning et al. (2003) model does not derive the gas temperature from the thermal balance between heating and cooling processes. Browning et al. (2003) instead consider gas temperature as a model parameter independent of the density, incident radiation field and cloud shielding (total extinction). They conclude that H2 observations cannot be accounted for with a single isothermal slab of gas. They propose solutions where the data are fitted with absorption from two physically independent gas layers with distinct temperatures, UV illuminations and column densities. A cold (K) component contributes most of the total H2 column density while a warmer (K) and thinner component with a higher UV field helps populate the high J states. For many of the model combinations considered by Browning et al. (2003), the difference in UV field is too low to account for the corresponding difference in temperature. In particular, the combinations proposed for the nearby diffuse interstellar medium require an additional heating source in the warm component. For H2 observations towards Galactic stars, some of the absorption may arise from gas in the vicinity of the star (e.g. Boissé et al., 2005).
In a companion paper (Nehmé et al., 2008), we presented a multi-wavelength study combining spectroscopic UV, optical, IR and radio observations of the interstellar matter, along the line of sight to the nearby (170 pc) moderately reddened (E(B-V) = 0.17) star HD 102065. Absorption observations provide the column densities of in the J=0 to 5 states, C i in its three fine structure states, in the J=0 to 2 states, and . They are complemented by observations of the , and lines and dust continuum in emission. Non-detections of the C2 and CN optical absorption lines were transformed into upper limits on column densities using oscillator strengths listed by Gredel et al. (1991, 1993).
The HD 102065 line of sight is well suited for detailed modeling of physical conditions, chemistry and H2 excitation, because of the large amount of available data (Table 1). The molecular fraction is not altered by the presence of warm atomic gas along the line of sight. Comparison of H I, H2 and dust extinction indicates that the bulk ( 90%) of the column density is accounted for by a diffuse molecular cloud identified on IRAS images. IRAS observations place a strong constraint on the presence of matter close to the star. The abundance of CH+ is high. This paper extends the work of Gry et al. (2002), where only the FUSE H2 spectrum of HD 102065 was analyzed, to a wider set of observations, using an updated version of the Meudon PDR model (Le Petit et al., 2006). Kopp et al. (2000) used this sight line to discuss the impact of far-UV extinction on the CO abundance.
The structure of the paper is as follow: Sect. 2 presents the PDR model used to characterize the diffuse molecular cloud and Sect. 3 describes the main modeling results. First, a reference model is defined by fitting observational constraints together. Second, the model is compared with each of the observations to assess the dependence of model predictions on the values of the physical parameters. In Sect. 4, we present a detailed attempt to model H2 excitation with a warmer component located close to the star. Sect. 5 presents our conclusions.
2 Description of the PDR model
We use a comprehensive model of an interstellar cloud, that describes the state of the gas and dust exposed to a radiation field as a function of optical depth . The model is one-dimensional and stationary. It presents several improvements over that previously used by Gry et al. (2002) and is described in detail in Le Petit et al. (2006). It computes simultaneously, in an iterative way :
-
•
the UV radiative transfer, taking into account the continuum absorption by dust and the line absorption by the lowest levels of . The UV radiation field can illuminate the cloud from both sides.
-
•
the thermal balance, taking into account all relevant heating and cooling processes.
-
•
the chemistry, typically coupling about 100 different species through 800 chemical reactions.
2.1 Model parameters and variables
Model parameters (see Table 2) are kept fixed at values consistent with typical diffuse clouds and the measured characteristics of the HD 102065 line of sight. The model ignores the gas velocity structure and assumes that the three low velocity components discussed by Nehmé et al. (2008) make a single homogeneous cloud with a visual extinction equal to the observed value to HD 102065. We look for a best fit model by varying only the UV radiation field strength G (isotropic and incident on both sides of the cloud) measured in units of Draine’s radiation field, and the gas density . Density is constant throughout the cloud. Temperature is computed by solving for thermal balance. The standard Draine’s field (, Draine, 1978) is equivalent to about 1.6 in units of Habing’s field (Habing, 1968).
| ) | |||
|---|---|---|---|
| C iC i) | |||
| C iC i) | |||
| Parameter | Value | Comment |
|---|---|---|
| mag | Extinction | |
| Cosmic Rays ionization | ||
| Turbulent velocity | ||
| Total to selective extinction | ||
| Dust albedo | ||
| Dust anisotropy factor | ||
| Dust to gas mass ratio | ||
| Dust density | ||
| Dust size distribution index | ||
| Dust minimum radius | ||
| Dust maximum radius | ||
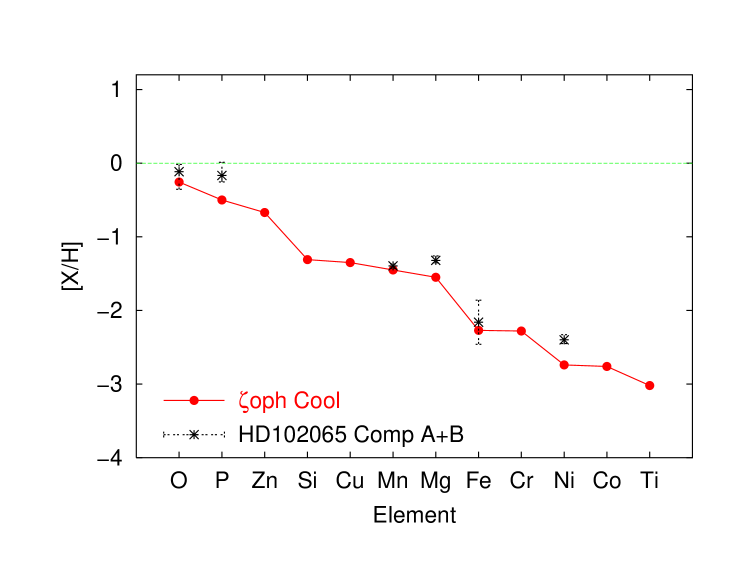
Element abundances are those measured for Oph taken from Savage & Sembach (1996). Fig. 1 shows that HD 102065 measured abundances are close to these reference values (Paper I). The grain distribution is kept fixed. It is a MRN type one with a power law size distribution with minimum and maximum sizes and cm. Although that distribution does not reproduce the details of the smallest grains size distribution required to account for the mid-infrared dust emission (Desert et al., 1990; Boulanger et al., 1994), it matches the Very Small Grains (VSG 111By VSG we mean any solid particle with a typical size smaller than , irrelevant of its precise nature.) to total dust mass ratio of .
2.2 H2 formation equations
In the present model, the formation rate on grains is not a free parameter, but is computed locally from the combined adsorption of atoms from the gas on grains followed by recombination and desorption of molecules:
where is an hydrogen atom adsorbed on dust. If only those two processes are included and steady state applies, the production of is independent of how H atoms eventually manage to reach one another and may be computed by:
| (1) |
where is the sticking coefficient of upon collision, its mean velocity and the mean grain cross section per unit volume.
In the full model, other processes may compete with formation to remove adsorbed hydrogen atoms (photo desorption, reactions on grains, etc…). In this paper, we neglect all of those processes, which allows the formation rate to be computed exactly. Results from Le Bourlot et al. (1995) show that the mean cross section can be written:
| (2) |
where Gr is the dust-to-gas mass ratio, the density of grain material, and integration is completed for the entire grain size distribution, using a MRN distribution (Mathis et al., 1977) with an index of from to . Combining Eq (1) and (2) we can write:
| (3) |
where , the formation rate in , reads:
| (4) |
The resulting value of is . We use a prescription from David Flower (see discussion in Le Petit et al., 2006) for the sticking coefficient :
| (5) |
The ortho-to-para ratio on formation of H2 is set to a value of three. One third (1.5 eV) of the formation energy is transferred into internal excitation, and is distributed over all H2 energy levels with a Boltzmann distribution (Le Petit et al., 2006). A second third of the formation energy is converted into kinetic energy of H2, and the last third, into grain heating.
3 Modeling the molecular cloud toward HD102065
3.1 General modeling results
To compare observations and model results, we have selected seven quantities for which an observational error bar could be computed: , , , , , , and , where is the column density of species over the whole cloud and and are ortho- and para- respectively. From these quantities, we define a error function by:
| (6) |
where is the quantity derived from observations, the same quantity from a model, and the observational uncertainty (see Table 1) 222Note that need not be dimensionless because normalisation by ensure that compatible quantities are summed. We computed a grid of models for gas densities ranging from 30 to 200 and UV fields from 0.25 to 1.0. Figure 2 shows the resulting iso-values. Contours are smooth, and limit a well defined minimum where , i.e. where model results are, in the mean, closer to observations than observational uncertainties.
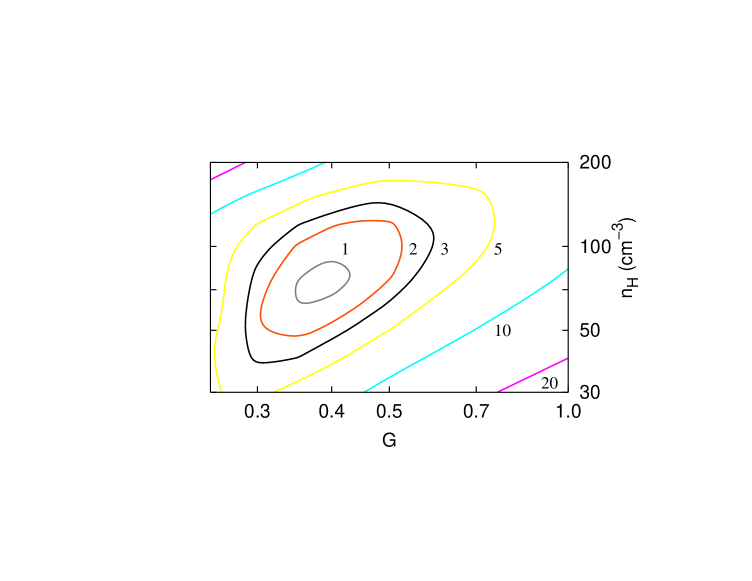
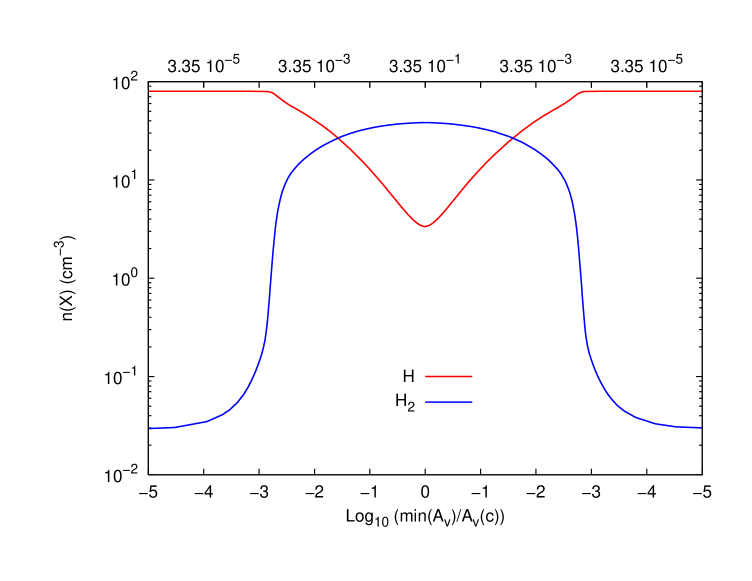
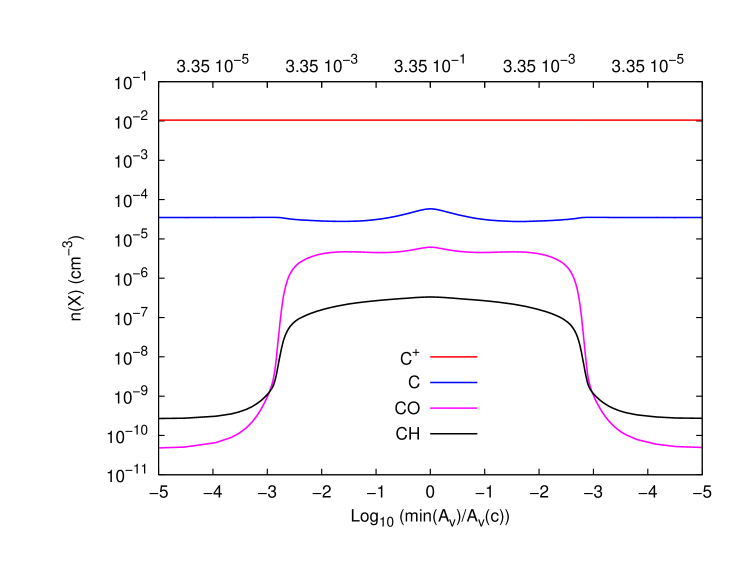
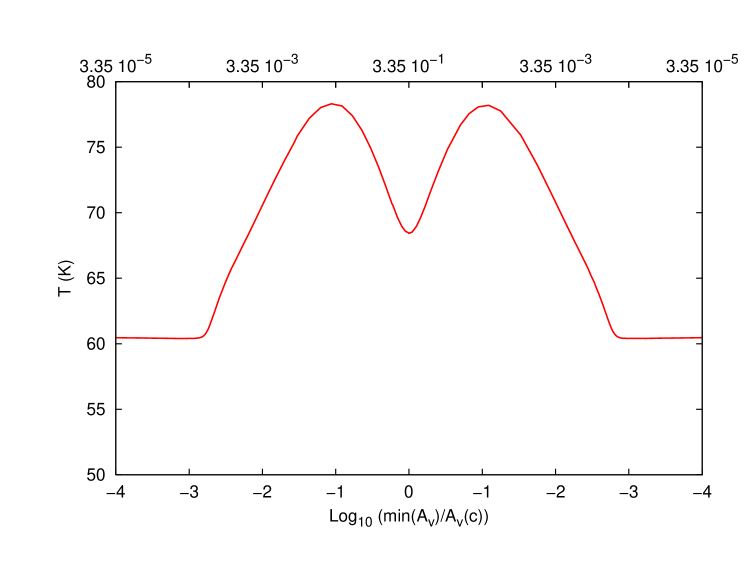
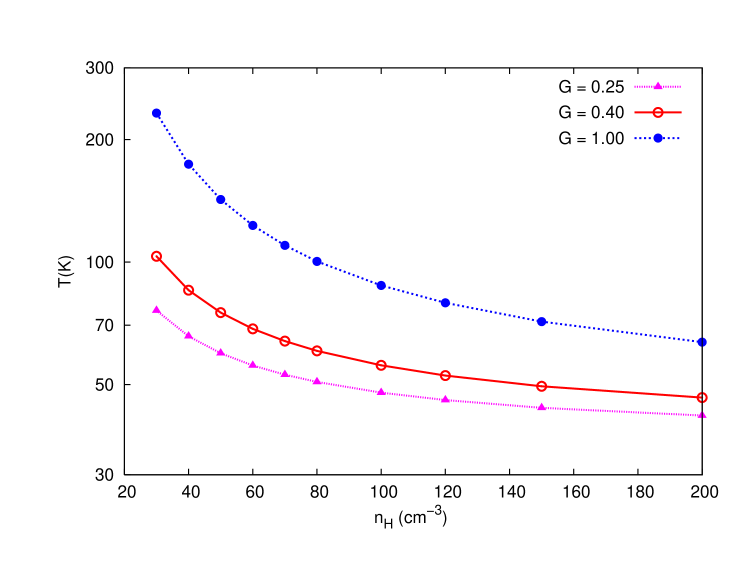
One can see that the best compromise is reached for a rather low radiation field (, which is close to the standard Habing field) and a mean total proton density of . In the following we will refer to those values as our reference model. The reference model results are compared to the observables in Table 1. Abundance and temperature profiles are illustrated on Fig. 3, 4 and 5333The peculiar horizontal scale allows for logarithmic scaling towards both sides of the cloud. The to transition occurs close to the cloud edge at an extinction of . Most of the carbon is in the form of at all depths. The fraction of atomic carbon C i is constant throughout the cloud. The density profiles of and molecules follow that of . Temperature varies from 60 to 80 K, and is lowest at the cloud edge. The temperature bumps visible on Fig. 5 are due to heating by formation.
The gas heating rate is at the cloud center and comes mainly from photo-electric effect on grains. In the outer layers where the temperature peaks, photo-electric heating reaches and there is a lower but significant heating due to formation (). Cooling is dominated by , with contributing up to 20% around . This leads to an integrated emissivity of in good agreement with the ISO observation.
In the next sections, we discuss each of the observables and their dependence on the two model parameters nH and .
3.2 formation rate and molecular fraction
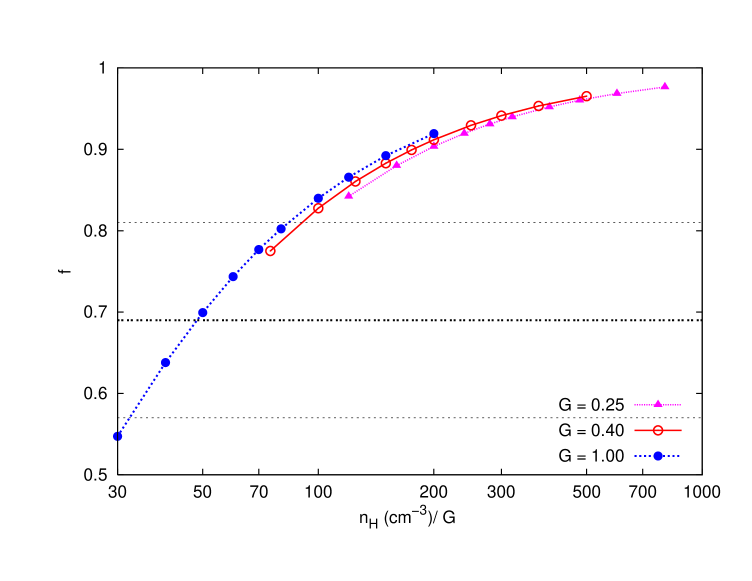
fraction (f) is plotted versus density for three values of on Fig. 6. For the reference model (, ) computed values for f are around 0.9, significantly higher than the observed f.
Gry et al. (2002) have shown that , for a given value of , depends on the product , where formation proceeds at a rate . We note that their incorporates both the temperature dependence and the sticking coefficient. Using our prescription for the sticking coefficient (section (2)), one finds that R is equal to and is independent of .
More generally, Fig. 6 shows that the molecular fraction for a given total gas column density depends on . Gry et al. (2002) found that the observed f is matched for , for a cloud illuminated on one side by the Habing field (equivalent to in Draine units). Our reference model gives , a factor 2.5 higher. This difference explains why, in our model, the molecular fraction is higher than the observed value. In the model, the formation of molecular hydrogen is the only destruction path of adsorbed atomic hydrogen in the present calculation. Other processes (such as photo desorption) may limit the amount of adsorbed on grains and lower further the formation efficiency. We consider the agreement between model and observed H2 fraction satisfactory because the time scale of H2 formation, a few yr, is long compared to dynamical time scales in diffuse clouds. The observed value is thus not expected to accurately match the model steady state value. Analysis of a large set of FUSE lines of sight will be required to estimate how observed molecular fractions scatter about model steady state values and constrain the formation rate more precisely.
3.3 excitation
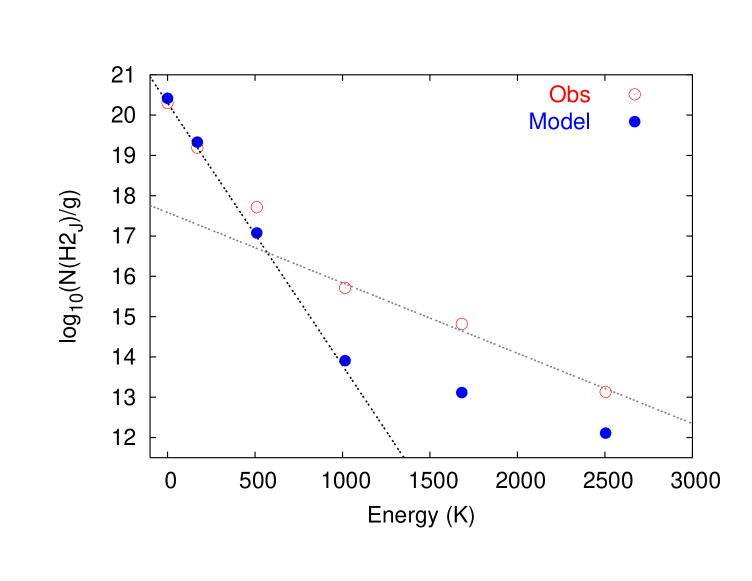
The ortho-to-para ratio, and the mean gas temperature are shown in Fig. 7 and 8, and the excitation diagram in Fig. 9. column densities in the and levels are reasonably well reproduced. The observed ortho to para ratio depends on the gas temperature. If it is at its equilibrium value (this is a reasonable hypothesis for diffuse clouds where the time scale for ortho-to-para conversion is shorter than that of H2 formation), the ratio can be considered a direct measure of the gas temperature. The excitation diagram in Fig. 9 implies an excitation temperature of (for J), which indeed is in good agreement with the mean gas temperature for the reference model (see Fig. 5).
On the other hand, column densities derived from the model for are far below the observed values. For levels , we derive an excitation temperature . This high gas suggests the existence of a warmer gas component that will be discussed in Sect. 4. We used the model to check that an increase in the cosmic-rays ionization rate, a possibility considered by Shaw et al. (2006), is not a solution. Multiplying this rate by a factor 20 to a value of s-1 increases the model column densities in the J=3 and 4 levels by less than a factor of 2.
3.4 Carbon abundance and excitation
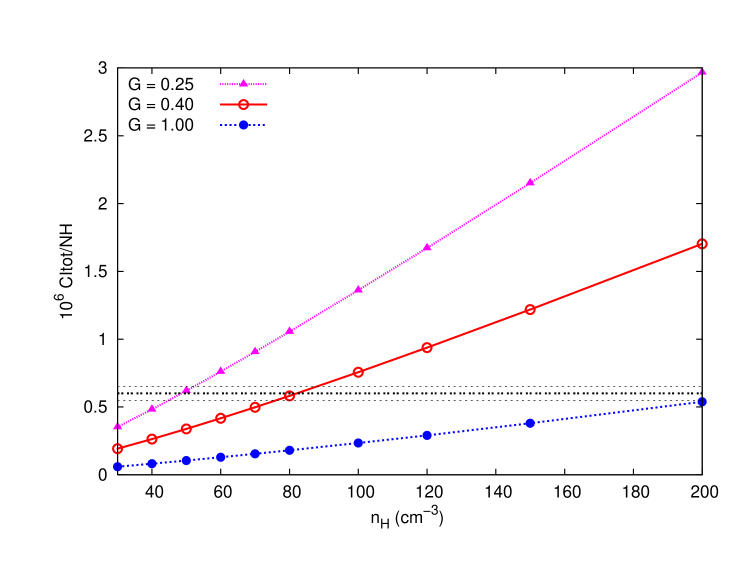
The neutral atomic carbon abundance and fine structure excitation, are presented in Fig. 10 and 11. Most of the carbon is in and the fraction of carbon in the neutral form C i depends on both the gas density and the value of . It increases with densities and decreases with increasing . Our reference model is in good agreement with the observed value.
The neutral atomic carbon excitation in diffuse clouds is often considered as a measure of gas pressure (Jenkins & Tripp, 2001). In our model, this translates into a dependence on the product with only small differences from one to another. Our reference model, reproduces well the fraction of fine structure level, but not so well that of , which implies n for . It is often the case that C i excitation in diffuse clouds cannot be accounted for by gas at a single pressure (Jenkins & Tripp, 2001). However our observations show a lower ratios than implied by the model, contrary to Jenkins & Tripp (2001) findings.
3.5 Molecules
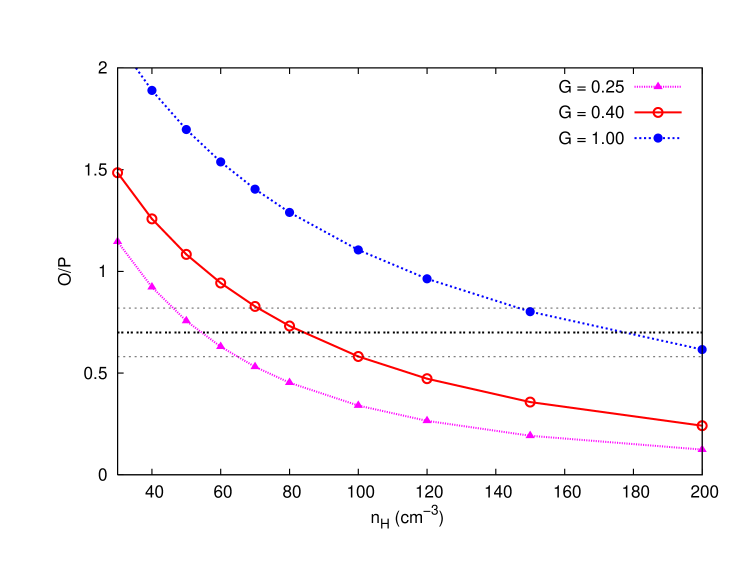
Our reference model matches the observed abundance of (Fig. 12). Table 1 shows that excitation is also well predicted by the model, although it was not used as a constraint. The rise in the ratio at low density and low radiation field is a chemical effect. The formation of is illustrated in Fig. 13. The efficiency of formation depends on the ionization fraction. Photoionisation is proportional to the gas density , while recombination proceeds at a rate that is proportional to the square of that quantity. The degree of ionization therefore increases when the density decreases in a given radiation field. Enhancing the ionization enhances formation via charge exchange with and favors the formation of and . Both molecules interact with and lead either directly or indirectly to the formation of . The reaction involving OH is dominant. Photodestruction of is limited by the weakness of the radiation field.
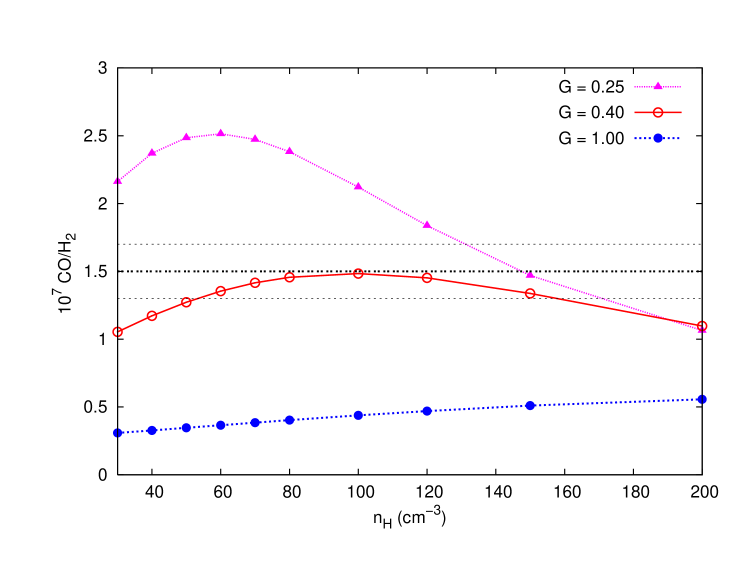

We are cautious about the model interpretation of the CO abundance. It is noticeable that the CO column densities in the J=1 and 2 levels, derived from UV spectra, are significantly smaller by factors 3 and 7, respectively, than the values derived from the emission radio spectra (Nehmé et al., 2008). These differences indicate that the abundance of is inhomogeneous, which could be accounted for within the PDR model, by introducing clumps with higher density than the mean value. However, the large CH+ abundance favors an alternative explanation, where a small-scale increase in the CO abundance, traces the localized contribution of out-of-equilibrium chemistry to its formation. Liszt and Lucas (2000) have gathered results from UV and radio absorption measurements of CO along diffuse interstellar medium lines of sight. They relate the CO abundance to that of HCO+ measurements, concluding that CO formation through dissociative recombination of HCO+ suffice to account for the CO abundance in diffuse molecular clouds. Falgarone et al. (2006) show that the observed abundance of HCO+ () cannot be accounted by standard PDR chemistry and must be related, like CH+, to warm out-of-equilibrium chemistry. A significant fraction of CO observed in diffuse molecular clouds may thus be a product of out-of-equilibrium chemistry.
This interpretation links CO abundance inhomogeneities to the CH+ chemistry but it is not specifically the CH+ rich gas that has an enhanced CO abundance. It is not ruled out by the observed velocity difference between CH+ and CO (Nehmé et al., 2008). CO, unlike CH+, is observed to be concentrated in the intermediate velocity component C. This component may correspond to shielded sections of the cloud where the CO photo-dissociation rate is reduced. In Nehmé et al. (2008), we propose that the line of sight to HD 102065 samples material ablated from the Dcld 300.2-16.9 cloud by a cloud-supernova shock interaction. In this scenario, the matter flowing out of the cloud is expected to be very turbulent (Nakamura et al., 2006).
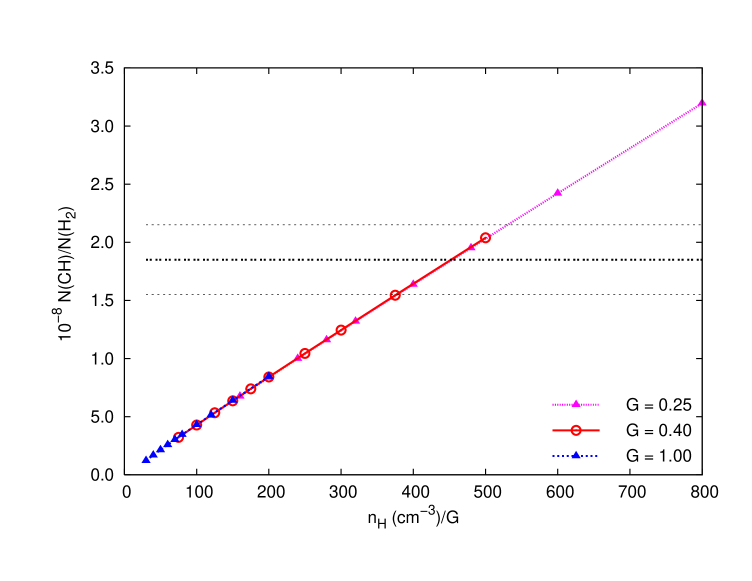
In Fig. 14, we show that the CH abundance () computed by the model depends linearly on the ratio . The value for our reference model is a factor of two lower than observations. This mismatch between model and observations, might be an additional manifestation of the out-of-equilibrium chemistry, as already proposed by e.g. Zsargó & Federman (2003) and Ritchey et al. (2006). The “excess” of abundance may be the product of recombination with H2. Finally, we note that the model is consistent with the upper limits on CN and C2 abundances (Table 1).
4 Warm H2
The excitation diagram (Fig. 9) shows that the observed column densities at 2 lie far above the single temperature fit to the low column densities. This is commonly observed, towards many stars by Copernicus and FUSE. The model values, which take into account UV pumping and excitation upon formation are also roughly an order of magnitude lower than the observations. Gry et al. (2002) and others earlier (e.g. Draine & Katz, 1986; Joulain et al., 1998; Pineau des Forêts et al., 1986) have proposed that this excited traces warm gas in regions where kinetic energy is dissipated through shocks or vortices. Other authors have proposed that this warm is the signature of molecular gas close to the star and thus exposed to a high UV field (e.g. Browning et al., 2003). The presence of CH+ in quantities much larger than predicted by the PDR model favors the former explanation (Falgarone et al., 2005). To test this preference, we have used the PDR model to quantify the latter possibility in the specific case of HD 102065.
The ratio between the brightness in the IRAS images and the visible extinction towards HD 102065 indicates that most of the matter is fairly distant from the star (Boulanger et al., 1994) and does not interact with it. The 60 and 100 m images only show a small brightness enhancement at the position of HD 102065, point-like at the IRAS resolution (angular size 5’), and corresponding to a small fraction ( 10-3) of the stellar luminosity (Boulanger et al., 1994). If the absorbing matter occupies a solid angle about the star, its UV/visible opacity is . Combining the constraint on the source diameter (), and the star distance (170 pc), we derive an upper limit for the distance, from the star to the absorbing matter of . HD102065 is a B9IV star with a luminosity and an effective temperature of K. The stellar radiation field intensity is in Draine units.
For an extinction the gas is molecular only for large densities. To search for a more realistic solution, we assume that . To quantify with this assumption, the column density of warm H2 that could be associated with the IRAS far-IR emission, we compute a grid of models with constant , varying the density from to , and the distance to the star from to (equivalent to from 20 to ).
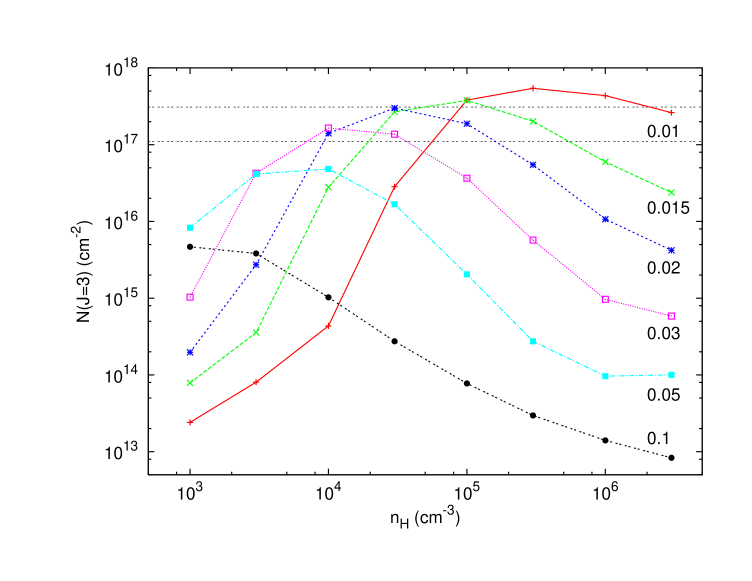
Figure 15 shows the column densities of , as a function of for various distances to the star. As distance decreases, the radiation field increases, the H2 photo-dissociation rate rises, and higher densities are required to retain hydrogen in its molecular form. The stronger radiative pumping populates higher rotational levels, which accounts for the bell shape of the curves. The same trend occurs at higher rotational levels, for which the curve maxima are shifted towards higher densities.
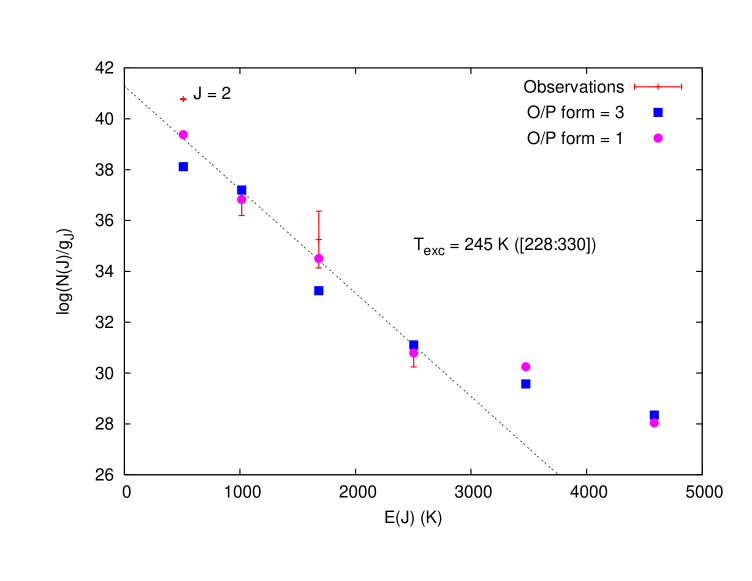
The observed excitation temperature of is reproduced for the correct column densities, in a range of models, as shown on Fig. 15. One typical example is illustrated in Fig. 16. It can be clearly seen however that the point lags under the curve. This is directly linked to the imposed ortho-to-para ratio on the formation on grains. This is because the high radiation field results in a photodissociation time scale which is an order of magnitude larger than the conversion time scale from ortho-to-para through reactive collisions, with either or . The only way to reproduce the column density is to assume a formation ortho-to-para ratio that is different from the statistical equilibrium value of 3. Fig. 16 shows that an initial ratio of 1 provides robust results. We are however unaware of any theoretical or experimental result that would support such an initial ratio.
We conclude that a pure steady-state PDR model is able to reproduce the excitation of at , observed towards HD 102065, with two ad hoc assumptions: the presence of warm and dense gas close to the star at a pressure , and an H2 ortho-to-para ratio, at formation, of 1. We checked the possibility that the warm H2 may be in a circumstellar disk. Upper limits on column densities from the Pictoris debris disk, are several orders of magnitude lower than the HD 102065 values (Lecavelier et al., 2001). The warm column densities observed towards HD 102065 are comparable to those detected from circumstellar disks about the young AeBe Herbig stars HD 100546 and HD 163296 (Lecavelier et al., 2003), but these disks are traced by strong near to mid-infrared emission that is not observed in HD 102065.
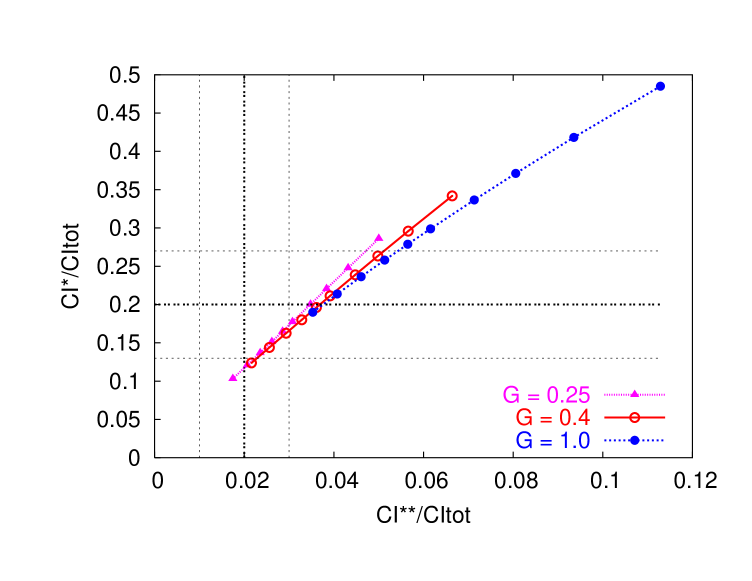
Gillmon et al. (2005) and Wakker (2006) analyzed a large set of FUSE Galactic H2 detections obtained towards extragalactic sources. Wakker (2006) showed that H2 excitation, for column density ratios between the 4 first J levels, follows a systematic trend with increasing total H2 column density. HD 102065, and the two remaining Chamaeleon stars studied by Gry et al. (2002), fall on the same trend extending to yet higher values (Fig. 17). This agreement indicates that H2 excitation observed towards the Chamaeleon stars, fit with observations towards extragalactic sources and is thus unlikely to be due to matter heated by the stars. Qualitatively, the trend observed in Fig. 17 is in agreement with the fact that the gas temperature and the H2 radiative pumping increase, as the H2 column density decreases. But, based on the HD 102065 results, we anticipate that a warm out-of-equilibrium H2 component is required to quantitatively reproduce the data. We conclude that the presence of some H2 at temperatures higher than the equilibrium temperature set by UV and cosmic-ray heating is a general characteristic of diffuse molecular gas in the Solar Neighborhood. Modeling of the wide sample of FUSE Galactic H2 measurements, is required to statistically quantify the fraction of out-of-equilibrium H2 gas. This warm molecular gas traces the local dissipation of turbulent kinetic energy. It is the dissipation of turbulence that creates the non-equilibrium chemistry discussed in Sect. 3.5.

5 Conclusions
We have gathered a wide set of observations characterizing the diffuse molecular cloud, observed towards the star HD 102065. These observations provide independent constraints on physical conditions, which are analyzed with the latest version of the Meudon PDR code.
A single density () slab of gas, bathed in a low radiation field, accounts for most observations (molecular fraction, gas temperature inferred from the , cooling in the C+ line, C i abundance and excitation). This model provides a physical and chemical reference upon which more elaborate interpretations can be developed to account for observables not reproduced by the model, namely the column densities of , and in its excited () levels.
We consider the possibility that high J H2 is associated with matter close to the star. We place constraints on this possibility using IRAS data on dust emission. We find a solution where dense () gas with a high pressure () would be located within 0.03 pc of the star. This solution requires the presence of high pressure gas close to the star and that the H2 ortho-to-para ratio at formation is 1. Such a departure from the statistical expectation is supported by no theoretical or experimental study.
The H2 excitation observed towards HD 102065 fits with the general trend observed from FUSE Galactic H2 observations towards extragalactic sources. We conclude that H2 excitation in the levels observed towards HD 102065, is unlikely to be due to matter heated by the star, but it is more likely characteristic of H2 in the Solar Neighborhood diffuse ISM. Our work supports earlier studies that proposed that H2 excitation in the levels, traces the presence of warm H2, heated by the localized dissipation, in space and time, of turbulent kinetic energy within diffuse molecular clouds. The warm H2 is physically associated with the bulk of the molecular gas, traced by the J=0 and 1 H2 absorptions, and is required to account for the column density. In addition, the warm H2 could contribute to the CH abundance, and the inhomogeneity of the CO abundance, as indicated by the comparison of absorption and emission spectra.
This paper outlines a framework for modeling the large number of Galactic H2 measurements derived from FUSE extragalactic observations, which cover 6 orders of magnitudes in H2 column densities. In diffuse clouds, the time scale of H2 formation, a few yr, is long compared to dynamical time scales. Observed values of the gas fraction in H2 are thus not expected to match steady-state values. Modeling of the available data will quantify how observed molecular fractions scatter about model values, and better constrain the formation rate than the present study. Modeling of these observations will, in addition, statistically quantify the presence of warm H2, heated by localized dissipation of kinetic energy.
References
- Black & Dalgarno (1977) Black, J.H., & Dalgarno, A., 1977, ApJS, 34, 405
- Boissé et al. (2005) Boissé, P., Le Petit, F., Rollinde, E., Roueff, E., Pineau des Forêts, G., Andersson, B.-G., Gry, C. & Felenbok, P. 2005, A&A 429, 509
- Boulanger et al. (1994) Boulanger, F., Prévot, M.L. & Gry, C. 1994, A&A, 284, 256
- Browning et al. (2003) Browning, M.K., Tumlinson, J., & Shull, J.M. 2003, ApJ, 582, 810
- Cecchi-Pestellini et al. (2006) Cecchi-Pestellini, C., Casu, S. & Dalgarno, A. 2006, MNRAS 364, 1309
- Draine (1978) Draine, B.T. 1978, ApJS, 36, 595
- Draine & Katz (1986) Draine, B.T., & Katz, N. 1986, ApJ, 310, 392
- Desert et al. (1990) Desert, F.-X., Boulanger, F., & Puget, J.-L. 1990, A&A, 237, 215, 236
- Falgarone et al. (2005) Falgarone, E., Verstraete, L., Pineau des Forêts, G., & Hily-Blant, P. 2005 A&A 433, 997
- Falgarone et al. (2006) Falgarone, E., Pineau des Forêts, G., Hily-Blant, P. & Schilke, P. 2006 A&A 452, 511
- Flower & Pineau des Forêts (1998) Flower, D.R. & Pineau des Forêts, G. 1998, MNRAS 297, 1182
- Gillmon et al. (2005) Gillmon, K., Shull, J.M., Tumlinson, J., & Danforth, C. 2006, ApJ 636, 891
- Gredel et al. (1991) Gredel, R., van Dishoeck, E. F. & Black, J. H. 1991, A&A,251, 625
- Gredel et al. (1993) Gredel, R., van Dishoeck, E. F. & Black, J. H. 1993, A&A, 269, 477
- Gry et al. (1998) Gry, C., Boulanger, F., Falgarone, E., Pineau des Forêts, G., & Lequeux, J. 1998, A&A, 331, 1070
- Gry et al. (2002) Gry, C., Boulanger, F., Nehmé C., Pineau des Forêts, G., Habart, E., & Falgarone, E. 2002, A&A, 391, 675
- Habing (1968) Habing, H.J. 1968, Bull Astron Inst Netherlands, 19, 421
- Jenkins & Tripp (2001) Jenkins, E.B., & Tripp, T.M. 2001, ApJS, 137, 297
- Joulain et al. (1998) Joulain, K., Falgarone, E., Pineau des Forêts, G., & Flower, D. 1998, A&A, 340, 241
- Kopp et al. (2000) Kopp, M., Roueff, E. & Pineau des Forêts, G. 2000, MNRAS 315, 37
- Lambert & Danks (1986) Lambert, D.L. & Danks, A.C. 1986, ApJ 303, 401
- Liszt and Lucas (2000) Liszt, H.& Lucas, R. 2000, A&A 355, 333
- Le Bourlot et al. (1993) Le Bourlot, J., Pineau des Forêts, G., Roueff, E. & Flower, D. 1993 A&A, 267, 233
- Le Bourlot et al. (1995) Le Bourlot, J., Pineau des Forêts, G., Roueff, E., & Flower, D.R. 1995, A&A, 302, 870
- Lecavelier et al. (2001) Lecavelier des Etangs, A., Vidal-Madjar, A., Roberge, A., Feldman, P.D., Deleuil, M., André, M., Blair, W.P., Bouret, J.-C., Désert, J.-M., Ferlet, R., Friedman, S., Hébrard, G., Lemoine, M., & Moos, H. 2001, Nature, 412, 6848, 706-708
- Lecavelier et al. (2003) Lecavelier des Etangs, A., Deleuil, M., Vidal-Madjar, A., Roberge, A., Le Petit, F., Hébrard, G., Ferlet, R., Feldman, P. D., Désert, J.-M.& Bouret, J.-C., 2003, A&A, 407, 935L
- Le Petit et al. (2004) Le Petit, F.; Roueff, E.; Herbst, E. 2004, ApJ 417, 993
- Le Petit et al. (2006) Le Petit, F., Nehmé C., Le Bourlot, J., & Roueff, E. 2006, ApJS 164, 506
- Lesaffre et al. (2007) Lesaffre, P., Gerin, M., & Hennebelle, P. 2007, A&A 469, 949
- Mathis et al. (1977) Mathis, J., Rumpl, W., & Nordsieck, K. 1977, ApJ, 217, 425
- Nakamura et al. (2006) Nakamura, F., McKee, C. F., Klein, R.I. and Fisher, R. T. 2006, ApJS 164, 477
- Nehmé et al. (2008) Nehmé, C., Gry, C., Boulanger, F., Le Bourlot, J., Pineau des Forêts, G., & Falgarone, E., 2008, A&A in press
- Pineau des Forêts et al. (1986) Pineau des Forêts, G., Flower, D.R., Hartquist, D.W., & Dalgarno, A. 1986, MNRAS 220, 801
- Ritchey et al. (2006) Ritchey, A. M., Martinez, M., Pan, K., Federman, S. R. & Lambert, D. L.2006, ApJ 649, 788
- Savage & Sembach (1996) Savage, B.D., & Sembach, K.R. 1996, A&A, 34, 279
- Shaw et al. (2005) Shaw, G., Ferland, G. J., Abel, N. P., Stancil, P. C. & van Hoof, P. A. M. 2005 ApJ 624, 794
- Shaw et al. (2006) Shaw, G., Ferland, G.J., Srianand, R.,& Abel, N.P. 2006, ApJ 639, 941
- Tumlinson et al. (2002) Tumlinson, J., Shull, J.M., Rachford, B.L., Browning, M.K., Snow, T.P. et al. 2002, ApJ 566, 857
- Wakker (2006) Wakker, B. P. 2006 ApJS 163, 282
- Zsargó & Federman (2003) Zsargó, J & Federman, S.R. 2003, ApJ 589, 319