Probing the Central Regions of Nearby Compact Elliptical Galaxies 11affiliation: Based on observations obtained at the Gemini Observatory, which is operated by the Association of Universities for Research in Astronomy, Inc., under a co-operative agreement with the NSF on behalf of the Gemini partnership: the National Science Foundation (United States), the Particle Physics and Astronomy Research Council (United Kingdom), the National Research Council of Canada (Canada), CONICYT (Chile), the Australian Research Council (Australia), CNPq (Brazil), and CONICET (Argentina).
Abstract
band spectroscopic observations recorded with NIFSALTAIR on Gemini North are used to probe the central arcsec of the compact elliptical galaxies NGC 4486B, NGC 5846A, and M32. The angular resolution of these data is arcsec FWHM; this corresponds to a spatial scale of 12 parsecs in NGC 5846A, which is the most distant galaxy in the sample. Indices that probe the strengths of various atomic and molecular features are measured. The central stellar contents of NGC 4486B and NGC 5846A are similar, in the sense that they occupy the same regions of the (Ca I, 12CO), (Na I, 12CO) and (13CO,12CO) diagrams. The NGC 4486B and NGC 5846A observations depart from the sequence defined by solar neighborhood giants in the (Na I, 12CO) diagram, in a sense that is consistent with both galaxies having non-solar chemical mixtures. For comparison, the M32 data is consistent with a chemical enrichment history like that in the Galactic disk; M32 could not have formed from the stripping of a larger elliptical galaxy. The behaviour of the near-infrared line indices as a function of radius is also investigated. The stellar content in the central arcsec of M32 appears to be well mixed. However, the radial behaviour of the indices in NGC 4486B and NGC 5846A show complicated behaviour, with the gradients that are present at large radii breaking down or reversing within a few tenths of an arcsec of the nucleus. Based on the age gradients predicted from visible wavelength spectra, coupled with the radial behaviour of the and 12CO(2,0) indices, it is suggested that the nuclear regions of NGC 4486B and NGC 5846A harbour intermediate age populations.
1 INTRODUCTION
Compact elliptical (cE) galaxies are among the rarest type of dwarf galaxy. Of the three cEs known within Mpc (M32, NGC 4486B, and NGC 5846A), all are neighbors of much more massive galaxies, and all appear to be tidally truncated (e.g. King 1962; Rood 1965, King & Kiser 1973). There are other high surface brightness compact galaxies in the local universe with young populations that are interacting with larger companions, such as NGC 1510, that may be cEs in distinct stages of their evolution. Despite the tantalizing hints that interactions with a much larger galaxy may play a key role in the formation of cEs, these objects do not appear in large numbers in nearby galaxy clusters, and many candidate cEs have turned out to be background ellipticals (e.g. Ziegler & Bender 1998; Drinkwater & Gregg 1998). A modest number of cEs are seen in more distant clusters, such as Abell 496 (Chilingarian et al. 2005) and Abell 1689 (Mieske et al. 2005).
The structural properties of cEs are reminiscent of larger classical elliptical galaxies (e.g Wirth & Gallagher 1984). Indeed, cEs fall along the low brightness end of the trend defined by classical elliptical galaxies on the MB – and Re – planes. Given their modest brightnesses and the nature of these trends, the structural properties of cEs are thus ‘extreme’ when compared with more massive elliptical galaxies, in the sense of having comparatively high central surface brightnesses () and small effective radii (log(R).
Various cE formation mechanisms have been examined in the literature, and most of these involve the tidal stripping of a progenitor galaxy. Faber (1973) suggested that cEs may be the remnant cores of ellipticals that have had their outer regions removed. Nieto & Prugniel (1987) propose a variation of this idea, in which the progenitors of cEs are a special type of low mass high central surface brightness elliptical that have been stripped of their outer envelopes, although candidate progenitors have not yet been discovered. Bekki et al. (2001) suggest that M32 is the remnant bulge of a ‘threshed’ disk galaxy, and evidence for a residual disk has been found (Graham 2002; Choi, Guhathakurta, & Johnston 2002). The Bekki et al. (2001) model has the merit of explaining the paucity of cEs, as they only form in a small region of parameter space. It should be noted that tidal stripping is not the only process that has been considered to form cEs, and Burkert (1994) describes how a high central surface brightness galaxy may form in close proximity to a much larger galaxy.
The characterization of stellar populations within galaxies, especially in their central regions where supermassive black holes are often found and signatures of recent star formation may also be present, provide information that is essential for probing the origins and evolution of these objects. In the current paper, the radial distribution of the brightest evolved stars in the central arcsec of the three closest cEs – M32, NGC 4486B, and NGC 5846A – is investigated. The data are unique in that they were obtained with an integral field spectrograph at near-infrared wavelengths, and have an angular resolution approaching the diffraction limit of an 8 meter telescope.
While cEs share common structural properties, there are substantial galaxy-to-galaxy differences in their stellar contents. As one of the closest and brightest galaxies in the sky, M32 has been the subject of numerous spectroscopic and photometric investigations. There is spectroscopic evidence of an intermediate age population both at visible (e.g. O’Connell 1980; Rose 1985; Bica, Alloin, & Schmidt 1990; del Burgo et al. 2001) and near-infrared (Davidge 1990) wavelengths. Studies of the resolved stellar content of M32 also reveal signs of an intermediate age component, in that the most luminous AGB stars have photometric properties that are indicative of an age of a few Gyr (e.g. Freedman 1992; Elston & Silva 1992; Davidge 2000; Davidge & Jensen 2007). Still, there is some disagreement between the analysis of the resolved stellar content and predictions made from integrated light spectroscopy. Davidge & Jensen (2007) find that the brightest AGB stars in M32 are uniformly mixed throughout the galaxy, and this is contrary to what might be expected based on the radial gradients in age and metallicity that were found by Rose et al. (2005) and Worthey (2004) in their investigation of visible wavelength spectra.
The stellar content of NGC 4486B differs from that of M32 in that the strengths of absorption features in the visible light spectrum of NGC 4486B are consistent with those of an old, metal-rich system (Sanchez-Blazquez et al. 2006b, hereafter SGCG). In addition, the absorption features in the visible spectrum of NGC 4486B are indicative of a metallicity gradient with a slope that is similar to those in classical elliptical galaxies (Sanchez-Blazquez, Gorgas, & Cardiel 2006, hereafter SGC), whereas the metallicity gradient in M32 is much shallower (e.g. Worthey 2004; SGC). There is also evidence for a comparatively steep age gradient in NGC 4486B when compared with other ellipticals (SGC), opening the possibility that an intermediate age component like that in M32 might await discovery near the center of NGC 4486B.
NGC 4486B harbours a double nucleus (Lauer et al. 1996), and there is kinematic evidence for a central super-massive black hole (Kormendy et al. 1997). Adopting the black hole mass estimated by Kormendy et al. (1997), then the ratio of central black hole to total bulge mass in NGC 4486B is larger than what is seen in other elliptical galaxies (e.g. Magorrian et al. 1998). One possible explanation of such a result is that NGC 4486B may once have been a more massive galaxy, but that the outer regions were stripped away, presumably by interactions with the much larger NGC 4486. The amount of material that would have to be stripped from the NGC 4486B progenitor in such a scenario is substantial. If the progenitor of NGC 4486B had a central black hole mass that fell along the trend between black hole mass and spheroid (‘bulge’) mass that is defined by other systems, then the progenitor spheroid must have been between one and two orders of magnitude more massive than is presently seen. Still, the mass of the central object in NGC 4486B is uncertain, and Soria et al. (2006a) argue for a black hole mass that is an order of magnitude lower than that computed by Kormendy et al. (1997).
NGC 5846A has not been as extensively studied as M32 or NGC 4486B, probably because it is more distant. Still, NGC 5846A shares some similarities with NGC 4486B. Like NGC 4486B, NGC 5846A is a companion to a much larger galaxy, which in turn is the largest member of a group that is dominated by early-type galaxies (Mahdavi, Trentham, & Tully 2005). As in NGC 4486B, the absorption lines at visible wavelengths in the integrated spectrum of NGC 5846A have strengths that are indicative of an old, metal-rich system (SGCG), and there is a metallicity gradient that is similar to those in classical ellipticals (SGC). The age gradient in NGC 5846A is shallower than that in NGC 4486B, but is still typical of that seen in other ellipticals (SGC).
The spectra that have been used previously to probe the stellar contents of M32, NGC 4486B, and NGC 5846A were typically recorded with ground-based telescopes during natural seeing conditions, and so have angular resolutions that are on the order of an arcsec. Observations with higher angular resolution are desireable to probe the central regions of these galaxies, where young or intermediate age populations might lurk. The use of adaptive optics (AO) systems on ground-based 8 metre telescopes can produce a substantial gain in angular resolution over what can be achieved without wavefront correction. In the current study, AO-corrected spectra of M32, NGC 4486B, and NGC 5846A in the m wavelength region are used to examine the stellar content of the central regions of these galaxies. The integrated light near m in old and all but the youngest of intermediate age systems is dominated by first ascent giants (e.g. Frogel et al. 1978; Maraston 2005). Given that the photometric properties of giants are sensitive to age and metallicity then spectroscopic observations in the m interval are potentially useful for investigating population gradients.
Various properties of the three cEs are listed in Table 1. The quantities listed for each galaxy are the distance modulus (second column), the absolute band magnitude (third column), the radius at which the surface brightness reaches 25 mag arcsec-2 in (fourth column), and the central velocity dispersion measured in a 0.1 arcsec radius aperture (fifth column). For homogeneity, the distance moduli are those measured by Tonry et al. (2001) from surface brightness flucuations. The absolute brightnesses were measured from images in the 2MASS Large Galaxy Atlas (Jarrett et al. 2003), while the isophotal radii are from De Vaucouleurs et al. (1991). The velocity dispersions were measured from the data discussed here (§4).
The spectra were recorded with NIFS on Gemini North. The wavefront incident to NIFS was corrected by the ALTAIR AO system, and the resulting signal at the NIFS image plane has an angular resolution of arcsec. The resulting spatial resolution of these data spans a broad range. In M32 the spatial resolution is 0.4 parsecs, whereas in NGC 4486B the spatial resolution is parsecs and in NGC 5846A it is parsecs.
The paper is structured as follows. Details of the observations and the techniques used to reduce the data are discussed in §2. The angular resolution of the data and a preliminary galaxy-to-galaxy comparison of the band spectra are the subjects of §3. A quantitative investigation of the stellar content using line indices, including an investigation of radial trends in stellar content, is carried out in §4. A summary and discussion of the results follows in §5.
2 OBSERVATIONS & REDUCTIONS
The spectra of all three galaxies were recorded with NIFSALTAIR on Gemini North (GN). NIFS (McGregor et al. 2003), is an integral field spectrograph that covers the m wavelength interval. The science detector is a HAWAII-2RG HgCdTe array. A contiguous arcsec2 area on the sky is sampled with 29 slitlets, each of which subtends a arcsec2 area; the direction perpendicular to the dispersion axis has an angular scale of 0.04 arcsec pixel-1, and the spectral dispersion is 5300.
ALTAIR (Herriot et al. 2000) is the facility AO system on GN. Prior to 2006, ALTAIR used natural guide stars (NGSs) exclusively as reference beacons for AO correction, and the M32 data were recorded in this mode, with the bright semi-stellar galaxy nucleus serving as the NGS. This mode could not be employed for NGC 4486B and NGC 5846A as the nucleus of each galaxy is too faint and too diffuse to serve as a NGS. Moreover, both galaxies are at moderately high Galactic latitudes, and there are no stars of a suitable brightness that are close enough on the sky to serve as NGSs. Therefore, the observations of NGC 4486B and NGC 5846A were obtained using laser guide stars (LGSs), which is a capability that has recently been commissioned on GN (Boccas et al. 2006).
When using artificial reference beacons it is necessary to monitor the tip/tilt (T/T) component of the incident wavefront with a natural guide source near the science target. While the nuclei of NGC 4486B and NGC 5846A are not suitable for use as NGSs for high-order AO correction, they can be used as T/T reference sources. This is possible since the inherently low angular resolution of the four element T/T wavefront sensor (WFS) in ALTAIR makes it more stable when guiding on faint, extended sources than the higher-order NGS WFS.
The data were recorded over two observing seasons. The ALTAIR field lens, which moves the conjugatation point for AO correction from a fixed altitude above the summit of Mauna Kea to the primary mirror of the telescope, was deployed for these observations, as the use of this lens significantly reduces anisoplanicity. The M32 spectra were obtained on the night of October 23, 2005 as part of the NIFS commissioning program. The observations of NGC 4486B and NGC 5846A were recorded as part of programs GN2006B-SV-103 and GN2007A-DD-6. The spectra of NGC 4486B used in this paper were obtained on the night of February 6, 2007, while the observations of NGC 5846A were recorded on June 1, 2007. Six 600 sec exposures were recorded of M32, while eight 85 sec exposures were recorded of NGC 4486B and fourteen 85 sec exposures were recorded of NGC 5846A.
Each galaxy observation was paired with that of a blank sky field, which was recorded either immediately before or after the galaxy observation. At least one telluric standard star observation was made either immediately before or after the galaxy observations on a given night. In the case of NGC 4486B and NGC 5846A, the telluric standard was observed with the LGS AO system activated so that the corrected image quality could be assessed. A modest sample of bright spectroscopic/radial velocity standard stars were also observed as part of program GN2006B-SV-103. The telluric and spectroscopic standard stars are summarized in Table 2.
The first step in the data reduction sequence was to subtract the sky spectra from the corresponding galaxy exposures, and the results were divided by a flat-field frame. Cosmic rays were identified using a routine that identified pixels with intensities that greatly differed from those of the surroundings. The intensities of the pixels that were found to contain cosmic rays were set to the median of the surrounding pixels. The flat-fielded data were wavelength calibrated using observations of an Ar arc, which were recorded during each night. The wavelength-calibrated spectra for each galaxy were then summed, and the combined spectra were divided by the spectrum of the appropriate telluric standard star. With the exception of Br, the spectra of the telluric standard stars are largely free of photospheric absorption lines. The Br line was removed from the telluric spectra using the interactive line-fitting and subtraction routine in the IRAF routine SPLOT.
3 DATA CHARACTERIZATION
3.1 Assessing the Angular Resolution of the Observations
The angular resolution of these data is an important issue when considering the spectroscopic characteristics of the central regions of the target galaxies. To monitor the intrinsic seeing, the telluric standard stars that were observed as part of the NGC 4486B and NGC 5846A data sets were recorded with the LGS AO system activated. The PSFs obtained from the telluric star observations are centrally concentrated, with a FWHM arcsec. At 0.2 arcsec radius the PSF drops to of the peak value, while at 0.4 arcsec radius the PSF is only of the peak value.
There is crosstalk between the spatial elements in integral field spectrographs because of (1) the size of the source being studied, which includes contributions not only from the intrinsic angular extent of the object, but also from seeing and the telescope optics, and (2) the optics within the spectrograph. The issue of slitlet-to-slitlet scatter was investigated using the light profiles of the telluric standard stars that were observed with ALTAIR activated. If the NIFS optics introduce significant slitlet-to-slitlet scattering then the FWHM of the stellar profile measured along the central slitlet will be narrower than the FWHM measured perpendicular to this direction. The light profile of the telluric standard stars measured between slitlets is not wider than that measured along the central slitlet, indicating that the AO-corrected PSF is the dominant contributor to crosstalk between NIFS slitlets for sources with FWHM = 0.1 arcsec.
The nature of AO-corrected point spread functions (PSFs) depends on environmental conditions and the properties of the T/T source. The image quality of the galaxy observations can be assessed in a manner that accounts for these factors by comparing the AO-corrected light profiles of the galaxies with those obtained using the HST. To enable such a comparison, light profiles were constructed for each galaxy by integrating the two dimensional spectra between rest frame wavelengths and m, and the results are shown in Figure 1. All profiles plotted in this figure have been normalized to the peak value.
Two of the galaxies in our sample have published light profiles based on HST data. The dashed line in the top panel of Figure 1 is the F475W light profile of NGC 4486B from Ferrarese et al. (2006), and there is remarkable agreement with the NIFS data. Thus, the angular resolution of the NGC 4486B NIFS data are comparable to that obtained with the HST at visible wavelengths. The dashed line in the lower panel of Figure 1 is the F222M light profile for M32 plotted in Figure 8 of Corbin, O’Neil, & Rieke (2001). The NICMOS data have an angular resolution arcsec. The ALTAIR observations are significantly narrower than the HST data when arcsec, indicating that the current data has a higher angular resolution than was acheived with NICMOS.
NGC 5846A has the most compact light profile in our sample. Unfortunately, we are not aware of extant high angular resolution images of this galaxy. Still, given that the light profile has a width of arcsec, the NIFS observations of NGC 5846A likely have an angular resolution that is comparable to, or possibly even better than, that of the NGC 4486B data.
3.2 The m Spectra: A First Look
The visible wavelength spectra of M32, NGC 4486B, and NGC 5846A show distinct differences, in the sense that M32 has deeper H and shallower Mgb absorption than the other galaxies. This in turn indicates that these galaxies have different stellar contents (e.g. SGCG). This being the case, then how do the spectra of these galaxies compare in the near-infrared, where the integrated light is dominated by stars that are very different from those that contribute significantly at visible wavelengths? The first overtone 12CO band heads are the most prominent features in the near-infrared spectra of old and intermediate age populations, and so are potentially prime diagnostics of stellar content. The depths of these features have been modelled previously, and they are predicted to be sensitive to population parameters (e.g. Figure 11 of Vazquez, Carigi, & Gonzalez 2003).
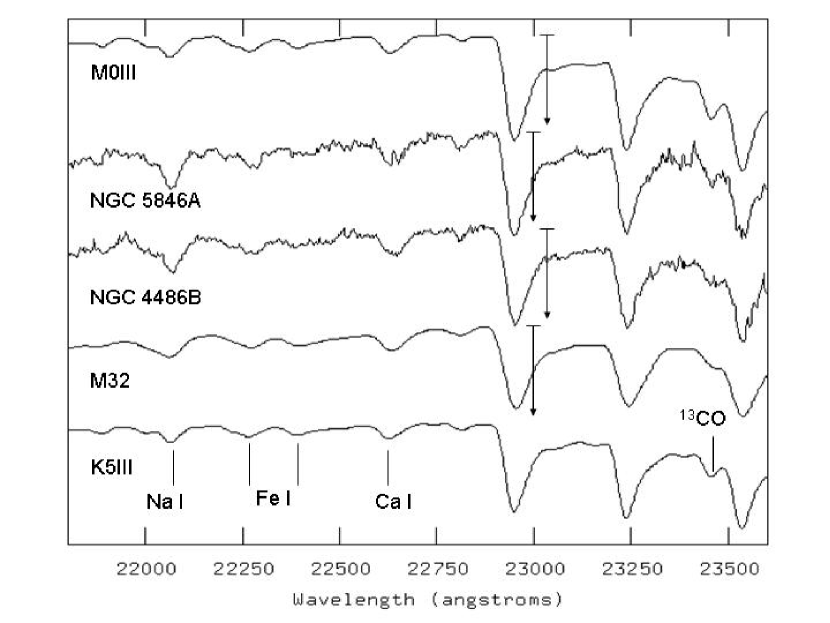
The m spectrum of the central arcsec of each galaxy, which is the approximate seeing disk during ‘typical’ ground-based observing conditions, is shown in Figure 2. Also plotted are the spectra of the K5III star HR 4801 and the M0III star HR 4884. A low-order continuum has been divided out of each spectrum. The vertical axis in Figure 2 shows intensity in a linear scale, and the spectra have been shifted vertically to facilitate comparisons.
The random and systematic motions of stars broaden absorption lines in the integrated spectra of galaxies, and spectra should be smoothed to a common kinematic broadening before making comparisons. To allow this to be done, a velocity dispersion and radial velocity were measured for each spectrum using the Tonry & Davis (1979) cross-correlation routine. The velocity dispersions measured within 0.1 arcsec radius of the galaxy centers are listed in the last column of Table 1. The estimated uncertainties in these measurements are roughly km sec-1. It should be emphasized that the entries in this Table are based on the widths of the absorption features averaged over a 0.1 arcsec radius, and thus reflect contributions from both the random and rotational motions of stars in this region of each galaxy. The rotational component will contribute to the line widths, and smaller dispersions would be found had the spectra not been radially averaged, but instead restricted to the dynamical axes of the galaxy.
The entry for M32 in the last column of Table 1 is consistent with that measured by Joseph et al. (2001) from STIS spectra. The results in that paper predict a total line broadening of km sec-1 in a 0.1 arcsec radius region centered on the galaxy nucleus. This agrees with the entry for this galaxy in Table 1, and so there is not a significant difference with the NIFS data. Spectra with moderately high angular resolution are also available for NGC 4486B. Kormendy et al. (1997) measure a velocity dispersion of km sec-1 near the center of NGC 4486B, and this is 30 km sec-1 lower than that found here. While the difference is larger than the estimated uncertainty in the NIFS measurements, the Kormendy et al. (1997) data have an angular resolution of arcsec, compared with arcsec for the NIFS data.
The spectra plotted in Figure 2 have been Gaussian smoothed to match the velocity dispersion in the central regions of NGC 4486B, which has the highest velocity dispersion in the data (Table 1). The 12CO band heads in M32 are weaker than in the other galaxies, having a depth that is slightly shallower than in the K5III star. The depths of the Na I, Fe I, and Ca I features in M32 are also weaker than in the other galaxies, but are comparable to those in the K5III spectrum.
The spectra of NGC 4486B and NGC 5846A are similar, as might be expected based on the ages and metallicities of these galaxies inferred from visible wavelength spectra (e.g. SGCG). Still, the 12CO band heads are slightly deeper in NGC 5846A. This difference in line strength can be attributed – at least in part – to differences in the radial distributions of populations in the innermost regions of these galaxies (§4).
4 STELLAR CONTENTS
4.1 A Comparison of Stellar Contents Using Line Indices
Spectra were extracted in 0.1 arcsec wide annuli. The 0.1 arcsec width matches the angular resolution of the data while also allowing the extracted spectra to have reasonably high signal-to-noise ratios. A velocity dispersion and a radial velocity were measured for each extracted spectrum. The velocity dispersion measures the line broadening caused by the random and systematic motions of stars in each annulus. Given that the extracted spectra sample annuli, as opposed to the kinematic axes, the velocity measurements are not suitable for a kinematic study; rather, they simply provide the empirical measure of line width that is needed to produce spectra with a common intrinsic resolution.
To create spectra from which a homogeneous set of line strengths could be obtained, the extracted spectra were convolved with Gaussians so that the results had line broadenings that matched those in the central regions of NGC 4486B. The standard deviation of the Gaussian that was applied to each extracted spectrum was computed from the velocity dispersion measurements discussed above. The equivalent widths of Na I, Ca I, and 12CO (2,0) absorption features were measured in the broadened spectra using the continuum and line bandpasses defined by Ramirez et al. (1997).
Two other indices were measured. Silva, Kuntschner, & Lyubenova (2007) define indices that sample Fe I transitions, and the results are averaged to produce the index. In addition, the 13CO(2,0) band head is seen in the spectra, and the equivalent width of this feature was measured using the bandpasses listed in Table 3. The 13CO(2,0) band head is located in the wings of the much stronger 12CO(4,2) feature, and the continuum passbands in Table 3 measure only a local pseudo-equivalent width. Hence, the 13CO(2,0) index defined here is only a relative measure of the strength of this feature.
4.1.1 The Impact of Kinematic Broadening
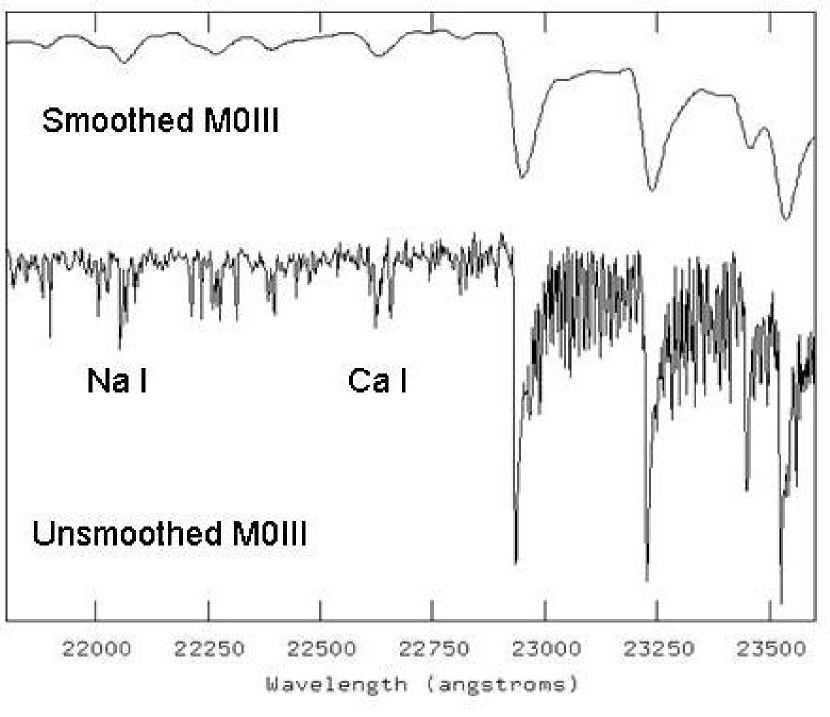
The impact of kinematic broadening on the line indices was assessed by convolving the standard star spectra with a Gaussian to simulate the velocity smearing near the center of NGC 4486B. Smoothing to match the kinematic properties of stars in the central regions of the cE galaxies has a substantial impact on the visual appearance of the stellar spectra. This is demonstrated in Figure 3, where the unsmoothed and smoothed spectra of the M0III giant HR 4884 are compared. The absorption features in the smoothed spectrum are heavily blurred, and the complex of lines near the Na I and Ca I features each form a single broad trough in the smoothed spectrum.
We gauge the impact of velocity broadening on line indices with the statistic C(), which is the ratio of a line index measured from an unbroadened spectrum to that measured after applying a broadening function to simulate a velocity dispersion (e.g. Davies, Sadler, & Peletier 1993). The C() values measured for the K1III star HR4793 and the M0III star HR 4884, where is the central velocity dispersion of NGC 4486B, are shown in Table 4 for the Na I, Ca I, 12CO (2,0), and indices; the impact of velocity smearing was not investigated for the 13CO index, since (1) the passbands were defined from spectra that were already velocity broadened, and (2) this index is not compared here with measurements made in other studies. Indices corresponding to a null velocity dispersion can be obtained by multiplying the values given in this study by the entries in Table 3. The C() entries in Table 4 are similar to those shown in Figure 8 of Silva et al. (2007) for a velocity dispersion of 330 km sec-1.
4.1.2 The Na I and Ca I Indices
The Na I and Ca I line indices sample the strengths of transitions from more than one element, and this complicates the sensitivities of the indices to chemical abundance. Such contamination is common among line indices at visible wavelengths (e.g. Worthey et al. 1994). In addition to Na lines, the Na I index also includes significant Si absorption, although Silva et al. (2007) point out that both Na and Si are expected to be super metal-rich in early-type galaxies, and this should at least partially mitigate the impact of contamination on the Na I index. Contamination is of greater potential concern for the Ca I index, where transitions due to S, Si, Ti, Sc, and Fe are present in addition to those of Ca. These elements have diverse chemical enrichment pedigrees, thereby complicating the interpretation of the Ca I index.
Age is another parameter that might affect the indices. The depth of H is sensitive to the brightness of the main sequence turn-off, and galaxies that fall above the relations defined by old systems on the H–[MgFe’] plane are thought to have a young stellar component. Silva et al. (2007) find that galaxies that fall well above the old galaxy relation on the H–[MgFe’] plane also fall well away from the old sequence on the Na I–[MgFe’] diagram. Strong Na I absorption thus appears to be linked to strong H absorption, and so ‘aging’ a system to predict the line indices that might be expected many Gyr in the future if there is no further star formation shifts the Na I index to smaller values. Silva et al. (2007) suggest that this behaviour is due to the presence of an extended giant branch, made up of AGB stars, in younger systems.
The location of all three galaxies on the H–[MgFe’] diagram were examined using the indices measured by Sanchez-Blazquez, Gorgas, Cardiel, & Gonzalez (2006a) to determine if age should be considered when interpreting the near-infrared indices. NGC 4486B and NGC 5846A fall in a part of the diagram indicating that they are old systems, while M32 falls well above this relation. The Na I index measurements of M32 will thus have to be adjusted for age affects. In §5 it is argued that age may also affect the Na I indices in the central few tenths of an arcsec of NGC 4486B and NGC 5846A, which is a region that contributes only a modest fraction of the total signal to the Sanchez-Blazquez et al. (2006a) observations.
The Na I and Ca I indices in each annulus are plotted against the 12CO(2,0) index in Figure 4. Ramirez et al. (1997) measured the strengths of Na I, Ca I, and 12CO (2,0) features in a sample of disk giants, and these data can be used to help interpret the galaxy indices. Caution should of course be exercised when comparing stellar and galaxy index measurements as galaxies are composite stellar systems, and their spectra show the integrated contributions from stars spanning a range of luminosities and properties. Still, given that the near-infrared spectral region is dominated by stars that are nearing the end of their evolution, the issue of dealing with integrated spectra is not as critical as at visible wavelengths, where the light comes from stars spanning a much more diverse range of evolutionary states. Indeed, in old systems 55% of the band light from RGB stars, whereas RGB and main sequence stars each contribute 30% of the band light (Maraston 2005).
A Galactic disk sequence for the (Na I,12CO) and (Ca I,12CO) diagrams was obtained by fitting a linear relation to the entries in Table 5 of Ramirez et al. (1997) with 12CO between 10Å and 16Å, and the results are shown as dashed lines in the two top panels of Figure 4. To adjust for velocity smearing in the cE spectra, the Ramirez et al. (1997) indices were divided by the CNGC4486B values listed in Table 4 prior to fitting the linear relation. While the stars used by Ramirez et al. (1997) likely have a mix of abundances, the scatter about the mean relations is only on the order of .
The NGC 4486B and NGC 5846A data define a single wide sequence in the (Na I, 12CO) diagram, suggesting that there are similarities in the stellar contents of the central regions of these galaxies. More specifically, that NGC 4486B and NGC 5846A fall along a moderately tight sequence in the (Na I, 12CO) diagram suggests that the stars in both galaxies have similar Na Si abundances. It might be anticipated that the stars in elliptical galaxies experienced chemical enrichment histories that are systematically different from those of stars in the Galactic disk, with the result that stars in the galaxies may have chemical mixtures that differ from those in the Galactic disk. In fact, the Na I indices in NGC 4486B and NGC 5846A fall well above the Galactic disk sequence, by an amount that exceeds the scatter in the Galactic disk giants.
The M32 data are distinct from the NGC 4486B NGC 5846A sequence in the (Na I, 12CO) plane, in the sense of having weaker Na I absorption at a given 12CO(2,0) equivalent width. The M32 datapoints huddle in a very tight clump above the Galactic disk giant sequence. The ‘aging vectors’ on the H–Na I plane in Figure 16 of Silva et al. (2007) suggest that as M32 ages then the Na I index will ultimately decrease by 0.4 – 0.5 Å with respect to the present day value. Such a correction moves the M32 datapoints on the (Na I, 12CO) diagram in Figure 4 so that they fall directly on the trend defined by solar neighborhood giants. This suggests that the abundances of Na and Si in M32 are similar to solar neighborhood values.
While there is considerable scatter, the galaxy datapoints on the (Ca I, 12CO) diagram overlap with the Galactic disk sequence. The M32 Ca I indices scatter immediately above the Galactic disk sequence in the middle panel of Figure 4, although the offset between the M32 and Galactic disk sequences is comparable to the scatter in the Galactic disk Ca I values. The locations of all three galaxies on the (Ca I, 12CO) diagram suggests that the elements that dominate the Ca I bandpass in these systems have abundances that are comparable to those among stars in the solar neighborhood. Thomas, Maraston, & Bender (2003) conclude that the enrichment history of Ca in early-type galaxies may differ from that of other elements, in that the Ca abundance is depressed with respect to other elements. While caution should be excercised because of contamination from elements other than Na and Ca, that the NGC 4486B and NGC 5846A Ca I indices in Figure 4 scatter about the solar neighborhood sequence, whereas the Na I indices fall well above the solar neighborhood track in this figure, is consistent with the Thomas et al. (2003) findings.
4.1.3 The Index
Silva et al. (2007) conclude that the index is dominated by Fe-peak elements. Still, CN absorption may compromise the metallicity sensitivity of this index, and could explain why it does not change amongst old galaxies with velocity dispersions larger than 150 km sec-1 (Silva et al. 2007). Like the Na I index, the index is higher at a given [MgFe’] in galaxies that contain young populations than those that are believed to be old, although the offset between the young and old sequences is smaller than that shown by the Na I index.
The NGC 4486B and NGC 5846A data form a tight sequence on the (, 12CO) diagram, that falls above the sequence defined by the solar neighborhood standard stars. The dispersion in the sequence is roughy consistent with the measurement errors. That the index does not change with 12CO in NGC 4486B and NGC 5846A is consistent with the absence of a trend between and velocity dispersion when the latter is moderately high. The M32 data points fall near the lower end of the scatter envelope defined by NGC 4486B and NGC 5846A. The location of M32 on the (H, [MgFe’]) diagram suggests that the index of M32 will drop by over the next few Gyr if there is no more star formation, and this is sufficient to move M32 onto the solar neighborhood sequence.
4.1.4 The 13CO(2,0) Index
The 13CO(2,0) index was measured in the spectra of the radial velocity standard stars, and the results were used to construct the Galactic disk reference sequence that is shown as a dotted line in the lower panel of Figure 4. The M32 13CO(2,0) measurements show little dispersion on the (13CO,12CO) diagram, and fall squarely on the standard star sequence. The NGC 4486B and NGC 5846A 13CO(2,0) measurements show a much larger dispersion than the M32 data, but still tend to scatter about the Galactic disk sequence. 12C is produced in Type II SNe and in AGB stars, whereas 13C is produced in the CN cycle and ejected from intermediate mass AGB stars (Iben & Renzini 1983). That the cE data points in the lower panel of Figure 4 scatter about the standard star sequence suggests that the enrichment timescale of 13C in these galaxies has been the same as in the solar neighborhood.
4.2 Absorption Line Gradients
The spatial distribution of stars within galaxies provides a fossil record of the galaxy’s collapse history and subsequent evolution. The Na I, Ca I, , and 12CO(2,0) indices are plotted as a function of radius in Figure 5. The errorbars show uncertainties that were computed from the dispersion in index measurements made from unstacked spectra. The uncertainties in each dataset are largest in the innermost annulus, where only 3 individual spectra were combined. The horizontal axes in these figures are logarithmic with radius, as previous studies have found roughly linear relations between the equivalent widths of various absorption features and log(r) (e.g. Davidge 1992; Davies et al. 1993). Simulations also predict that evolutionary processes often produce linear relations between metallicity and log(r) (e.g. Kobayashi 2004).
In an effort to quantify the size and significance of any gradients, least square fits were made to the indices as a function of log(r), and the resulting values of Index/log(r) are shown in Table 5. The plots in Figure 5 suggest that trends at larger radii may differ from those in the inner regions of the galaxies. Therefore, Index/log(r) was also computed only when arcsec, and the results are shown in brackets in Table 5.
4.2.1 M32
For the purposes of discussion, a gradient is considered to be significant when Index/log(r) differs from zero in excess of the level. In the case of M32, the gradient with the highest statistical significance is that involving the Ca I index, which decreases in strength with increasing radius when the full range of radial distances is considered. However, when only data with arcsec are considered then a significant gradient is not found. While the index shows a significant gradient when arcsec, the Na I and 12CO(2,0) indices do not show significant gradients. The low amplitudes or absence of gradients in the NIFS observations of M32 are consistent with line index measurements of this galaxy at visible wavelengths, which reveal line gradients that are weak or non-existent, and hence differ in character from what is typically seen in classical elliptical galaxies (e.g. Davidge 1991).
4.2.2 NGC 4486B
The radial behaviours of the Ca I and 12CO(2,0) indices in NGC 4486B differ from what is seen in the other galaxies. There is a general tendency for the Ca I and 12CO(2,0) indices to strengthen with increasing radius near the galaxy center, with the trend either flattening or reversing direction near arcsec. This change in behaviour affects the significance of gradients that are measured from the full range of radial distances covered by the NIFS data. For example, the entries in Table 5 indicate that the Ca I index increases with radius throughout all of the region that is covered by the NIFS data, although the gradient ceases to be significant if only the data with arcsec are considered. For comparison, the 12CO(2,0) index in NGC 4486B shows a significant gradient in the sense of becoming weaker with increasing radius when arcsec, although when the entire range of radii is considered then a significant gradient is found in the opposite sense, due to the behaviour of the 12CO(2,0) index near the nucleus. The Na I index does not vary significantly with radius in NGC 4486B.
There is a significant gradient in the index in NGC 4486B when the full range of radii is considered, while the slope differs from zero at the level when only the measurements with arcsec are considered. The measured slopes are skewed by the index at the largest radius, which is an outlier and is the smallest index measured in the three cEs. Still, even if this point is not considered then the slope measured from all of the remaining data differs from zero at more than the level. Thus, a robust result is that there is a mild gradient in NGC 4486B.
The complex radial behaviour of line indices in NGC 4486B is contrary to what might be expected from previous observations of this galaxy at visible wavelengths, which find that metallic absorption features systematically weaken with increasing radius (Davidge 1991; SGC). Indeed, the metallicity gradient in NGC 4486B measured by SGC is typical of that in classical elliptical galaxies. The NIFS observations of NGC 4486B have a much higher angular resolution than the data used by SGC and Davidge (1991), and these studies do not explore the nature of line gradients in the central 0.5 arcsec of this galaxy. The NIFS data indicate that the trends seen at large radius break down in the central arcsec of NGC 4486B.
4.2.3 NGC 5846A
Both the Na I and Ca I indices vary significantly with radius in NGC 5846A, in the sense that they systematically weaken with increasing radius. The 12CO(2,0) index in NGC 5846A shows a similar tendency, although the slope differs from zero at only the level. The index does not vary with radius in NGC 5846A. SGC found that metallic absorption features weaken with increasing radius in NGC 5846A, and the NIFS data suggest that the gradients that are present at larger radii extend into the central arcsec of this galaxy.
4.2.4 NGC 4486B NGC 5846A: Two Peas in a Pod?
NGC 4486B and NGC 5846A show structural similarities, having similar overall sizes, in that the values in Table 1 correspond to 1.4 kpc for NGC 4486B and 1.6 kpc for NGC 5846A, and central velocity dispersions. Thus, it is of interest to compare the line indices in the central regions of these galaxies. A complicating factor is that NGC 4486B and NGC 5846A are at different distances. To simulate the radial properties of NGC 4486B as if it were observed at the distance of NGC 5846A, the NGC 4486B measurements in Figure 5 were shifted by 0.19 dex to smaller radii, and the results are compared with the NGC 5846A measurements in Figure 6. There is excellent overlap between the line indices in the two galaxies after accounting for the difference in distance. When the two galaxies are considered in concert, there is a clear tendency for the Na I, Ca I, and 12CO(2,0) indices to weaken with increasing radius when log(r. At smaller radii there is little or no evidence for radial variations in the Na I and Ca I indices. However, when log(r the 12CO(2,0) indices of both galaxies overlap, and show a clear tendency for the 12CO(2,0) index to weaken towards smaller radii. There is also a tendency for the indices to strengthen with decreasing radius when log(. These comparisons suggest that the radial distributions of stellar content in the central regions of both galaxies have been influenced in similar ways. Possible causes of the line gradients in the innermost regions of these galaxies are considered in §5.
5 DISCUSSION & CONCLUSIONS
The near-infrared spectroscopic properties of the central arcsec of the cE galaxies NGC 4486B, NGC 5846A, and M32 have been investigated with NIFS ALTAIR on GN. As the closest cE galaxies, these are unique laboratories for probing the nature and origins of this galaxy type. The observations of NGC 4486B and NGC 5846A utilize the LGS capability on GN. The angular resolution is comparable to that obtained with the HST at visible wavelengths, and corresponds to a spatial resolution of parsecs at the distance of NGC 4486B and parsecs at the distance of NGC 5846A.
Spectroscopic studies in the band are complementary to those at visible wavelengths. Whereas the integrated light at visible wavelengths comes from a diverse mix of stellar types, the band light from all but the youngest stellar systems is dominated by the most highly evolved first ascent giants and AGB stars, the photometric and spectroscopic properties of which are sensitive to age and metallicity. Indices that probe portions of the spectrum that contain, among other features, Na I, Ca I, and Fe I lines, as well as the first overtone bands of CO, have been measured in each galaxy. The relative strengths of these features and the manner with which they vary with radius can be used to compare the stellar contents of the central regions of the three galaxies, and provide insights into their past histories. The stellar content of each galaxy is discussed in turn below.
5.1 M32
The NIFS data reveal weak or non-existent line gradients near the center of M32. Spectra of M32 at visible wavelengths show similar behaviour (e.g. Davidge 1991), albeit at larger radii than probed with NIFS. Observations of M32 at visible wavelengths with the HST reveal that the color is constant throughout the central arcsec, although there may be a slight change in color within arcsec of the nucleus (Lauer et al. 1998). The absence of near-infrared line gradients near the center of M32 suggests that the uniform distribution of AGB stars that was found throughout the main body of M32 by Davidge & Jensen (2007) continues into the innermost regions of the galaxy.
The first-overtone 12CO bands are sufficiently deep that their strengths can be gauged with narrow-band photometric measurements. Peletier (1993) investigated the radial profile of the CO index in M32, and the results in his Table 2 indicate that the CO index does not change with radius throughout much of the galaxy. However, within 2 arcsec of the galaxy center there is a tendency for the CO index to strengthen slightly with decreasing radius. While it should be kept in mind that the Peletier data likely have an angular resolution of an arcsec or more, the NIFS data also show a weak () tendency for 12CO(2,0) to strengthen with decreasing radius when arcsec, although this trend disappears if data with arcsec are included.
The line indices measured from the NIFS spectra indicate that the chemical mixture in M32 differs from that in NGC 4486B and NGC 5846A. When placed on diagrams relating the Na I, Ca I, and 13CO(2,0) indices to the 12CO(2,0) index, M32 falls near or directly on the sequence defined by solar neighborhood giants, whereas NGC 4486B and NGC 5846A depart from the solar neighborhood giant trend on the (Na I, 12CO) diagram (§4). Given that the Na I and Ca I indices each sample more than one element, then these results suggest that the mixture of elements that contribute to the Na I and Ca I indices are close to solar in M32, as is the ratio 13C/12C.
The comparisons in Figure 4 thus suggest that the enrichment history for the gas from which the stars in M32 formed was similar to that in the Galactic disk, as opposed to the rapid enrichment that is thought to have prevailed in classical elliptical galaxies, and resulted in a relative deficiency in Fe (e.g. Trager et al. 2000). Evidence that M32 is not as Fe-deficient as other spheroidal systems is also seen at optical wavelengths, as M32 falls along the upper envelope of the Fe5270 and Fe5335 versus Mg2 diagrams (e.g. Figure 2 of Worthey, Faber, & Gonzalez 1992). In the context of the various formation models discussed in §1, a solar neighborhood-like chemical mixture is consistent with models in which stars in M32 formed from gas and dust that had been in a chemically mature spiral galaxy, in agreement with the ‘threshed’ spiral model of Bekki et al. (2001). Models in which M32 is the end product of the stripping of a classical elliptical galaxy are ruled out.
5.2 NGC 4486B
NGC 4486B has almost certainly had a highly eventful past. The galaxy is located in the core of the Virgo cluster, and so has been subjected to tidal interactions. Faber et al. (1997) note that the central photometric properties of NGC 4486B are such that it could be the remnant of an elliptical galaxy that lost of its mass through stripping. In fact, the location of NGC 4486B on the (Na I, 12CO) diagram is consistent with the majority of its stars having formed from gas and dust that experienced rapid chemical enrichment, as is the case in large spheroidal systems. Still, that the NGC 4486B datapoints scatter about the solar neighborhood giant sequence on the (13CO,12CO) diagram suggests that the enrichment could not have been so rapid as to preclude enrichment from AGB stars. In any event, the chemical enrichment history of NGC 4486B differs from that of M32.
While large-scale stripping of stars could explain the relatively high black hole mass computed for NGC 4486B by Kormendy et al. (1997), such catastrophic interactions with another galaxy would affect the spatial distribution of stars, and might be expected to obliterate population gradients that were in place in the progenitor (e.g. White 1978). It then becomes difficult to explain why the radial variation in mean metallicity in NGC 4486B is typical of what is seen in classical ellipticals (SGC). The situation might be different if a large reservoir of gas were present during the proposed interactions that stripped material from the progenitor. In this case the tidal interactions might funnel gas to the center of the progenitor, where star formation would be triggered. If dissipation occurs then metallicity gradients might be set up amongst the newly formed stars. While large reservoirs of cool gas are in short supply near the center of the Virgo cluster at the present day, the old age of NGC 4486B suggests that the structural characteristics of the galaxy could have been defined early-on in the life of the cluster, at an epoch when cool gas was more plentiful.
Absorption line gradients, in the sense of weakening metallic features with increasing radius, are seen in the outer regions of NGC 4486B at visible wavelengths. However, neither the Na I nor the Ca I indices measured from the NIFS observations of NGC 4486B follow these trends. While there is a tendency for the 12CO(2,0) index to systematically weaken with increasing radius when arcsec, within a few tenths of an arcsec of the center of NGC 4486B the 12CO index, like the Ca I index, weakens with decreasing radius. What mechanism can explain such a radial behaviour in the near-infrared line indices?
The location of NGC 4486B on the H–[MgFe’] diagram and the analysis by SGCN indicates that a young population does not dominate this galaxy on arcsec scales, and so the Na I and indices in the outer regions of the NIFS data are probably not affected by age. However, SGB find that there is an age gradient in NGC 4486B with log(t)/log(r) . This is one of the steepest age gradients in the SGC sample, and opens the possibility that there could be an intermediate age population near the center of NGC 4486B.
The radial behaviour of two of the near-infrared indices support the notion that the central regions of NGC 4486B harbour intermediate age stars. First, the index is a potentially powerful age indicator in galaxies that are dominated by metal-rich stars, as there is no metallicity sensitivity (Silva et al. 2007). It is thus significant that this index shows a significant gradient in NGC 4486B, in the sense of getting stronger with decreasing radius. Second, the 12CO(2,0) index in the innermost regions of NGC 4486B are also smaller than at large radii, with an equivalent width that is similar to that near the center of M32. Models of simple stellar systems predict that the first overtone CO bands will grow in strength as a system ages when age exceeds 2 Gyr (e.g. Figure 11 of Vazquez et al. 2003).
Based on the presence of a steep age gradient inferred from spectra at visible wavelengths, and the radial behaviour of the and 12CO indices, we suggest that the nuclear regions of NGC 4486B contain an intermediate age population. This possibility can be tested using space-based observations, where high angular resolution observations can be obtained at visible and blue wavelengths. If a young or intermediate age population is present in the nuclear regions of NGC 4486B then such data should show deeper Balmer absorption lines than at large radii. The line indices measured by Sanchez-Blazquez et al. (2006a) indicate that H near the center of NGC 4486B should be higher than in the outer regions if the center of NGC 4486B harbours a population with an age like that in M32 (i.e. near Gyr). There is a high frequency of distinct nuclei in Virgo Cluster early-type galaxies (e.g. Cote et al. 2006), and the colors of some nuclei are suggestive of an intermediate age population. NGC 4486B may thus be yet another of these systems showing a distinct nuclear population.
The notion that age drives the gradients in the central regions of NGC 4486B is not wihout its problems. Indeed, Lauer et al. (1996) find that the color of NGC 4486B tends to become redder towards smaller radii, and this is contrary to what would be expected if there were a moderately bright population of blue main sequence turn-off stars near the center of the galaxy. Therefore, it is worth considering other mechanisms that might create spectroscopic gradients near the center of NGC 4486B.
Centrally-concentrated continuum emission can veil absorption features, and cause line index trends that are defined at large radii to break down near galaxy centers. An excellent example of this is seen in the spectrum of M87, where the strengths of absorption features decrease with decreasing radius near the galaxy center due to LINER continuum emission (e.g. Davidge 1992). However, the central regions of NGC 4486B are devoid of nuclear activity. The nuclear x-ray emission from NGC 4486B is a point source when imaged with Chandra (Soria et al. 2006b), and the x-ray spectrum is softer than that expected from AGN. The spatial extent of the x-ray emission is parsecs, and so there is probably little or no diffuse hot gas near the center of the galaxy. The visible spectra are free of emission lines, and there is no evidence of m H2 emission in the NIFS data, which is a prominent feature in AGN spectra.
The presence of a supermassive black hole will have an impact on population gradients in the inner regions of galaxies. Adopting a central black hole mass of M⊙ and a velocity dispersion of 116 km sec-1 (Kormendy et al. 1997) then the sphere of influence (van der Marel 1999) of the black hole in NGC 4486B has a radius parsecs, or arcsec. The gravitational field of the black hole dominates stellar motions within this radius, and any population gradients that date from the initial formation of the galaxy will be altered. This will occur on a timescale of only a few crossing times of the central regions, or years. The sphere of influence computed with this black hole mass is sufficiently large that some impact on the radial behaviour of line indices should have been seen in visible wavelength spectra recorded with arcsec resolution, and evidence for this has not been detected.
The size of the sphere of influence depends on the mass of the central black hole. Soria et al. (2006a) compute a black hole mass of only 5 M⊙ for NGC 4486B using an empirical relation between light profile shape and black hole mass, and note that other empirical relations predict similar masses. While the black hole mass estimated by Kormendy et al. (1997) would produce a sphere of influence with a radius that exceeds the region studied with NIFS, if the Soria et al. (2006a) mass estimate is adopted then the sphere of influence has a arcsec radius. This is comparable to the angular scale where a break is seen in the behaviour of the CO and Ca I indices in NGC 4486B, and where the structural properties of the galaxy are observed to change (Lauer et al. 1996). Still, a model in which the SMBH has altered population gradients in NGC 4486B is not without its problems. For example, it might be anticipated that the population trends defined at large radii would flatten – but not necessarily reverse – near the galaxy center.
5.3 NGC 5846A
The NGC 5846A and NGC 4486B datapoints occupy similar regions on the (Na I, 12CO), (Ca I, 12CO), and (13CO,12CO) diagrams, and this suggests that their chemical enrichment pedigrees – and hence formation timescales – were similar. In addition, while the purpose of this study is not to probe the kinematic properties of these galaxies, the central velocity dispersion measured in NGC 5846A is comparable to that in NGC 4486B. This suggests that the two galaxies may harbour central black holes with comparable masses.
SGC investigated the strengths of various absorption features in the visible spectrum of NGC 5846A, and found that metallic absorption features systematically weaken with increasing radius. Statistically significant gradients are seen at large radius in the Na I and Ca I indices measured from the NIFS spectrum of NGC 5846A. There is also weak, but not statistically significant, evidence for a radial gradient in the 12CO(2,0) index in the NIFS data. These results suggest that the gradients seen at larger radii extend into the central arcsec of NGC 5846A.
SGCN computed an old age for NGC 5846A. When coupled with the extremely old age measured for the dominant galaxy in the system – NGC 5846 – by Trager et al. (2000), then it appears that large quantities of cold gas have not been present in the NGC 5846 NGC 5846A system for a large fraction of the age of the Universe. Still, while the bulk of NGC 5846A has an old age, SGN measure an age gradient log(t)/log(r) , and so the central regions might harbour stars that are younger than those at large radii. The comparison in Figure 6 suggests that the radial distribution of stellar content in NGC 5846A is similar to that in NGC 4486B, where the near-infrared indices suggest that a central intermediate age population is present. As with NGC 4486B, it would be interesting to obtain high angular resolution spectra of NGC 5846A at visible wavelengths to search for evidence of a nuclear enhancement in Balmer absorption line strengths, although the larger distance of NGC 5846A will make it more challenging to detect a nucleated young population than in NGC 4486B.
References
- (1)
- (2) Bekki, K., Couch, W. J., Drinkwater, M. J., & Gregg, M. D. 2001, ApJ, 557, L39
- (3)
- (4) Bica, E., Alloin, D., & Schmidt, A. A. 1990, A&A, 228, 23
- (5)
- (6) Boccas, M. et al. 2006, Proc SPIE, 6272, 114
- (7)
- (8) Burkert, A. 1994, MNRAS, 266, 877
- (9)
- (10) Chilingarian, I., et al. 2005, A&A, 466, L21
- (11)
- (12) Choi, P. I., Guhathakurta, P., & Johnston, K. V. 2002, AJ, 124, 310
- (13)
- (14) Corbin, M. R., O’Neil, E., & Rieke, M. J. 2001, AJ, 121, 2549
- (15)
- (16) Cote, P., et al. 2006, ApJS, 165, 57
- (17)
- (18) Davidge, T. J. 1990, AJ, 99, 561
- (19)
- (20) Davidge, T. J. 1991, AJ, 102, 896
- (21)
- (22) Davidge, T. J. 1992, AJ, 103, 1512
- (23)
- (24) Davidge, T. J. 2000, PASP, 112, 1177
- (25)
- (26) Davidge, T. J., & Jensen, J. B. 2007, AJ, 133, 576
- (27)
- (28) Davies, R. D., Sadler, E. M., & Peletier, R. F. 1993, MNRAS, 262, 650
- (29)
- (30) del Burgo, C., Peletier, R. F., Vazdekis, A., Arribas, S., & Mediavilla, E. 2001, MNRAS, 321, 227
- (31)
- (32) de Vaucouleurs, G., de Vaucouleurs, A., Corwin, H. G. Jr., Buta, R. J., Paturel, G., & Fouque, P. 1991, The Third Reference Catalogue of Bright Galaxies, (University of Texas: Austin)
- (33)
- (34) Drinkwater, M. J., & Gregg, M. D. 1998, MNRAS, 296, L15
- (35)
- (36) Elston, R., & Silva, D. R. 1992, AJ, 104, 1360
- (37)
- (38) Faber, S. M. 1973, ApJ, 179, 423
- (39)
- (40) Faber, S. M. et al. 1997, AJ, 114, 1771
- (41)
- (42) Ferrarese, L., et al. 2006, ApJS, 164, 334
- (43)
- (44) Freedman, W. L. 1992, 104, 1349
- (45)
- (46) Frogel, J. A., Persson, S. E., Aaronson, M., & Matthews, K. 1978, ApJ, 220, 75
- (47)
- (48) Frogel, J. A., Stephens, A., Ramirez, S., & DePoy, D. L. 2001, AJ, 122, 1896
- (49)
- (50) Graham, A. W. 2002, ApJ, 568, L13
- (51)
- (52) Herriot, G. et al. 2000, Proc. SPIE, 4007, 115
- (53)
- (54) Iben, I. Jr., & Renzini, A. 1983, ARA&A, 21, 271
- (55)
- (56) Joseph, C. L. et al. 2001, ApJ, 550, 668
- (57)
- (58) King, I. 1962, AJ, 67, 471
- (59)
- (60) King, I. R., & Kiser, J. 1973, ApJ, 181, 27
- (61)
- (62) Kobayashi, C. 2004, MNRAS, 347, 740
- (63)
- (64) Kormendy, J. et al. 1997, ApJ, 482, L139
- (65)
- (66) Lauer, T. R. et al. 1996, ApJ, 471, L79
- (67)
- (68) Lauer, T. R., Faber, S. M., Ajhar, E. A., Grillmair, C. J., & Scowen, P. A. 1998, AJ, 116, 2263
- (69)
- (70) Magorrian, J. et al. 1998, AJ, 115, 2285
- (71)
- (72) Mahdavi, A., Trentham, N., & Tully, R. B. 2005, AJ, 130, 1502
- (73)
- (74) Maraston, C. 2005, MNRAS, 362, 799
- (75)
- (76) McGregor, P. J. et al. 2003, Proc. SPIE, 4841, 1581
- (77)
- (78) Mieske, S., et al. 2005, A&A, 430, L25
- (79)
- (80) Nieto, J-L, & Prugniel, P. 1987, A&A, 186, 30
- (81)
- (82) O’Connell, R. W. 1980, ApJ, 236, 430
- (83)
- (84) Peletier, R. F. 1993, A&A, 271, 51
- (85)
- (86) Ramirez, S. V., DePoy, D. L., Frogel, J. A., Sellgren, K., & Blum, R. D. 1997, AJ, 113, 1411
- (87)
- (88) Rood, H. J. 1965, AJ, 70, 689
- (89)
- (90) Rose, J. A. 1985, AJ, 90, 1927
- (91)
- (92) Rose, J. A., Arimoto, N., Caldwell, N., Schiavon, R. P., Vazdekis, A., & Yamada, Y. 2005, AJ, 129, 712
- (93)
- (94) Sanchez-Blazquez, P., Gorgas, J., & Cardiel, N. 2006, A&A, 457, 823 (SGC)
- (95)
- (96) Sanchez-Blazquez, P., Gorgas, J., Cardiel, N., & Gonzalez, J. J. 2006a, A&A, 457, 787
- (97)
- (98) Sanchez-Blazquez, P., Gorgas, J., Cardiel, N., & Gonzalez, J. J. 2006b, A&A, 457, 809 (SGCG)
- (99)
- (100) Silva, D. R., Kuntschner, H., & Lyubenova, M. 2007, ApJ, in press (astroph 07105529).
- (101)
- (102) Soria, R., et al. 2006a, ApJ, 640, 143
- (103)
- (104) Soria, R., et al. 2006b, ApJ, 640, 126
- (105)
- (106) Thomas, D., Maraston, C., & Bender, R. 2003, MNRAS, 343, 279
- (107)
- (108) Tonry, J., & Davis, M. 1979, AJ, 84, 1511
- (109)
- (110) Tonry, J. L., et al. 2001, ApJ, 546, 681
- (111)
- (112) Trager, S. C., Faber, S. M., Worthey, G., & Gonzalez, J. J. 2000, AJ, 119, 1645
- (113)
- (114) van der Marel, R. P. 1999, AJ, 117, 744
- (115)
- (116) van der Marel, R. P., Cretton, N., de Zeeuw, P. T., Rix, H-W 1998, ApJ, 493, 613
- (117)
- (118) Vazquez, G. A., Carigi, L., & Gonzalez, J. J. 2003, A&A, 400, 31
- (119)
- (120) White, S. D. M. 1978, MNRAS, 184, 185
- (121)
- (122) Wirth, A., & Gallagher, J. S. III 1984, ApJ, 282, 85
- (123)
- (124) Worthey, G. 2004, AJ, 128, 2826
- (125)
- (126) Worthey, G., Faber, S. M., & Gonzalez, J. J. 1992, ApJ, 398, 69
- (127)
- (128) Worthey, G., Faber, S. M., Gonzalez, J. J., & Burstein, D. 1994, ApJS, 94, 687
- (129)
- (130) Ziegler, B. L., & Bender, R. 1998, A&A, 330, 819
- (131)
| Galaxy | MK | r25 | ||
|---|---|---|---|---|
| (arcsec) | (km sec-1) | |||
| M32 | 24.55 | –19.5 | 261.3 | 140 |
| NGC 4486B | 31.03 | –20.9 | 18.1 | 330 |
| NGC 5846A | 31.98 | –22.1 | 13.1 | 310 |
| Star | Spectral Type | Standard Type |
|---|---|---|
| HR4973 | K1III | Spectroscopic |
| HR4801 | K5III | Spectroscopic |
| HR4884 | M0III | Spectroscopic |
| HD13869 | A0V | Telluric (M32) |
| HIP116449 | A0V | Telluric (M32) |
| FS-131 | F8 | Telluric (NGC 4486B) |
| HD129153 | F0V | Telluric (NGC 5846A) |
| HD145228 | F0V | Telluric (NGC 5846A) |
| Position | Wavelength Range |
|---|---|
| (Å) | |
| Continuum | 23408 – 23418 |
| 13CO(2,0) | 23418 – 23476 |
| Continuum | 23476 – 23486 |
| Spectral | CNaI | CCaI | C | C<FeI> |
|---|---|---|---|---|
| Type | ||||
| M0 III | 1.28 | 1.05 | 1.10 | 1.19 |
| K1 III | 1.34 | 1.10 | 1.12 | 1.27 |
| Index | NGC 4486B | NGC 5846A | M32 |
|---|---|---|---|
| Na I | |||
| () | () | () | |
| Ca I | |||
| () | () | () | |
| () | () | () | |
| 12CO(2,0) | |||
| () | () | () |