Density hardening plasticity and mechanical aging of silica glass
under pressure:
A Raman spectroscopic study
Abstract
In addition of a flow, plastic deformation of structural glasses (in particular amorphous silica) is characterized by a permanent densification. Raman spectroscopic estimators are shown to give a full account of the plastic behavior of silica under pressure. While the permanent densification of silica has been widely discussed in terms of amorphous-amorphous transition, from a plasticity point of view, the evolution of the residual densification with the maximum pressure of a pressure cycle can be discussed as a density hardening phenomenon. In the framework of such a mechanical aging effect, we propose that the glass structure could be labelled by the maximum pressure experienced by the glass and that the saturation of densification could be associated with the densest packing of tetrahedra only linked by their vertices.
I Introduction
The behavior of amorphous silica under high pressure has been intensively studied in the last decadesBridgman and Simon (1953); Cohen and Roy (1961); Mackenzie (1963); Polian and Grimsditch (1990); Meade et al. (1992); Inamura et al. (2001, 2004) and has recently motivated an increasing amount of numerical studiesJin et al. (1993, 1994); Valle and Venuti (1996); Lacks (1998, 2000); Rahmani et al. (2003); Dávila et al. (2003); Huang and Kieffer (2004a, b); Liang et al. (2007). Silica appears to be elastic up to around 10 GPa and to exhibit a plastic behavior at higher pressure. Two features can be emphasized at that level: i) in the elastic regime, the compressibility exhibits a surprising non monotonous evolution with a maximum at around 2-3 GPaBridgman and Simon (1953); Polian and Grimsditch (1993); Zha et al. (1994) ii) when unloading from the plastic regime a permanent densification up to 20 % can be observedBridgman and Simon (1953); Cohen and Roy (1961); Mackenzie (1963); Polian and Grimsditch (1990); Meade et al. (1992); Inamura et al. (2001, 2004). No clear evidence of alteration of the tetrahedral short range order in this unloaded state has been observedHemley et al. (1986); Meade et al. (1992).
Above 25 GPa, a change from 4-fold to 6-fold coordination is observedMeade et al. (1992). This 6-fold amorphous seems not to be quenchable at zero pressure. When unloading downto zero pressure, no trace of 6-fold coordination is obtained. Performing X-ray Raman scattering experiments on oxygen K-edge, Lin et al Lin et al. (2007) observed a reversible electronic bonding transition between 10 and 25 GPa. The latter was attributed to a fourfold quartz-like to a sixfold stishovitelike change of configuration of silica glass. For the densification process saturates and after unloading to ambient, the density level is the one obtained with a maximum pressure GPa Polian and Grimsditch (1993); Zha et al. (1994).
Questions remain about the nature of the densified phase and the mechanism of densification. Recent studiesLiang et al. (2007) have proposed the existence of an “activated” five-fold coordination at high pressure allowing reorganization toward a denser tetrahedral network. In former studies, in analogy with amorphous ice, LacksLacks (2000) has proposed a first order transition between 2 different tetrahedral amorphous phases of silica. This transition would be kinetically hindered at room temperature. This idea of poly-amorphism has received a lot of attention Saika-Voivod et al. (2001); Mukherjee et al. (2001); Shell et al. (2002); Dávila et al. (2003); Saika-Voivod et al. (2004); Inamura et al. (2004); Huang and Kieffer (2004a, b); Champagnon et al. (2007). At this stage it is important to separate the known transition at very HP between a 4-fold amorphous silica and a 6-fold amorphous silica involving a change in the short-range orderMeade et al. (1992); Jin et al. (1994) from an additional hypothetical transition at lower P between 2 different amorphous phases of tetrahedral silica and involving the medium range orderPoe et al. (2004).
The most recent numericalLiang et al. (2007) and experimentalInamura et al. (2004) works as well as the existence of a continuous range of densities for amorphous silicaInamura et al. (2001) after return to ambient pressure seem to rule out this idea of transition between 2 different forms of amorphous tetrahedral silica. However, the original observation of Lacks remains of interest: performing molecular dynamics simulations driven in volumeLacks (1998), he noted discontinuities in the pressure signal associated with local pressure induced mechanical instabilities. The latter are reminiscent of the shear induced mechanical instabilities previously identified in flowing liquidsMalandro and Lacks (1998). Note that similar localized transitions are widely believed to be the main mechanism of shear plasticity of amorphous materialsFalk and Langer (1998) and can be associated to the vanishing of one eigenvalue of the Hessian matrix of the interatomic potentialMaloney and Lemaître (2004, 2006).
In parallel to a structural study, it may be worth considering the pressure induced densification process in silica according to a mechanical perspective. In particular, in the Raman spectroscopic measurements to be presented below, we will use cycles of pressure of increasing maxima. This protocol will help us to discriminate in the spectral patterns, modifications due to the reversible elastic deformation of the network from other ones due to plastic structural reorganizations.
We first present the experimental methods i.e. Raman measurements of silica submitted to pressure cycles and analyze their results in terms of mechanical behavior. Two series of experiments are discussed. In series A Raman measurements are performed in situ during the loading and unloading stages of successive pressure cycles. In series B Raman measurements are performed ex situ at ambient pressure before and after pressure cycles of increasing maximum pressure.
The results of these spectroscopic measurements are presented in the next section and discussed in the framework of continuum plasticity. The first series of in situ experiments gives a nice illustration of (densification) plasticity in the context of a silica glass while the second series of experiments allows us to follow the evolution of permanent densification vs the pressure maximum of the cycle i.e. the density hardening behavior of silica.
We finally give a discussion, first in terms of mechanical behavior, then in terms of amorphous structure. These results are of primary importance in the description of the mechanical properties of silica. While silica is daily used as a calibration sample for nano-indentation measurements, it appears that the mechanical behavior of this material is not fully described. It has been shown recentlyPerriot et al. (2006) that the constitutive laws availableShorey et al. (1998); Xin and Lambropoulos (2000) which do not take hardening into account fail to fully describe the densification process induced by an indentation test. The above data can be used to include hardening in a simple constitutive law of silicaKermouche et al. (2008), which gives a precise account for this behavior.
Beyond their interest in terms of mechanical behavior, these results can also be discussed in terms of amorphous structure. In particular, as detailed below, densification can be regarded as a typical glassy phenomenon, resulting from a mechanical aging process. Following this perspective, the amorphous densified structure would be associated with the quench of the structure at high pressure and could be labelled by a fictive pressure in the very same acception as a fictive temperature can be used to label a structure obtained by thermal aging.
II Experimental Methods
Bars of amorphous silica (Saint-Gobain Quartz IDD) are shattered into pieces. Splinters of characteristic length of 10 m are submitted to cycles of pressure in a “Sidoine”Laboratoire de Physique des Milieux Condens s(Paris) Diamond Anvil Cell (DAC) with a maximum pressure in the range [1-25 GPa]. Raman spectra are collected with a Renishaw RM 1000 micro-spectrometer with a Ar+-ion 514 nm, 50 mW laser excitation). A small piece of ruby is introduced together with the silica splinter in order to monitor the pressure level using the shift of the R1-luminescence band.
Two series of experiments are presented.
-
•
In series A in situ measurements of the Raman spectrum are collected all along the compression cycle. Three cycles are presented, The first one with lies in the elastic domain, te third cycle consists of a compression up to followed by a decompression at 1 GPa, finally the last cycle consists of a compression up to and a direct return to ambient pressure induced by the breakdown of a diamond. Methanol is used as a pressure transmitting fluid in this series of experiments (quasi-hydrostatic conditions). A detailed presentation of these in situ experiments can be found in Champagnon et al. (2008).
-
•
In series B Raman measurements are performedex situ at ambient pressure before and after each cycle of pressure. A series of compression cycles is presented where the pressure maximum is increasing from 9 GPa for the first cycle to 25 GPa for the last cycle. In this case, the pressure transmitting fluid is a mix similar to 5:1 methanol-ethanol, which ensures hydrostaticity up to 16 to 20 GPa Besson and Pinceaux (1979). The Raman spectrum is measured before loading and after unloading, the diamond-anvil-cell being emptied of the transmitting fluid.
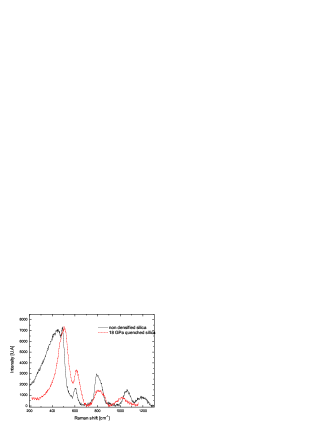
Figure 1 contrasts the initial spectrum of a sample (plain line) and that obtained after a 18 GPa hydrostatic loading (red line).
Between 200 and 750 cm-1 we can identify a main band at 440 cm-1. This band is intense, and affected by the densification process: the band gets narrower and is shifted to higher wave numbers. This band has originally been attributed to the symmetric stretching mode of bridging oxygens between two Si atoms and its evolution under densification to the decrease of the inter-tetrahedral angles Si-O-Si Mochizuki and Kawai (1972). Recent determinations of the Raman spectrum from first principlesUmari et al. (2003) have established that this broad band originates more likely from bending motions of oxygen atoms that do not belong to small rings.
The defect lines D1 and D2, at 492 and 605 cm-1, are respectively attributed to the breathing modes of the four-membered and three-membered rings Galeneer (1982); Pasquarello and Car (1998); Rahmani et al. (2003). Their area ratio was previously used in literature as an indicator for the variation of the “fictive temperature” Champagnon et al. (2000); Parc et al. (2001); Champagnon et al. (2002), which is associated with a slight change of density. The effect of pressure seems to be better accounted for by the shift of the D2 line. As discussed by Polsky et alPolsky et al. (1999), this may be due to pressure induced variations of the Raman cross section. The D2 line is of particular interest since it has almost no overlap with the main band. Sugiura et al. Sugiura et al. (1997) correlated the position of the D2 line with the ratio of the sample density to its initial density . The residual density evaluated through this relation accounts for both irreversible and elastic densification due to residual elastic strain. However, several works Hibino et al. (1985); Michalske et al. (1988); Sugiura et al. (1997) evidenced that the D2 line position is only marginally sensitive to residual elastic strains. This correlation was recently used to probe the densification gradient surrounding a plastic imprint in silica obtained by indentationPerriot et al. (2006).
III Results and interpretation
We describe in the following the experimental results and give an interpretation in the framework of the elasto-plastic response of continuous media.
III.1 Continuum mechanics
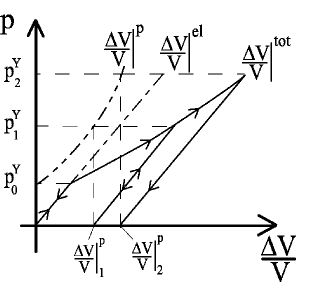
We first recall briefly the formalism of elasto-plasticity. Fig. 2 shows the hydrostatic stress as a function of the volumetric strain of a medium submitted to pressure. Below a threshold value of pressure the material remains fully elastic and the volumetric deformation is reversible. When increasing the pressure beyond threshold, plasticity sets in and an irreversible deformation adds up to the elastic reversible deformation. When unloading from , the material behaves elastically and only the elastic part of deformation is recovererd. Loading again to a higher pressure , we observe the same phenomenology with a crucial difference: the onset of plasticity has increased from to . In other words, the mechanical behavior depends on the history of mechanical loading. The material has experienced hardeningKhan and Huang (1995) which can be regarded as a mechanical aging. Such a behavior is standard for metal shear plasticity and usually results at the structural level from the entanglement or the pinning of dislocations by impuritiesCottrell (1956). Metals however do not exhibit any volumetric plastic deformation (dislocation motion is a volume conserving mechanism). However, irreversible changes of density are familiar in soil mechanics and granular materials (dilatancy effect)Jaeger et al. (1996).
The typical mechanical behavior of a material like silica glass can be summarized as follows. Before any loading, the material is elastic up to a threshold which depends both on pressure and shear. Using hydrostatic pressure and equivalent shear stress as coordinates, this elastic threshold corresponds to a continuous curve intersecting the two axis. When reaching threshold, if the stress is increased, plasticity sets in and the elastic limit is convected to the maximum value of stress experienced by the material. At macroscopic scale, one tries to characterize this hardening behavior, relating the evolution of densification with the pressure maximum. At microscopic scale, in the present case of silica, in absence of a microscopic mechanism as well defined as the motion of dislocation, a pending question remains to identify and understand a structural signature of density hardening.
III.2 Elasto-plastic behavior of silica under pressure
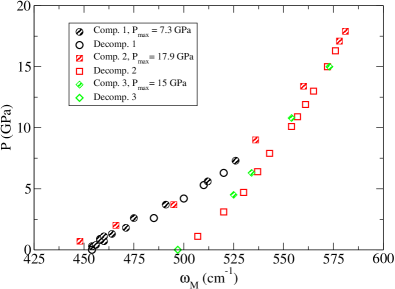
In this section we present the results of in situ raman measurements (series A). Two patterns of the Raman spectra measured in situ during the pressure cycles are discussed: i) the shift of the main band ; i) the shift of the line .
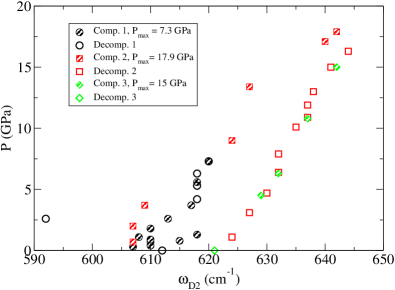
On Fig. 3 and 4 we show the evolution of the position of these two bands for a cycle of pressure up to (black symbols). We observe a full reversibility between loading and unloading. This result is consistent with the usual estimate for the onset of permanent densification in silica. The evolution of these indicators is also plotted on the same figures for the second series of cycles up to . We now see that below , the same elastic behavior as before is recovered; then a change of slope on loading is noticeable at least for the position of the main band; then the unloading curve does not reproduce the initial loading one and there appears a permanent change of the spectrum at ambient pressure; when loading again, one follows the very last unloading curve. These two curves appear to be very similar to the ideal case of hardening plasticity depicted in Fig. 2. This spectroscopic study allows us to closely follow the elastic-plastic behavior of silica under pressure.

We now discuss the evolution of permanent densification after cycles of increasing pressure. Even if the signal-to-noise ratio is less favorable for the determination of the D2 line than for the main band (see Fig. 3 vs Fig. 4), we choose the former to estimate the permanent densification. As discussed above, the main reason for this choice is that in contrast to the main band, the shift of the D2 line appears to be rather independent of the elastic stress. This allows us to use it a density probe in samples affected by residual elastic stress. Because of the microscopic size of the silica samples used in the diamond anvil cell, a quantitative calibration could not be performed. Densification can be obtained on millimetric samples but require high temperature treatmentsInamura et al. (2001) and it is far from being obvious that the medium range order is directly comparable to the one obtained under high pressure at ambient temperature. Following Ref. Perriot et al. (2006), the densification was estimated using the empirical relation:
| (1) |
which was extracted from the experimental data of Sugiura et al. Sugiura et al. (1997) obtained on shock wave experiments. This calibration step is thus only approximative.
The results are summarized on Fig. 5. We thus obtain the evolution of the permanent densification with the pressure maximum of each pressure cycle. We obtain a continuous range of increasing densities with an apparent saturation. As shown on Fig. 5, this evolution can be approached by a sigmoidal curve. Comparable results were obtained recently on window glass using an octahedral multi-anvil apparatusJi et al. (2006). In mechanical terms, this allows us to give a quantitative account of the density hardening behavior of silica. In the space of stresses, we have obtained the evolution of the maximum pressure below which the material remains fully elastic as a function of the glass density.
IV Discussion
Raman spectroscopic estimators have been shownn to give a full account of the density hardening behavior of silica under pressure. Raman scattering measurements during a loading/unloading pressure cycle closely reproduce the elastoplastic behavior usually observed in stress/strain curves: full reversibility below a limit stress, appearance of a residual deformation with an elastic unloading for larger stresses. A crucial difference obviously lies in the fact that in the present study the evolution of hydrostatic pressure vs density is considered instead of shear stress vs shear strain as in usual metal plasticity. From a mechanical point of view, the detailed analysis of the density increase with the maximum pressure of the cycle allowed us to study the evolution of the residual densification with the elastic limit pressure . Such a knowledge is of crucial importance for the determination of constitutive equation modelling the plastic behavior of silica. It was shown in Ref. Perriot et al. (2006) that when restricting the plastic criterion to perfect plasticity (i.e. assuming no hardening effect) it was not possible to account for the permanent densification of amorphous silica around a plastic imprint induced by indentation. Conversely, as shown in Ref. Kermouche et al. (2008) the assumption of an elliptic plastic criterion coupling shear stress and pressure together with the data of density hardening extracted from the present experiments allow to describe successfully this phenomenon of indentation induced densification.
From a physical/structural point of view, the present results suggest that the description of densified silica need not the hypothesis of an amorphous-amorphous transition between two types of tetrahedral networks. A simpler and alternative scenario consists of pressure induced reorganizations of the amorphous network allowing a more efficient packing of tetrahedra remaining linked by their vertices only. Such a scenario does not exclude the occurence of 5-fold or 6-fold coordinated silica in the plastic regime at high pressure. However, the latter would correspond to intermediate states between two amorphous tetrahedral structures. This occurrence of 5-fold or 6-fold coordination would thus simply denote the necessity of cutting and rebonding between the two structures. The denser structure would thus be quenched when pressure decreases down to ambient conditions. In that sense, the final structure could be labelled by the maximum pressure the material experienced. In this context of mechanical aging, the latter pressure could be thought of as a “fictive” pressure in the same acception as the fictive temperature in a more classical thermal aging experiment. Note that these denser structures may be affected by internal stresses due to the succession of localized reorganizations. More generally, these results indicate that the structure and the density of a densified sample of vitreous silica will depend crucially on the particular path it has followed in the plane pressure/temperature : it is likely that the medium range sructure of densified silica is not fully characterized by the only density parameter.
Looking finally at orders of magnitude for the density of the various phases of silica, we observe that the density of the stable crystalline equivalent at zero pressure (quartz) is 2.65 while the density of the metastable coesite (stable at 2-3 GPa) is 3.01. The density of fused silica being 2.2, a 20% increase gives 2.64 i.e values close to quartz but well below coesite. In analogy with hexagonal and random close packing, an interesting question could thus be whether the maximum observed density of amorphous silica corresponds to any geometrical maximal packing of tetrahedra bonded by their vertices only i.e. the maximum density of the continuous random network. To our knowledge, though the packing of space by tetrahedra, or ellipsoids has been consideredBinder and Kob (2005); Donev et al. (2004), this question has not been discussed yet.
V Acknowledgments
The authors acknowledge useful discussions with G. Kermouche, W. Kob and S. Ispas-Crouzet. They would like to thank CECOMO and High Pressure facilities of University Lyon1. This work has been supported by the ANR "plastiglass" contract no ANR-05-BLAN-0367-01.
References
- Bridgman and Simon (1953) P. W. Bridgman and I. Simon, J. Appl. Phys 24, 405 (1953).
- Cohen and Roy (1961) H. M. Cohen and R. Roy, J. Am. Ceram. Soc. 44, 523 (1961).
- Mackenzie (1963) J. D. Mackenzie, J. Am. Ceram. Soc. 46, 461 (1963).
- Polian and Grimsditch (1990) A. Polian and M. Grimsditch, Phys. Rev. B 41, 6086 (1990).
- Meade et al. (1992) C. Meade, R. J. Hemley, and H. K. Mao, Phys. Rev. Lett. 69, 1387 (1992).
- Inamura et al. (2001) Y. Inamura, M. Arai, M. Nakamura, T. Otomo, N. Kitamura, S. M. Bennington, A. C. Hannon, and U. Buchenau, J. Non-Cryst. Solids 293-295, 389 (2001).
- Inamura et al. (2004) Y. Inamura, Y. Katayama, W. Utsumi, and K. I. Funakoshi, Phys. Rev. Lett. 93, 015501 (2004).
- Jin et al. (1993) W. Jin, R. K. Kalia, P. Vashishta, and J. P. Rino, Phys. Rev. Lett. 71, 3146 (1993).
- Jin et al. (1994) W. Jin, R. K. Kalia, P. Vashishta, and J. P. Rino, Phys. Rev. B 50, 118 (1994).
- Valle and Venuti (1996) R. G. D. Valle and E. Venuti, Phys. Rev. B 54, 3809 (1996).
- Lacks (1998) D. J. Lacks, Phys. Rev. Lett. 80, 5385 (1998).
- Lacks (2000) D. J. Lacks, Phys. Rev. Lett. 84, 4629 (2000).
- Rahmani et al. (2003) A. Rahmani, M. Benoit, and C. Benoit, Phys. Rev. B 68, 184202 (2003).
- Dávila et al. (2003) L. P. Dávila, M. J. Caturla, A. Kubota, B. Sadigh, T. D. de la Rubia, J. F. Shackelford, S. H. Risbud, and S. H. Garofalini, Phys. Rev. Lett. 91, 205501 (2003).
- Huang and Kieffer (2004a) L. Huang and J. Kieffer, Phys. Rev. B 69, 224203 (2004a).
- Huang and Kieffer (2004b) L. Huang and J. Kieffer, Phys. Rev. B 69, 224204 (2004b).
- Liang et al. (2007) Y. Liang, C. R. Miranda, and S. Scandolo, Phys. Rev. B 75, 024205 (2007).
- Polian and Grimsditch (1993) A. Polian and M. Grimsditch, Phys. Rev. B 47, 13979 (1993).
- Zha et al. (1994) C. S. Zha, R. J. Hemley, H. K. Mao, T. S. Duffy, and C. Meade, Phys. Rev. B 50, 13105 (1994).
- Hemley et al. (1986) R. J. Hemley, H. K. Mao, P. M. Bell, and B. O. Mysen, Phys. Rev. B 57, 747 (1986).
- Lin et al. (2007) J.-F. Lin, H. Fukui, D. Prendergast, T. Okuchi, Y. Q. Cai, N. Hiraoka, C.-S. Yoo, A. Trave, P. Eng, M. Y. Hu, et al., Phys. Rev. B 75, 012201 (2007).
- Saika-Voivod et al. (2001) I. Saika-Voivod, F. Sciortino, and P. H. Poole, Nature 41, 514 (2001).
- Mukherjee et al. (2001) G. D. Mukherjee, S. N. Vaidya, and V. Sugandhi, Phys. Rev. Lett. 87, 195501 (2001).
- Shell et al. (2002) M. S. Shell, P. G. Debenedetti, and A. Z. Panagiotopoulos, Phys. Rev. E 66, 011202 (2002).
- Saika-Voivod et al. (2004) I. Saika-Voivod, F. Sciortino, T. Grande, and P. H. Poole, Phys. Rev. E 70, 061507 (2004).
- Champagnon et al. (2007) B. Champagnon, C. Martinet, C. Coussa, and T. Deschamps, J. Non-Cryst Solids 353, 4208 (2007).
- Poe et al. (2004) B. T. Poe, C. Romano, and G. Henderson, J. Non-Cryst. Solids 341, 162 (2004).
- Malandro and Lacks (1998) D. L. Malandro and D. J. Lacks, Phys. Rev. Lett. 81, 5576 (1998).
- Falk and Langer (1998) M. L. Falk and J. S. Langer, Phys. Rev. E 57, 7192 (1998).
- Maloney and Lemaître (2004) C. E. Maloney and A. Lemaître, Phys. Rev. Lett. 93, 195501 (2004).
- Maloney and Lemaître (2006) C. E. Maloney and A. Lemaître, Phys. Rev. E 74, 016118 (2006).
- Perriot et al. (2006) A. Perriot, V. Martinez, C. Martinet, B. Champagnon, D. Vandembroucq, and E. Barthel, J. Am. Ceram. Soc. 89, 596 (2006).
- Shorey et al. (1998) A. Shorey, K. Xin, K. Chen, and J. Lambropoulos, Proc SPIE 3424, 72 (1998).
- Xin and Lambropoulos (2000) K. Xin and J. Lambropoulos, Proc. SPIE 4102, 112 (2000).
- Kermouche et al. (2008) G. Kermouche, E. Barthel, D. Vandembroucq, and P. Dubujet, Acta Mat. 56, 3222 (2008).
- Champagnon et al. (2008) B. Champagnon, C. Martinet, M. Boudeulle, D. Vouagner, C. Coussa, T. Deschamps, and L. Grosvalet, J. Non-Cryst Solids 354, 569 (2008).
- Besson and Pinceaux (1979) J. Besson and P. Pinceaux, Rev. Sci. Instrum. 50, 541 (1979).
- Mochizuki and Kawai (1972) S. Mochizuki and N. Kawai, Solid State Communications 11, 763 (1972).
- Umari et al. (2003) P. Umari, X. Gonze, and A. Pasquarello, Phys. Rev. Lett. 90, 027401 (2003).
- Galeneer (1982) F. L. Galeneer, Solid State Communications 44, 1037 (1982).
- Pasquarello and Car (1998) A. Pasquarello and R. Car, Phys. Rev. Lett. 80, 5145 (1998).
- Champagnon et al. (2000) B. Champagnon, C. Chemarin, E. Duval, and R. L. Parc, J. Non-Cryst. Solids 274, 81 (2000).
- Parc et al. (2001) R. L. Parc, B. Champagnon, P. Guenot, and S. Dubois, J. Non-Cryst. Solids 293-295, 367 (2001).
- Champagnon et al. (2002) B. Champagnon, R. L. Parc, and P. Guenot, Phil. Mag. B 82, 251 (2002).
- Polsky et al. (1999) C. H. Polsky, K. H. Smith, and G. H. Wolf, J. Non-Cryst. Solids 248, 159 (1999).
- Sugiura et al. (1997) H. Sugiura, R. Ikeda, K. Kondo, and T. Yamadaya, J. Appl. Phys. 81, 1651 (1997).
- Hibino et al. (1985) Y. Hibino, H. Hanafusa, K. Ema, and S.-I. Hyodo, Appl. Phys. Lett. (1985).
- Michalske et al. (1988) T. A. Michalske, D. Tallant, and W. L. Smith, Phys. Chem. Glasses 29, 150 (1988).
- Khan and Huang (1995) A. Khan and S. Huang, Continuum theory of plasticity (Wiley, New-York, 1995).
- Cottrell (1956) A. H. Cottrell, Dislocations and plastic flow in crystals (Oxford Univ. Press, Oxford, 1956).
- Jaeger et al. (1996) H. M. Jaeger, S. Nagel, and R. P. Behringer, Rev. Mod. Phys. 68, 1259 (1996).
- Ji et al. (2006) H. Ji, V. Keryvin, T. Rouxel, and T. Hammouda, Scripta Mat. 55, 1159 (2006).
- Binder and Kob (2005) K. Binder and W. Kob, Glassy materials and disordered solids (World Scientific, Singapore, 2005).
- Donev et al. (2004) A. Donev, F. H. Stillinger, P. M. Chaikin, and S. Torquato, Phys. Rev. Lett. 92, 255506 (2004).