, ,
From particles to spins: Eulerian formulation of supercooled liquids and glasses
Abstract
The dynamics of supercooled liquid and glassy systems are usually studied within the Lagrangian representation, in which the positions and velocities of distinguishable interacting particles are followed. Within this representation, however, it is difficult to define measures of spatial heterogeneities in the dynamics, as particles move in and out of any one given region within long enough times. It is also non-transparent how to make connections between the structural glass and the spin glass problems within the Lagrangian formulation. We propose an Eulerian formulation of supercooled liquids and glasses that allows for a simple connection between particle and spin systems, and that permits the study of dynamical heterogeneities within a fixed frame of reference similar to the one used for spin glasses. We apply this framework to the study of the dynamics of colloidal particle suspensions for packing fractions corresponding to the supercooled and glassy regimes, which are probed via confocal microscopy.
I Introduction
The phenomenology of structural and spin glasses has much in common: no static long-range order, aging relaxation, heterogeneous dynamics, etc Cu . While a precise and unambiguous connection between these two problems still lacks, the possibility that such relation exists dates back to the work by Kirkpatrick, Thirumalai and Wolynes KTW1 ; KTW2 ; KTW3 , who proposed a connection between structural glasses and the p-spin disordered model. More recently, Tarzia and Moore Tarzia-Moore have paralleled the phenomenology of structural glasses to that of an Edwards-Anderson model in a uniform magnetic field. One of the main hurdles in making a direct real space connection between these two problems is that spin glass models are defined on a lattice, while the particles comprising structural glasses are itinerant.
Supercooled liquids and glasses are usually described within the Lagrangian formulation, where one tracks the position of individual particles as a function of time. Natural quantities computed within this frame of reference are mean-square displacement and self-diffusion of these particles. Heterogeneous dynamics can be probed, for example, by studying quantities such as mobility within prescribed boxes; however, such fixed regions serve this purpose just for a certain time, as particles move in and out of these boxes if one waits for long enough. In contrast, studying local dynamics in a spin glass presents no such complication, as spins remain fixed to their sites at all times, and all that changes is the spin orientation as function of time. Therefore, if one is to construct a simple description of particle systems that could actually be used in analyzing real experimental data from the point of view of a spin glass, one must abandon the Lagrangian formulation.
We propose an Eulerian analysis of the dynamics of interacting particle systems. The proposal consists in transforming the data of numerical simulations or confocal microscopy experiments, usually presented in the Lagrangian representation as time-dependent positions and velocities of distinguishable particles Weeks ; Cicowe ; Wecrwe ; Makse , into time-dependent occupation numbers of finite volume pixels at fixed positions in space. In this way, we divide the simulation or experimental fixed volume box containing the particles into pixels located at sites labeled by , and assign a ‘spin’, , depending on whether a ‘piece’ of the particle falls within the pixel or not. The data treatment here proposed allows one to make close contact with spin (disordered or constrained) models.
II Method
We divide the experimental box in cubic pixels of linear size where is the radius of the particles and is a parameter, typically with . The number of pixels is then with the total volume of the experimental box (we focus throughout the paper on the case relevant to the experiments analyzed below). The simplest definition of the spin variable is such that whenever a particle (independently of which one it is) overlaps the -th pixel, and otherwise. With such a definition, though, the magnetization density is non-zero, , at a generic volume fraction . To work at zero magnetization density and make closer contact with usual spin (glass) problems, we shrink the particle size to an effective radius such that the covered volume is foot .
An efficient algorithm that maps particle positions into spin variables works as follows. First, one constructs the grid of pixels and sets all spins to for all . Next, one reads the particle centers from the data file and sets to the spin variables of the pixels around the center of each particle. One thus avoids having to go over all sites in the lattice and to compute distances between particle centers. This procedure is repeated at each time step.
The data set has now been transformed into spin values and all interesting correlation functions in the spin realization inform us about the dynamics of the particle system. The spin variable is naturally related to an occupation number, by , and then to a density. We stress here that, in this construction, these densities are not coarse grained quantities built by looking at distances larger than the particle size, but instead the other way around, by looking at distances of the order and below the particle size. Within this construction, the parallel with the spin-glass problem is also clear: a short-ranged equal-time spin-spin correlation function corresponds to a short-ranged particle density order, etc.
III Analysis
We apply this framework to experimental data from colloidal suspensions, both in the supercooled liquid regime Weeks ; Wecrwe and in the dense glassy phase Cicowe . The suspensions are of colloidal poly-methylmethacrylate (PMMA) with radius m (and a polydispersity of ), suspended in a mixture of decalin and either cycloheptylbromide (for the samples with ) or cyclohexylbromide (for the sample with ). These solvent mixtures match the index of refraction of the particles to aid in visualization. Furthermore, the solvent mixtures also match the particle density, so that sedimentation does not occur during the experiments. In these solvents, the particles are slightly charged, modifying their pair correlation function somewhat from that of hard spheres, although they still undergo the glass transition at . The particles in dilute samples diffuse their own diameter in , although in these concentrated samples their motion is much slower Weeks . All samples are stirred prior to data acquisition. The two samples with are stirred to break up any crystals, and data acquisition is started after transient flows have diminished ( min). For the sample with , no crystals are present prior to stirring; instead, stirring initiates aging in the sample, and data acquisition begins immediately after the stirring is ended, setting the initial time Cicowe .
Data is obtained via confocal microscopy Prasad , which is used to rapidly obtain a three-dimensional image of dimensions approximately m3. Within each image, particle positions are obtained with an accuracy of 30 nm in and , and nm in (along the optical axis of the microscope). For other experimental details, see Refs. Weeks ; Cicowe .
We choose and thus mm. The positions of the particles were recorded every for the supercooled data sets at and , and for the glassy data set at . For the effective radii we find: m at , m at and m at .
We now show how to characterize the dynamics of the colloidal system of particles using solely the mapped spin variables. We start by defining two-spin correlations
| (1) |
which can be used to determine both equal-time spatial correlations and same-site two-time correlations.
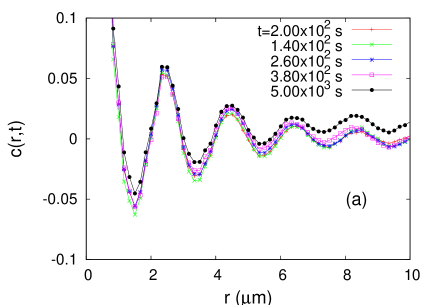
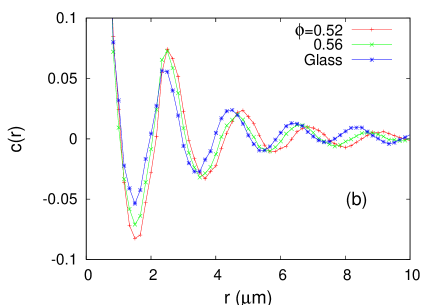
In Fig. 1 we present the equal-time correlation function between two spins at a distance , , which is analogous to the pair correlation function convolved with a square hat function of width . Due to the finite size of the sample one expects time-dependent fluctuations. In the supercooled liquid regime these are present but no systematic trend is visible (not shown). The time-dependence in the glass is shown in panel (a) where the pair correlation function as a function of , computed at equally spaced times, is displayed. The curves show no systematic time-dependence until . A clear departure is seen at later times when the pair correlation no longer decays to zero. The saturation at long-distances is not related to crystallization since Cianci et al found no increase in crystalline order as the sample aged Cicowe . We do not know the exact reason for this saturation. In what follows we just analyze glass data for times that are shorter than .
The time averages of the equal-time correlation function, , are shown in panel (b) of Fig. 1 for the three packing fractions. These are calculated using times equally spaced over an interval of approximately in the supercooled liquid and 8 times before in the glass. Notice that the peaks move slightly to lower values of for increasing values of , but there in no qualitative difference in this one-time quantity for these three packing ratios. These curves are essentially the same as the ones shown in Wecrwe for the supercooled liquid and in Cicowe for the glass, computed using directly the particle positions.
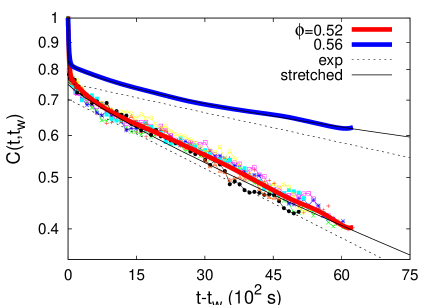
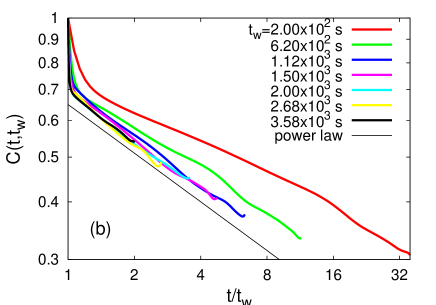
We now turn to two-time quantities, starting from the global equal-space two-spin correlation . In Fig. 2 we present its decay, as a function of for the supercooled liquid regime. The group of curves that fall below are for . The curves drawn with thin lines represent data for several waiting-times and, within the numerical error, they have the same decay, proving that the dynamics are stationary. The thick (red) line is the average over all waiting-times. The thick (blue) curve lying above is the averaged data for . The spreading for different waiting-times (not shown) is similar to the one for . In both cases decays from to in less than (the minimum time step for which data is recorded), due to Brownian motion of the particles within their cages Wecrwe . The dotted black lines are exponential fits, , to the decay for that have been translated to make the curve visible. The solid black line is a fit of the data for to a stretched exponential, , fit to the averaged curves. In Table 1 we give the values of the fitting parameters for both densities although in Fig. 2 we show only the stretched exponential for the higher packing fraction.
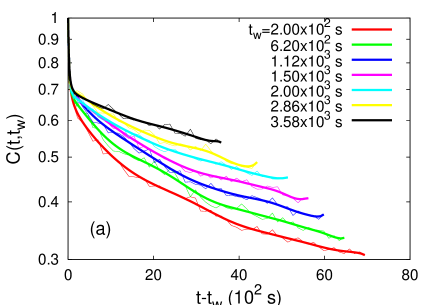
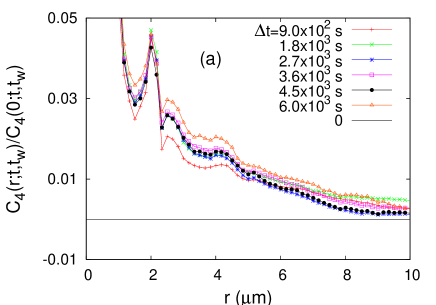
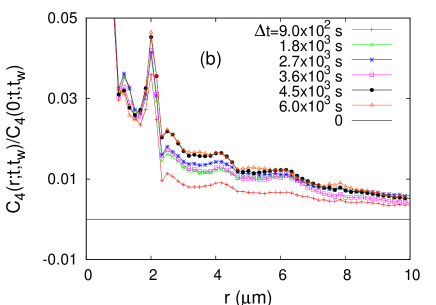
Figure 3 shows the two-time correlation function in the aging regime. Panel (a) displays the relaxation after several waiting-times. As in the supercooled liquid regime, the correlation decays from to rapidly and then further decays to zero in a much slower manner. In a double logarithmic scale the separation between the stationary () and aging () regimes is seen as a plateau at the Edwards-Anderson value . Panel (b) demonstrates that the aging data can be satisfactorily scaled using the ‘simple’ aging form with for waiting-times that are longer than . However, the range of variation of both axis is smaller than a decade and it is hard to give a concrete conclusion on ‘simple’ aging in this sense. Still, it is interesting to note that this behavior is remarkably similar to the one found with Monte Carlo simulations of the Edwards-Anderson (EA) spin-glass 3dEA .
A two-time dependent correlation length Cachcuigke ; Chcu can be extracted from the spatial decay of a two space points and two-times correlation function:
| (2) |
or a variation in which we extract the square of the two-time local correlation that is the expected large distance limit of eq. (2):
| (3) |
These definitions are simple extension of the ones used in the analysis of the stationary supercooled liquid Four-point ; Four-point-MCT .
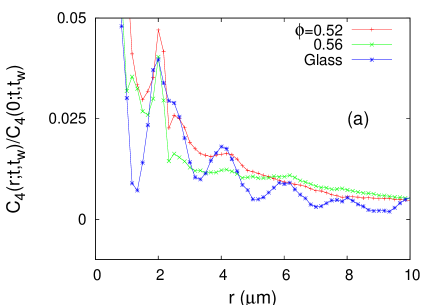
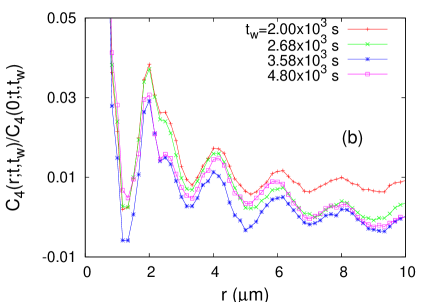
Figure 4 displays the four-point correlation function for several time-delays in the supercooled liquid phase. In Fig. 5 we show the space-dependence of the four-point correlation function for a fixed time-delay, for the supercooled liquid and for the glass. The supercooled liquid curves have been averaged over the waiting-time taking advantage of stationarity. The glassy curve has been smoothed by averaging over two time-windows of length centered at and .
The correlation length can be evaluated using
| (4) |
in the limit . This analysis, applied to the data in Fig. 5, yields a correlation length of the order of . This can be confirmed by simple visual inspection since all curves decay close to zero at distances m. These values are of the same order as the ones found in previous studies Wecrwe .
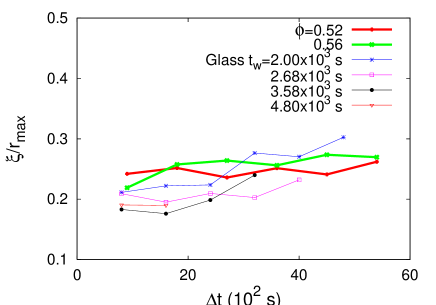
In order to capture the time-dependence of we use, instead, a finite value of , m. The reason is that we do not have enough precision at to disentangle the curves measured at different times. We thus obtain slightly shorter values of that have, though, a systematic temporal trend. Figure 6 shows these results. The supercooled liquid curves follow the expected trend: the sample with a higher packing fraction ( with thick green line) has a longer correlation length than the one with the lower packing fraction ( with thick red line). In both cases the length smoothly increases in time. We then compare these results to the measurements in the glass at different waiting-times (thin lines in the same figure). All curves grow as a function of time-difference. At short time-differences the curves with shorter waiting-time have a longer correlation length while the trend reverses at longer time-differences. In the glass the growth with time-difference is faster than in the supercooled liquid and one expects the longer waiting-time curves to go beyond the supercooled liquid ones at longer time-differences (not reached in the experiment). The reason why the correlation lengths in the glass are shorter than the ones in the supercooled liquid at the available times is that the glass is still far out of equilibrium and correlations have not propagated far in the sample yet.
The two-time dependence in the glassy regime is similar to the one found in the EA spin-glass 3dEA , the Lennard-Jones mixture Castillo , and the random field Ising coarsening system 3dRFIM . In the latter case the origin of the two-time dependence of the growing length can be traced back to the one-time dependence of the averaged radius of the growing domains of two competing equilibrium states. In the structural and spin glass cases, the two-time dependence of does not have such a clear simple origin, and it is less well understood.
We now turn to the study of local correlations, which are probes of local heterogeneities in the dynamics. The particles in the colloidal system do not displace all at the same rate: some regions can reconfigure much faster than others, for the same elapsed time between frames. A broad distribution characterising these heterogeneities can be captured, in the mapped spin system, by using a local two-time spin-spin correlation averaged over a cell of size centered at site :
| (5) |
Whenever the cell size is much larger than the dynamical correlation length , the local correlations just reflect the global value . Instead, whenever the coarse graining box is smaller than , the local values are non-uniform. This fact is captured by a broad probability distribution function (PDF) of the local correlations at fixed times and .
A simple scaling hypothesis discussed in 3dEA ; Chcu implies
| (6) |
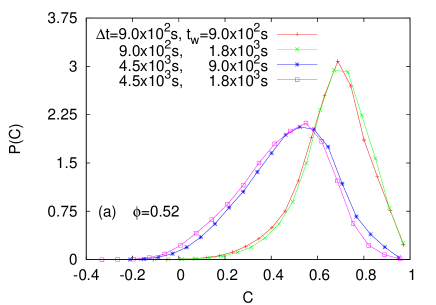
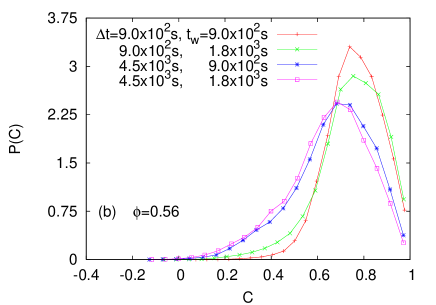
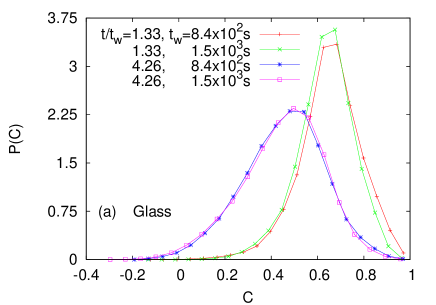
with and the values of the global correlation and correlation length at the measuring times and , and the size the of the sample that is much longer than the coarse graining length. We kept an explicit dependence on the control parameter in the system, that is to say, the packing fraction . This form is obtained by exchanging the dependence on times and by a dependence on the two-time dependence quantities and (exploiting their monotonicity properties) and then assuming that the three lengths , and can only appear through the ratios and . Since the time-variation of the correlation length is very slow, as a first approximation one can neglect the scaling variable and simply check the scaling form Cachcuigke . In Fig. 7 we test this scaling form using a coarse graining box . The PDFs are shown for different values of the waiting time for the two supercooled systems at (a) and (b), and for the glass with (c). The PDFs collapse for fixed time difference in the case of the supercooled samples, and for fixed ratio in the case of the glass, reflecting that time-translation invariance is manifest in the supercooled liquid regime, but broken in the glass, which ages. (In the case of Fig. 7(b) the bad collapse for may be attributed to lack of equilibration at this high packing fraction: fluctuations may be more sensible than average values in detecting a remanent time-variation. Another explanation would be that the sample we are using is too much heterogeneous and not fully representative of equilibration at this packing fraction.) As expected the PDFs get wider for longer time-differences or larger value of .
Remarkably, once the PDFs have been scaled, the scaling function of the sample with low packing fraction is very similar to the one of the glass. It is worth noting here that the average correlations in the loose supercooled liquid and the glass are very similar: . The averaged two-time correlation in the dense supercooled liquid () remains, during the available time-window, too high to be compared with the other two cases. The similarity between the PDFs for and suggests that a ‘universal’ PDF connecting the fluctuations for different packing fractions through a proper rescaling of times might exist. We plan to explore this hypothesis using molecular dynamics of Lennard-Jones mixtures.
IV Conclusions
In short, we introduced a simple method to translate particle data position into fixed frame spin variables. We computed correlation functions and extracted a correlation length from confocal microscopy data of supercooled and glassy samples and we found remarkably similar results to the ones obtained with numerical simulations of spin models.
One advantage of our analysis method is that it does not rely on tracking individual particles over time. Instead, it acts on the particle locations at each time, without regard to their identity. Thus, this method will be useful in situations where particles move too rapidly to be tracked, but which are still able to be visualized by microscopy in quickly obtained images.
Acknowledgements.
LFC thanks the Universidad Nacional de Mar del Plata, Argentina, and Boston University, and CC, GF and JLI thank the Laboratoire de Physique Théorique et Hautes Energies, Jussieu, France, for hospitality during the preparation of this work. The work of CC was supported by the National Science Foundation under Grant No. DMR-0403997. The work of ERW was supported by the National Science Foundation under Grant No. DMR-0239109. LFC is a member of Institut Universitaire de France. LFC, GF, and JLI acknowledge financial support from PICS 3172, PIP 5648 and PICT 20075.References
- (1) For reviews see, e.g., Cugliandolo LF (2003) Dynamics of glassy systems in Slow relaxation and non equilibrium dynamics in condensed matter, Les Houches Session 77 (Springer-Verlag, Berlin) J-L Barrat et al. eds. arXiv:cond-mat/0210312. K. Binder and W. Kob (2005) Glassy materials and disordered solids: an introduction to their statistical mechanics (World Scientific, Singapore).
- (2) Kirkpatrick TR and Thirumalai D (1987) -spin-interaction spin-glass models: Connections with the structural glass problem. Phys. Rev. B 36: 5388-5397. Kirkpatrick TR and Thirumalai D (1988) Comparison between dynamical theories and metastable states in regular and glassy mean-field spin models with underlying first-order-like phase transitions. Phys. Rev. A 37: 4439-4448. Kirkpatrick TR and Thirumalai D (1988) Mean-field Potts glass model: Initial-condition effects on dynamics and properties of metastable states. Phys. Rev. B 38: 4881-4892.
- (3) Kirkpatrick TR and Wolynes P (1987) Connections between some kinetic and equilibrium theories of the glass transition. Phys. Rev. A 35: 3072-3080. Kirkpatrick TR and Wolynes P (1987) Stable and metastable states in mean-field Potts and structural glasses. Phys. Rev. B 36: 8552-8564.
- (4) Kirkpatrick TR, Thirumalai D, and Wolynes P (1989) Scaling concepts for the dynamics of viscous liquids near an ideal glassy state. Phys. Rev. A 40: 1045-1054.
- (5) Tarzia M and Moore MA (2007) Glass phenomenology from the connection to spin glasses. Phys. Rev. E 75: 031502.
- (6) Weeks ER, Crocker JC, Levitt AC, Schofield A, and Weitz DA (2000) three-dimensional direct imaging of structural relaxation near the colloidal glass transition. Science 287: 627-631.
- (7) Weeks ER, Crocker JC, and Weitz DA (2007) Short and long range correlated motion observed in colloidal glasses and liquids. J. Phys. C: Condens. Matter 19: 205131-205142.
- (8) Cianci GC, Courtland RE, and Weeks ER (2006) Correlations of structure and dynamics in an aging colloidal glass. Solid State Comm. 139: 599-604.
- (9) Wang P, Song C, and Makse HA (2006) Dynamic particle tracking reveals the aging temperature of a colloidal glass. Nature Physics 2: 526-531.
- (10) Alternatively, one may work with fixed magnetization and subtract this constant level from the spin variables. We choose to work with the symmetric representation via the effective radius so as to remain as close as possible to a spin glass problem with zero magnetization, and thus make the analogies and comparisons between the particle and spin systems easier and clearer.
- (11) Prasad V, Semwogerere D, and Weeks ER (2007) Confocal microscopy of colloids. J. Phys.: Condens. Matter 19: 113102-113126.
- (12) Jaubert LDC, Chamon C, Cugliandolo LF and Picco M Growing dynamical length, scaling and heterogeneities in the Edwards-Anderson model. J. Stat. Mech. (2007) P05001.
- (13) Castillo HE, Chamon C, Cugliandolo LF, Iguain JL and Kennett MP (2003) Spatially heterogeneous ages in glassy systems. Phys. Rev. B 68: 134442-13482.
- (14) Chamon C and Cugliandolo LF, Fluctuations in glassy systems. J. Stat. Mech. (2007) P07022.
- (15) Kob W, Donati C, Plimpton SJ, Poole PH, and Glotzer SC (1997) Dynamical heterogeneities in a supercooled Lennard-Jones liquid. Phys. Rev. Lett. 79: 2827-2830. Donati C, Douglas JF, Kob W, Plimpton SJ, Poole PH, and Glotzer SC Stringlike cooperative motion in a supercooled liquid. Phys. Rev. Lett. 80: 2338-2341.
- (16) Franz S and Parisi G (2000) On non-linear susceptibility in supercooled liquids. J. Phys. C: Condens. Matter 12: 6335-6342. Donati C, Franz S, Parisi G, and Glotzer SC, (2002) Theory of non-linear susceptibility and correlation length in glasses and liquids. J. Non-Cryst. Solids 307: 215-224. Biroli G and Bouchaud J-P (2004) Europhys. Lett. 67: 21-27.
- (17) Parisi G (1999) An increasing correlation length in off-equilibrium glasses J. Phys. Chem. B 103: 4128-4131. Parsaeian A and Castillo HE, Growth of spatial correlations in the aging of a simple structural glass, arXiv:cond-mat/0610789.
- (18) Aron C, Chamon C, Cugliandolo LF and Picco M, in preparation.
- (19) Castillo HE and Parsaeian A (2007) Local fluctuations in the ageing of a simple structural glass Nature Physics 3: 26-28.