The old open cluster NGC 2112: updated estimates of fundamental parameters based on a membership analysis††thanks: This paper includes data gathered with the 6.5 Magellan Telescopes, located at Las Campanas Observatory, Chile ††thanks: The data discussed in this paper will be made available at the WEBDA open cluster database http://www.univie.ac.at/webda, which is maintained by E. Paunzen and J.-C. Mermilliod
Abstract
We report on a new, wide field (),
multicolor (), photometric campaign
in the area of the nearby old open cluster NGC 2112. At the
same time, we provide medium-resolution spectroscopy of 35 (and high-resolution of additional 5)
Red Giant and Turn Off stars. This material is analyzed with the
aim to update the fundamental parameters of this traditionally
difficult cluster,
which is very sparse and suffers from heavy field star contamination.
Among the 40 stars with spectra, we identified 21 bona fide
radial velocity members which allow us to put more solid constraints on
the cluster’s metal abundance, long suggested to be as low as the
metallicity of globulars.
As indicated
earlier by us on a purely photometric basis (Carraro et al. 2002), the cluster [Fe/H] abundance
is slightly super-solar ([Fe/H] =0.160.03) and close to the Hyades value, as inferred from a detailed abundance analysis
of 3 of the 5 stars with higher resolution spectra.
Abundance ratios are also marginally super solar.
Based on this result, we revise the
properties of NGC 2112 using stellar models from the
Padova and Yale-Yonsei groups.
For this metal abundance, we find the cluster’s age,
reddening, and distance values are 1.8 Gyr, 0.60 mag, and 940 pc, respectively.
Both the Yale-Yonsei and Padova models predict the same values
for the fundamental parameters within the errors.
Overall, NGC 2112 is a typical solar neighborhood,
thin disk star cluster, sharing the same chemical properties
of F-G stars and open clusters close to the Sun.
This investigation
outlines the importance of a detailed membership analysis in the
study of disk star clusters.
keywords:
Open clusters and associations: general– Open clusters and associations: individual: NGC 21121 Introduction
Gathering information on metal abundance and abundance ratios of many
Galactic clusters located in different region of the disk
and with different ages is mandatory to study the chemical evolution of the Galactic
disk. This, in turn, provides us with hints on the formation mechanism
of the disk and its relation with the other major
components of the Galaxy, the halo and bulge (Janes & Phelps 1994, Carraro et al. 1998).
However, a frequent, well known problem in the study of open star clusters is
the stellar contamination from the general Galactic disk
field, which complicates the analysis of the Color Magnitude
Diagram (CMD). It also makes it difficult to derive fundamental cluster
parameters, especially metallicity, when only a few stars are observed.
A notorious example in this context is the nearby old open
cluster NGC 2112 (Collinder 76, C 0551-0031, OCL 509), which
has a reputation of suffering from heavy field star contamination
(Brown et al. 1996), and for this reason its basic parameters
remain poorly constrained.
The first investigation on NGC 2112 was
carried out by Richtler (1985, hereinafter R85), who obtained photographic BV
photometry for about 80 stars down to V= 15.
Although his photometry barely
reaches the cluster Turn-Off (TO), he nevertheless drew attention to
this probably old, so far neglected cluster, and he suggested that NGC 2112 has a
reddening of 0.5 mag and lies 800 pc from the Sun. By analyzing additional Stromgren photometry, he proposed that the
cluster had to be very metal poor ([Fe/H] as low as -1.4).
A more accurate and deeper analysis was performed a few years later by Richtler &
Kaluzny (1989). They obtained BV CCD photometry for about 500 stars in
a field of 200 arcmin2. Additionally, they obtained moderate
resolution spectra for a handful of bright stars. Their conclusions
were that the cluster was very contaminated by field
stars. Nevertheless, they were able to strengthen the suggestions of
Richtler (1985, hereinafter R85) by confirming that the cluster is indeed old (3-5 Gyrs),
is located 700800 pc from the Sun and has a reddening of E(B-V)=0.60 mag.
Lacking a membership analysis, no further information on the cluster
metallicity was provided.
Photometry in the Washington system by Geisler(1987) and Geisler,
Claria & Minniti (1991) seems to confirm the previous
suggestions that NGC 2112 is very metal poor ([Fe/H] as low as -1.3).
More recently, three spectroscopic campaigns have been carried out in the
field of the cluster.
Friel & Janes (1993, hereinafter FJ93) present moderate resolution spectra of 6 stars.
Out of these, 5 are considered members, and an average of -0.520.21
has been found. This is significantly larger than all the previous
determinations.
Brown et al. (1996, hereinafter BWGO96) used the Blanco Echelle on CTIO to obtain high-resolution spectroscopy of 6 stars. They accepted just one star as a definitive
member, providing an even higher metal
content value, [Fe/H]=-0.15, only slightly lower than the solar
value.
Finally, Mermilliod & Mayor (2007, hereinafter MM07) enlarged the sample of
spectroscopic members to 3, out of 6 stars observed with Coravel. They underlined
the need to obtain radial velocities for a larger sample down to V
14.5 to better probe the shape of the Red Giant Branch (RGB).
At the same time, this would also provide much firmer metallicity estimates.
In Carraro et al. (2002) we
reported a Jonhson BVI photometry
of the cluster down to magnitude V=20. Assuming the metal content
found by Brown et al. (1996), we found a reddening of
E(B-V)=0.630.14, a distance of 850100 pc, and an age of
2.00.3 Gyr. We argued on a purely photometric basis that the metallicity
cannot be much lower than BWGO96 value, and we stressed the need for a new, more detailed spectroscopic investigation of the cluster.
In this paper we attempt such an investigation by securing the deepest
and widest field coverage multicolor () photometry of NGC 2112 to date. At the same time, we provide moderate and high resolution spectroscopy of 40 stars.
With these data at hand, we present robust and updated determinations
of the cluster’s basic properties.

2 Observations and data reduction
In this work we present photometry and spectroscopy in the field of NGC 2112 obtained with three different telescopes. For this reason, the details of data acquisition and reduction are presented in the next three sub-sections.
2.1 Photometry
and images centered on NGC 2112 were obtained at the
Cerro Tololo Inter-American Observatory 1.0 m telescope, which is
operated by the SMARTS111http://www.astro.yale.edu/smarts/
consortium. The telescope is equipped with a new 4k4k CCD
camera having a pixel scale of 0′′.289/pixel, which
allows one to cover a field of .
This allows us to cover the entire cluster,
which has an estimated diameter of 18 arcmin (Dias et al. 2002).
Observations were carried out on November 30, 2005. Three Landolt
(1992) areas (TPhoenix, Rubin 149, and PG 0231+006) were also
observed to calibrate the instrumental magnitudes to the standard system.
The night was photometric with an average seeing of 1.1 arcsec. Data
were reduced using IRAF222IRAF is distributed by NOAO, which
is operated by AURA under cooperative agreement with the NSF.
packages CCDRED, DAOPHOT, and PHOTCAL. Photometry was done employing
the point spread function (PSF) method (Stetson 1987). The covered
area is shown in Fig. 1, while Table 1 contains the
observational log.
The calibration equations read:
| Field | Filter | Exposure time | Seeing | Airmass | |
| [sec.] | [] | ||||
| NGC 2112 | U | 1200,60,5 | 1.1 | 1.150-1.280 | |
| B | 900,30,3 | 1.0 | 1.150-1.280 | ||
| V | 600,30,1 | 1.0 | 1.150-1.280 | ||
| I | 600,30,1 | 1.0 | 1.150-1.280 | ||
| TPhoenix | U | 180,200 | 1.0 | 1.024,1.444 | |
| B | 90,120 | 1.1 | 1.023,1.447 | ||
| V | 20,30 | 1.1 | 1.024,1.450 | ||
| I | 40,40 | 1.1 | 1.022,1.452 | ||
| PG 0231+006 | U | 200,240 | 1.1 | 1.291,1.801 | |
| B | 60,90 | 1.1 | 1.293,1.807 | ||
| V | 40,40 | 1.1 | 1.296,1.809 | ||
| I | 40,30 | 1.1 | 1.294,1.810 | ||
| Rubin 149 | U | 180,240 | 1.0 | 1.311,1.651 | |
| B | 90,120 | 1.1 | 1.316,1.649 | ||
| V | 30,40 | 1.0 | 1.318,1.647 | ||
| I | 40,40 | 1.0 | 1.313,1.643 | ||
| Calibration | |||||
| coefficients | |||||
| (1) | |
| (2) | |
| (3) | |
| (4) | |
| (5), |
where are standard magnitudes, are the instrumental
magnitudes, is the airmass, and the derived coefficients are presented
at the bottom of Table 1. To compute magnitudes when magnitudes
were available, we used expression (3); otherwise we used
expression (4). The standard stars in these fields provide
a wide color coverage with
,,
and . Aperture corrections were estimated
in a sample of 15 bright stars and then applied to all stars. They
amounted to 0.315, 0.300, 0.280, and 0.280 mag for the , , ,
and filters, respectively.
We cross-correlated our photometry with the photoelectric sequence of Richtler (1985) to check our zero-points. The cross-identifications are listed in Table 2,
where for comparison purposes we approximate our values to two digits, as in R85.
Values that have not been measured either by R85 or by us are replaced with 99.999.
The differences in , and between R85 and our study are illustrated in Fig. 2, and amount to:
Our photometry is basically consistent with R85. Only , although in agreement, exhibits
a significant scatter.
The resulting CMDs are shown in Fig. 3 for three color combinations. The TO is located at V14.5, (B-V) 1.1, and (V-I) 1.3.

| 1-01 | 630 | 11.47 | 0.58 | 0.38 | 11.42 | 0.54 | 0.37 |
|---|---|---|---|---|---|---|---|
| 1-02 | 593 | 13.53 | 1.04 | 0.43 | 13.50 | 1.02 | 0.43 |
| 1-06 | 585 | 11.76 | 0.72 | 0.30 | 11.73 | 0.72 | 0.20 |
| 1-10 | 512 | 13.44 | 1.12 | 0.61 | 13.39 | 1.09 | 0.59 |
| 1-16 | 382 | 10.04 | 2.25 | 2.62 | 2.62 | ||
| 1-18 | 401 | 14.92 | 0.99 | 0.52 | 14.99 | 0.99 | 0.70 |
| 2-02 | 601 | 13.75 | 1.00 | 0.38 | 13.65 | 1.01 | 0.42 |
| 2-16 | 422 | 13.39 | 1.66 | 1.46 | 13.36 | 1.64 | 1.46 |
| 2-20 | 724 | 12.85 | 0.85 | 0.38 | 12.77 | 0.81 | 0.34 |
| 3-03 | 749 | 12.90 | 0.95 | 0.44 | 12.83 | 0.91 | 0.39 |
| 3-06 | 909 | 15.16 | 1.11 | 0.47 | 15.11 | 1.04 | 0.42 |
| 3-08 | 919 | 14.26 | 1.74 | 14.31 | 1.79 | 1.75 | |
| 3-09 | 1029 | 14.12 | 1.22 | 0.60 | 14.05 | 1.17 | 0.72 |
| 3-10 | 935 | 13.52 | 1.68 | 13.54 | 1.62 | 1.38 | |
| 3-16 | 1123 | 12.34 | 2.11 | 2.77 | 12.44 | 2.03 | 2.68 |
| 3-17 | 1026 | 11.79 | 2.15 | 2.64 | 11.80 | 2.07 | 2.49 |
| 3-18 | 954 | 13.42 | 1.49 | 1.01 | 13.31 | 1.55 | 1.05 |
| 4-01 | 711 | 12.30 | 1.51 | 1.17 | 12.38 | 1.56 | 1.35 |
| 4-02 | 759 | 11.47 | 1.47 | 1.15 | 11.43 | 1.42 | 1.10 |
| ID | RA | DEC | U | B | V | I | |||||
| [mas/yr] | [mas/yr] | ||||||||||
| HYDRA observations | |||||||||||
| 101 | 05:53:11.7 | +00:18:43.4 | 17.409 | 15.983 | 14.363 | 0.017 | 12.476 | 42.470.68 | 3.67.9 | -10.88.2 | NM |
| 124 | 05:53:13.2 | +00:26:20.9 | 17.397 | 16.204 | 14.873 | 0.016 | 13.226 | -3.160.78 | 2.78.1 | -11.07.8 | NM |
| 167 | 05:53:16.0 | +00:15:06.6 | 16.433 | 15.000 | 13.313 | 0.018 | 11.315 | 29.600.40 | -3.67.9 | 8.87.8 | M |
| 185 | 05:53:17.1 | +00:25:00.3 | 16.269 | 15.834 | 14.852 | 0.015 | 13.501 | 36.530.96 | -3.67.8 | -3.27.8 | NM |
| 244 | 05:53:22.1 | +00:21:23.7 | 15.913 | 15.433 | 14.407 | 0.015 | 13.026 | 32.020.82 | -2.47.9 | -2.87.9 | M |
| 274 | 05:53:24.7 | +00:27:19.5 | 16.907 | 16.094 | 14.909 | 0.016 | 13.247 | -15.671.62 | -3.57.8 | 4.27.9 | NM |
| 323 | 05:53:28.2 | +00:25:09.8 | 16.715 | 16.057 | 14.896 | 0.016 | 13.305 | 30.691.90 | -7.57.8 | 3.07.9 | M |
| 340 | 05:53:29.1 | +00:29:37.5 | 16.264 | 15.418 | 14.246 | 0.016 | 12.655 | 32.270.74 | -10.17.9 | 2.97.9 | M |
| 382 | 05:53:31.4 | +00:27:18.7 | 14.876 | 12.249 | -6.180.22 | -1.21.0 | -7.51.1 | NM | |||
| 399 | 05:53:32.4 | +00:23:49.2 | 15.600 | 15.073 | 13.998 | 0.016 | 12.518 | 28.390.60 | -0.37.8 | 5.57.8 | M |
| 417 | 05:53:33.3 | +00:22:53.3 | 16.547 | 15.369 | 13.882 | 0.017 | 12.052 | 29.490.25 | M | ||
| 422 | 05:53:33.7 | +00:17:42.9 | 16.461 | 15.000 | 13.357 | 0.018 | 11.435 | -29.320.26 | -6.37.8 | -15.17.8 | NM |
| 443 | 05:53:34.8 | +00:16:16.0 | 16.550 | 15.505 | 14.037 | 0.016 | 12.275 | 29.520.34 | -5.97.8 | 4.17.9 | M |
| 478 | 05:53:37.0 | +00:21:12.5 | 15.528 | 14.988 | 13.898 | 0.016 | 12.428 | 30.450.44 | 1.27.8 | 4.47.8 | M |
| 512 | 05:53:39.0 | +00:27:50.7 | 15.077 | 14.485 | 13.392 | 0.019 | 11.805 | 21.421.52 | -0.97.8 | -7.97.8 | NM |
| 542 | 05:53:40.9 | +00:18:17.1 | 15.307 | 14.820 | 13.824 | 0.015 | 12.458 | 30.780.54 | -1.87.9 | 0.97.8 | M |
| 566 | 05:53:42.3 | +00:24:46.2 | 16.006 | 15.561 | 14.539 | 0.015 | 13.141 | 30.030.67 | -2.17.8 | -2.87.9 | M |
| 577 | 05:53:42.7 | +00:16:10.3 | 16.016 | 15.512 | 14.454 | 0.015 | 13.036 | 27.550.65 | -2.17.9 | 5.18.0 | NM |
| 580 | 05:53:42.8 | +00:29:55.3 | 15.317 | 14.807 | 13.739 | 0.016 | 12.380 | -12.840.67 | 10.87.9 | 0.27.9 | NM |
| 593 | 05:53:43.7 | +00:23:56.5 | 14.953 | 14.517 | 13.502 | 0.017 | 12.105 | 44.780.49 | -15.37.8 | -2.07.8 | NM |
| 601 | 05:53:44.4 | +00:23:00.7 | 15.076 | 14.654 | 13.647 | 0.019 | 12.302 | 30.020.60 | 1.07.8 | -5.47.8 | M |
| 655 | 05:53:47.3 | +00:26:16.6 | 16.416 | 14.877 | 13.155 | 0.018 | 11.036 | 31.550.21 | M | ||
| 656 | 05:53:47.5 | +00:22:01.6 | 15.337 | 13.491 | 11.724 | 0.019 | 9.663 | 29.530.27 | 3.21.7 | -0.81.7 | M |
| 707 | 05:53:50.3 | +00:25:22.1 | 15.495 | 15.148 | 14.202 | 0.015 | 12.900 | 30.810.81 | -9.28.0 | 27.37.9 | M |
| 714 | 05:53:50.7 | +00:23:18.7 | 15.672 | 15.226 | 14.227 | 0.015 | 12.843 | 31.950.70 | 1.97.8 | 1.17.9 | M |
| 737 | 05:53:51.9 | +00:24:33.8 | 15.526 | 15.143 | 14.157 | 0.015 | 12.825 | 31.810.57 | -1.77.8 | -6.28.0 | M |
| 770 | 05:53:53.6 | +00:18:56.4 | 16.235 | 15.794 | 14.767 | 0.015 | 13.379 | 24.370.86 | 1.77.8 | -5.87.9 | NM |
| 782 | 05:53:54.3 | +00:21:01.0 | 15.466 | 14.754 | 13.510 | 0.017 | 11.883 | 31.410.24 | M | ||
| 794 | 05:53:55.0 | +00:24:08.0 | 15.727 | 15.293 | 14.280 | 0.015 | 12.884 | 20.710.57 | 3.07.8 | 5.58.1 | NM |
| 824 | 05:53:56.6 | +00:25:24.8 | 15.698 | 15.327 | 14.366 | 0.015 | 13.056 | 30.650.58 | -0.97.8 | 3.87.9 | M |
| 890 | 05:53:59.9 | +00:23:12.4 | 15.393 | 15.019 | 14.051 | 0.015 | 12.728 | 12.000.53 | NM | ||
| 917 | 05:54:02.0 | +00:24:56.4 | 16.075 | 15.724 | 14.757 | 0.016 | 13.436 | 22.701.16 | -12.07.8 | 0.28.2 | NM |
| 935 | 05:54:03.1 | +00:22:59.5 | 16.546 | 15.162 | 13.537 | 0.018 | 11.505 | 38.330.22 | 1.07.8 | -4.37.8 | NM |
| 936 | 05:54:03.2 | +00:24:16.8 | 15.987 | 15.671 | 14.719 | 0.015 | 13.384 | -26.711.81 | -12.97.8 | 4.27.8 | NM |
| 1140 | 05:54:22.6 | +00:21:32.6 | 14.947 | 13.964 | 0.021 | 12.581 | 3.891.01 | -1.07.8 | 3.37.9 | NM | |
| MIKE observations | |||||||||||
| 261 | 05:53:23.6 | +00:15:35.9 | 17.100 | 15.619 | 13.955 | 0.015 | 11.987 | 19.840.14 | -6.37.8 | -6.77.9 | NM |
| 304 | 05:53:27.1 | +00:23:33.3 | 16.059 | 15.402 | 14.181 | 0.015 | 12.583 | 29.270.15 | -4.27.8 | -0.67.9 | M |
| 535 | 05:53:40.6 | +00:18:31.4 | 15.326 | 14.826 | 13.770 | 0.017 | 12.317 | 29.550.25 | 2.77.9 | -1.97.9 | M |
| 717 | 05:53:50.9 | +00:25:30.8 | 15.676 | 15.308 | 14.336 | 0.012 | 12.998 | 39.030.24 | 4.17.9 | 0.67.9 | NM |
| 836 | 05:53:57.3 | +00:26:06.1 | 16.681 | 15.622 | 14.171 | 0.014 | 12.402 | 29.260.16 | -6.18.1 | 3.27.9 | M |
2.2 Spectroscopy: HYDRA observations
Medium resolution spectroscopic observations were carried out on the night of
2006 Feb 15 (Julian Date 2453783.57006) with
the Hydra spectrograph on-board the Wisconsin Indiana Yale NOAO (WIYN)
telescope at Kitt Peak National Observatory under photometric conditions and
typical seeing of 1.0 arcsec. The Multi-Object Spectrograph (MOS)
consists of the Hydra positioner, which in 20 minutes can place 89
fibers within the 10 diameter focal plane of the telescope to
0.2 arcsec precision. This project employed the 3 arcsec diameter
red-optimized fiber bundle.
The fibers feed a bench-mounted
spectrograph in a thermally isolated room. With the echelle grating
and the Bench Spectrograph Camera, the system produces a resolution of
15000 at 6560 Å . The wavelength coverage of 400 Å around the central
wavelength of 6560 Å provides a rich array of narrow absorption
lines. We observed 35 TO-RGB stars with 245 minute
exposures, for a grand total of 1.5 hr of actual photon collection
time on each star.
The 35 stars were selected from the
photometric catalog presented in previous section. By using UCAC2 catalog (Zacharias et al 2004) as
reference, we converted pixel coordinates into 2000.0 equinox Right Ascension and Declination
using 50 stars as input. The astrometry precision is 0.3 arcsec.
The selected stars for Hydra are
candidate RGB and TO
stars according to their position in the CMD and have the right magnitudes to be observed with the WIYN 3.6 m
telescope. We restricted the sample to stars brighter than V15.0.
The stars are listed in Table 2, where column (1) reports
numbering. In the following columns we report
2000.0 equinox coordinates, magnitude and colors, heliocentric radial velocity, and proper motion
components from UCAC2 (Zacharias et al. 2004). In the last column
an indication of membership is provided (see next section).
For some stars (782, 655, 890 and 417), no proper motions are
available from UCAC2, probably because these stars have close companions.

Images were pre-reduced using IRAF 333IRAF is distributed by the National Optical Astronomy Observatory, which is operated by the Association of Universities for Research in Astronomy, Inc., under cooperative agreement with the National Science Foundation. including bias subtraction, flat-field correction, frame combination, extraction of spectral orders, wavelength calibration, sky subtraction, and spectral normalization. Some spectra turned out to have a very low signal-to-noise ratio (S/N), although all the observed stars have practically the same magnitude. This could happen for two reasons: the first is an imperfect pointing of the fiber, and the second is possibly bad fiber transmission.
2.3 Spectroscopy: MIKE observations
Echelle spectrograms of stars 535, 261, 717, 304 and 836 (see Table 2) were obtained on 2007 October 29 with the Magellan Inamori Kyocera Echelle (MIKE) spectrograph mounted on the Nasmyth focus of Landon Clay 6.5m telescope at the Magellan Observatory. Data were obtained with both the blue and red arms. The slit was 0.7 arcsec wide, which yielded a resolution R=33000, and the CCD was binned in steps of 2 pixels in the dispersion direction. The typical seeing was 0.6-0.8 arcsec. We used quartz lamp images without the diffuser in position for flat field correction, and the wavelength calibration was performed with ThAr lamp images that were taken just before and after the five stellar exposures. The dark current was checked by examining several dark exposures and was found to be insignificant. The optimum algorithm (Horne 1986) was used to extract the spectra, which were also sky-subtracted and normalized using IRAF routines. Additional details on the spectra are reported in Table 3.
| ID | Julian Date | Exposure | S/N |
|---|---|---|---|
| sec | |||
| 535 | 2454303.82317 | 500 | 80 |
| 261 | 2454403.81600 | 800 | 60 |
| 717 | 2454403.83538 | 1200 | 100 |
| 304 | 2454403.85079 | 1600 | 90 |
| 836 | 2454403.87042 | 1300 | 80 |
| R85 | ID | V | (B-V) | BWGO96 | FJ93 | MM07 | |
|---|---|---|---|---|---|---|---|
| 1-16 | 382 | -6.180.22 | -3.6 | - 4.04 | |||
| 2-4 | 656 | 11.724 | 1.767 | 29.530.27 | 30.04 | ||
| 2-16 | 422 | 13.357 | 1.643 | -29.320.26 | -23.3 | -22 | -29.02 |
| 3-16 | 1123 | 12.441 | 2.030 | 21 | 31.75 | ||
| 3-17 | 1026 | 11.805 | 2.073 | 40 | 44.76 | ||
| 3-18 | 954 | 13.312 | 1.550 | 25.3 | |||
| 4-1 | 711 | 12.380 | 1.639 | 28.56 | |||
| 4-2 | 759 | 11.429 | 1.423 | 21.630.1 | 35 | 32.53 | |
| 4-16 | 883 | 12.856 | 1.546 | 44.5 | 60 |


3 Membership and Cluster Mean Radial Velocity
We derived radial velocities
of the target stars using the IRAF fxcor task, which
cross-correlates the object spectrum with a template. As a template,
we used a synthetic spectrum calculated by SPECTRUM 444SPECTRUM
is the local thermodynamical equilibrium (LTE) spectral synthesis
program freely distributed by Richard O. Gray. See: http://www.phys.appstate.edu/spectrum/spectrum.html
with roughly the same atmospheric
parameters and metallicity of the observed stars. The final errors in
the radial velocities, as provided by fxcor, were typically less than 1.0 km/s
for most of the Hydra stars and less than 0.3 km/s
for MIKE targets (see Table 2). In the case of Hydra spectra, these
have to be considered the real errors since they have been taken
from the average of the two different exposures and their combined errors. In the
case of MIKE spectra, having only one exposure, we consider the reported
error as a lower limit of the real error.
The distribution of radial velocities is shown in the histogram in Fig. 4.
The bulk of stars form a peak in the heliocentric radial velocity
distribution around 30-31 km/s, allowing us to define a mean velocity
for the cluster and the dispersion, .
These turn out to be:
| (1) |
To derive this value we used 21 stars, which are listed in Table 2
as cluster members.
These stars were selected using an interactive procedure in which we calculated
an initial value for RVH and . Then
stars having radial velocities more than 3 from the mean were rejected as non-members
and a new RVH and computed. This procedure
was iterated until no more stars were rejected.
It is, however, possible that some of the rejected stars are binary stars.
In Table 4, we compare our measurements with literature values.
Radial velocity data for NGC 2112 are poor and very inhomogeneous.
We have 3 stars in common with BWGO96, one with FJ93 and 2 with
MM07. In all cases, the radial velocities are compatible within the errors,
as are the membership assignments.
We confirm the result of BWGO96 that star 2-4 (our star 656) is a member.
One more star, for which we do not have new radial velocity, can
be considered a member, following MM07, if it is a binary: this is
star 3-18 (our 954).
Finally, we find that 3-16, 4-1 and 4-2
(our stars 1123, 711 and 759) are member stars following the analysis in MM07 and looking at Table 5.
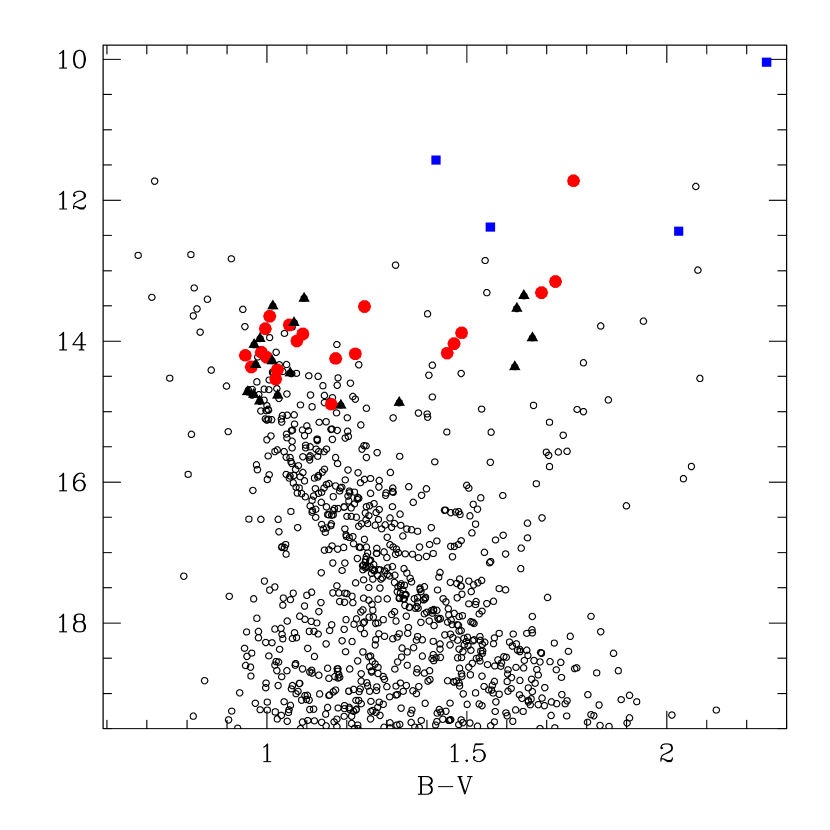
We make use of the CMD to get additional information on the cluster membership. In Fig. 5, we indicate with filled circles (red when printed in color) the radial velocity members, and with filled triangles (black when printed in color) the radial velocity non-members. Additionally, we plot as filled squares (blue in color) stars that are members, but for which we do not have radial velocity measurements (1123, 711 and 759), and star 362 (3-16), for which we have measured its radial velocity but not photometry, which we take from R85..
Clearly, members and non-members mix up in a way that, without radial velocities, it would not be possible to discriminate between them. Our member stars are partly located in the TO region and partly trace the sub-giant branch and RGB of the cluster.
Among this membership sample, we find two stars with the radial velocities typical of members
but located far from the most important loci in the CMD.
They are stars 323 at (V,B-V) = (14.896, 1.161) and 782 at (13.510,1.244). We suggest that these stars may be binary
members, as is star 3-18 (our 954, see MM07), which must be confirmed by future studies
(but see Section. 7 for additional details).
Unfortunately, we cannot use proper motions (see Table 2) to improve our
membership assignments due to the large associated errors.
| ID | Teff(K) | log(g) | vt(km/s) | [Fe/H] |
|---|---|---|---|---|
| 535 | 6650 | 3.85 | 1.70 | 0.150.02 |
| 304 | 5980 | 3.65 | 1.00 | 0.190.02 |
| 836 | 5130 | 3.48 | 1.02 | 0.130.01 |
4 Abundance measurements
4.1 Atomic Parameters and Equivalent Widths
We performed the analysis of chemical abundances on the 3 members observed with MIKE using the 2007 version of the free available program MOOG developed by Chris Sneden555http://verdi.as.utexas.edu/moog.html and using model atmospheres by Kurucz (1992). MOOG performs a local thermodynamic equilibrium (LTE) analysis. We derived equivalent widths of spectral lines by Gaussian fitting of spectral features. Repeated measurements show a typical error of about 5 mÅ for the weakest lines. The line list was taken from Carraro et al. (2008). The log(gf) parameters of these lines were re-determined by a solar-inverse analysis measuring the equivalent widths from the NOAO solar spectrum (Kurucz et al. 1984), adopting standard solar parameters (Teff = 5777 K, log(g) = 4.44, and vt = 0.8 km/s). The abundance was obtained from the IR triplet at 7771-5 Å , while the Na abundance was obtained from the spectral doublets at 5662-68 and 6154-60 Å . These features are well known to be affected by NLTE effects. For this reason we applied NLTE correction to the output LTE abundances, obtained from Gratton & al. (1999).
4.2 Atmospheric Parameters
Initial estimates of the atmospheric parameter Teff were obtained from photometric observations using the relations from Alonso et al. (1999). We adopted E(B-V) values from Carraro et al. (2002) to correct colours for interstellar extinction. We then adjusted the effective temperature by minimizing the slope of the abundances obtained from Fe I lines with respect to the excitation potential in the curve of growth analysis. Initial guesses for the gravity log(g) were derived from the canonical formula:
| (2) |
In this equation, the mass was derived from the comparison between the position of the star in the Hertzsprung-Russell diagram and the Padova isochrones (Girardi et al. 2000). The luminosity was derived from the absolute magnitude , assuming a distance moduli of . The bolometric correction (BC) was derived from the BC-Teff relation from Alonso et al. (1999). The input log(g) values were then adjusted in order to satisfy the ionization equilibrium of Fe I and Fe II during the abundance analysis. Finally, the microturbulence velocity is given by the relation (Houdashelt et al. 2000):
| (3) |
We then adjusted the micro-turbulence velocity by minimizing the slope
of the abundances obtained from Fe I lines with respect to the
equivalent width in the curve of growth analysis.
The adopted values for all these parameters, together with [Fe/H], are reported
in Table 6. The results of the abundance analysis are listed
in Table 7, where the abundances of the main elements
are reported with their uncertainties. Two stars turn out to be giants ( 304 and 836) , while star
is clearly a dwarf. This explains the different number of lines
used in the determination of the different elemental abundances.
As a final remark, we also performed an abundance analysis for the two radial
velocity non-members, and found that the two stars 261 and 717 have [Fe/H] =
+0.280.02 and +0.300.03, confirming their nature as non member stars.
Examples of our extracted spectra are illustrated in Fig. 6, in which the
spectrum of 3 MIKE member stars are shown and some interesting lines indicated.
The mean metallicity we derive ([Fe/H]=+0.160.03) is significantly different
from any previous spectroscopic estimate. The closest determination is the one by BWGO96,
who found [Fe/H]=-0.150.15. Our result rules out any possibility that NGC 2112
is very metal poor, as suggested in early studies. It would have been very
unusual to have such a metal poor cluster in the solar neighborhood.
Our result, in fact, suggests that NGC 2112 has a typical solar vicinity metal
abundance, being as metal rich as the Hyades (Boesgaard & Friel 1990).
| 0.150.02 | (19) | 0.190.02 | (71) | 0.130.01 | (107) | |
| 0.450.07 | (3) | 0.360.01 | (3) | 0.270.03 | (3) | |
| 0.030.07 | (3) | 0.170.01 | (3) | 0.230.03 | (3) | |
| 0.350.13 | (2) | 0.200.06 | (4) | 0.300.06 | (3) | |
| 0.240.13 | (2) | 0.150.06 | (4) | 0.230.06 | (3) | |
| 0.13 | (1) | 0.18 | (1) | 0.270.03 | (2) | |
| 0.100.09 | (2) | 0.050.03 | (3) | |||
| 0.330.02 | (3) | 0.110.06 | (5) | 0.110.05 | (8) | |
| 0.180.07 | (7) | 0.230.04 | (13) | 0.070.05 | (13) | |
| 0.200.04 | (2) | 0.430.09 | (7) | 0.230.04 | (23) | |
| -0.01 | (1) | 0.310.06 | (10) | |||
| 0.510.05 | (2) | 0.410.08 | (6) | 0.140.03 | (11) | |
| -0.18 | (1) | 0.030.03 | (3) | 0.100.02 | (3) | |
| 0.270.07 | (2) | 0.240.06 | (4) | |||
| 0.17 | (1) | 0.240.05 | (15) | 0.210.03 | (29) | |
| 0.38 | (1) | 0.12 | (1) | |||
| 0.45 | (1) | 0.510.24 | (2) | |||
| 0.59 | (1) | 0.840.06 | (2) | 0.400.01 | (2) |
Karatas & Schuster (2006) provided a new calibration of the relation between the metallicity of a dwarf star and , namely the (U-B) excess/deficiency with respect to the Haydes sequence at (B-V)o = 0.6. We compared the distribution of dwarf stars in NGC 2112 at (B-V)o 0.6 with respect to a ZAMS from Girardi et al. (2002) having the same metallicity of the Hyades ([Fe/H]=0.17). We found that the useful stars (13 in number) have =-0.020.11. Despite the scatter, this implies a metallicity close to our spectroscopic determination (see Table 3).
5 Abundance ratios
We derived abundance ratios for the 3 MIKE member stars listed in Table 7.
Previously, only BWGO96 provided an estimate of a few abundance
ratios in NGC 2112, but based on just one star.
At any rate, we compare our findings with BWGO96 (their Table 6),
and find basic agreement with [O/Fe] and [Na/Fe]. However, their [Al/Fe]
is much larger than our value.
Being close to the Sun and having roughly the same metallicity,
it is useful to make a detailed comparison of the
chemical properties of NGC 2112 with the solar neighborhood stars and star clusters.
5.1 Comparison with field stars
Bensby et al. (2005) present
a detailed abundance analysis for a sample of 102 F and G dwarf
stars in the solar vicinity.
elements
As shown by Bensby et al (2005), , , , and exhibit similar trends
in the Galactic thin disk. At the Fe abundance of NGC 2112 (+0.16) , these ratios
are in the range of -0.150.00, 0.00+0.15, 0.00+0.15, 0.00+0.15,
and -0.050.05 dex, respectively.
According to our findings, abundance ratios for these five elements in NGC 2112 are in agreement
with the thin disk values within the errors . This confirms that NGC 2112 is a typical
thin disk star cluster.
The overall ratio turns out to be
0.040.03.
Iron peak elements
We can compare only and with Bensby et al (2005).
Ni is basically in agreement with the thin disk trends,
whereas the [Cr/Fe] ratio is marginally overabundant.
Al and Na
While the abundance relative to is consistent with thin disk values, we find that
Al is significantly under-abundant.
r- and s-process elements
We measured and abundance ratios. While the abundance in NGC 2112
is consistent with the thin disk trend, we find that the Y abundance is significantly
larger that typical thin disk values.
5.2 Comparison with open clusters
In general, there is not much information on abundance ratios in open clusters,
and only in the last few years efforts have been done to improve this
situation.
Here, we compare our NGC 2112 abundance ratios with the results presented in Friel et al. (2003).
They provide a detailed abundance
analysis of the old star cluster Collinder 261
and compare its abundance ratios with a sample of 10 open clusters (see their Table 7).
From this table, we extract estimates for NGC 2360 and NGC 6819, two nearby clusters
having roughly the same ages and metal abundances as NGC 2112.
We find that within the errors, NGC 2360 and NGC 6819 possess the same [/Fe] as NGC 2112,
+0.03 and 0.00, respectively.
The abundance of NGC 2112 is similar to NGC 2360 but significantly lower than in NGC 6819.
As for , we can make a comparison only with NGC 6819, for which [Al/Fe]
is similar to the value we determine for NGC 2112.
Unfortunately, neither information about the Iron-peak elements nor for s- and r- process
elements are reported in Friel et al. (2003).
Overall, with a few exceptions, we find that NGC 2112 is a genuine thin disk population cluster.
6 Cluster fundamental parameters
Having an estimate of the metal content ([Fe/H]=+0.16),
and of the element abundances (=+0.04),
we are now in the position to derive more reliable estimates
of the cluster parameters.
The reddening value in the direction of NGC 2112 predicted by Schlegel et al. (1998) maps
is E(B-V) = 1.01. This has to be considered as an upper limit to the reddening
since it takes into accounts the absorption all the way to infinity.
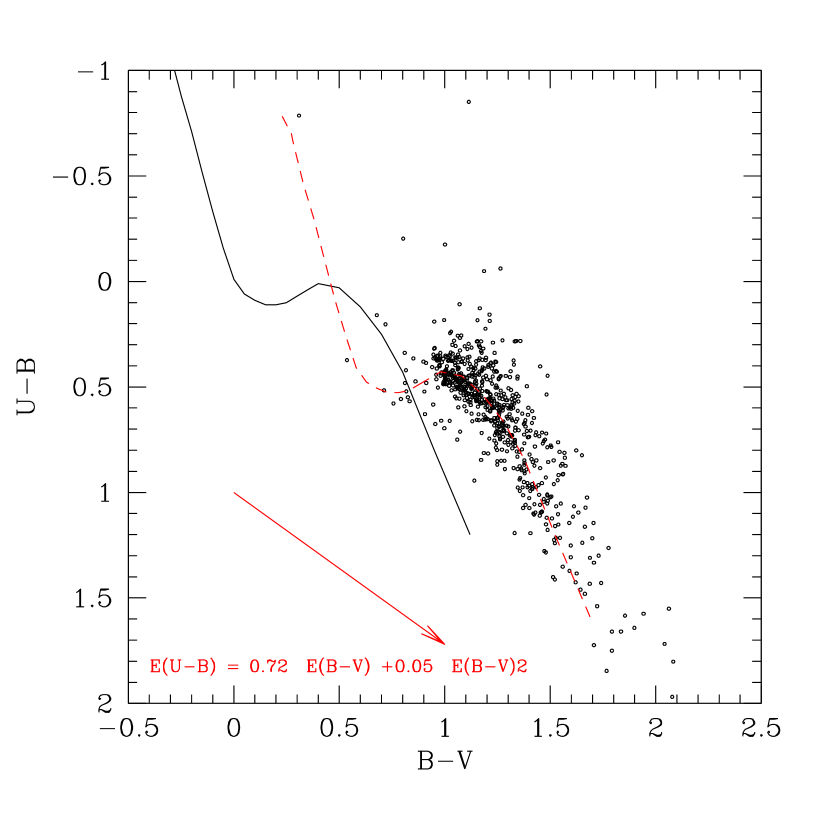
To get an independent estimate of the reddening in the direction of NGC 2112, we make use
of the two-color diagram (TCD) in Fig. 7 since
we provide deep band photometry for the first time.
Here, the solid line is the zero reddening
empirical Zero Age Main Sequence (ZAMS) from Schmidt-Kaler (1982). The same ZAMS,
shifted by E(B-V)=0.60 is shown as a dashed line. The shift has been performed
adopting the standard reddening law (see the expression in the bottom of Fig. 7),
and the reddening vector is indicated with a solid arrow.
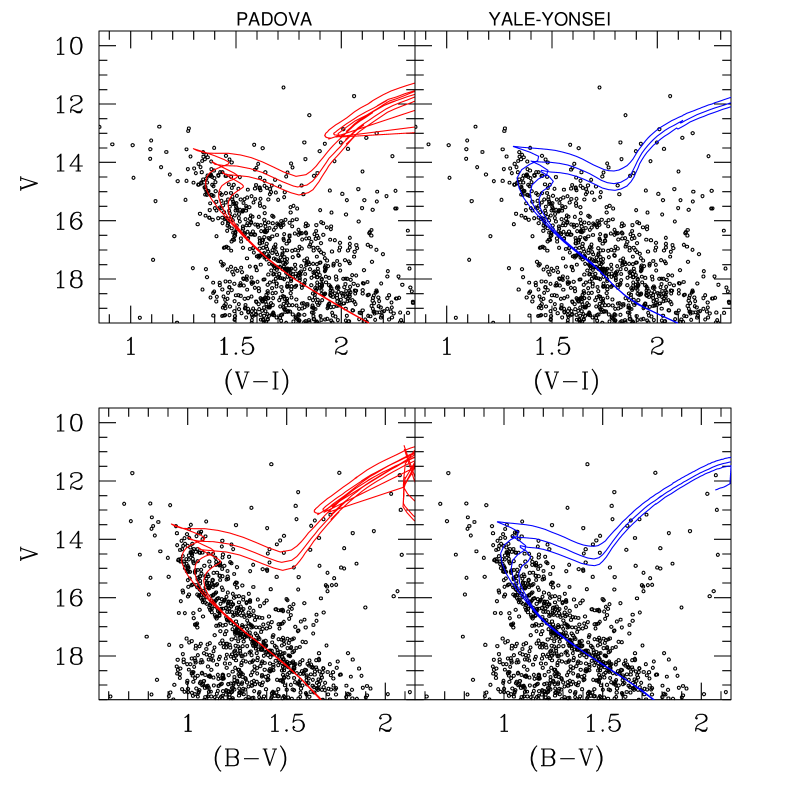
We compare the distribution of stars in the various color combination CMDs and sets of theoretical
Padova (Girardi et al. 2000) and Yale (Demarque et al. 2004, Kim et al. 2002, Yi et al 2001) isochrones.
The physical ingredients of the two sets, and the possible sources
of different results, have been discussed exhaustively in Carraro et al. (2006),
where a similar exercise has been done for the very metal rich
open cluster NGC 6791.
In Fig. 8 we superimpose isochrones with [Fe/H]=+0.16 and =+0.04
for 3 ages (1.5, 2.0, and 2.5 Gyrs).
The fitting is performed in the left panels for Padova models,
and in the right panels for Yale models.
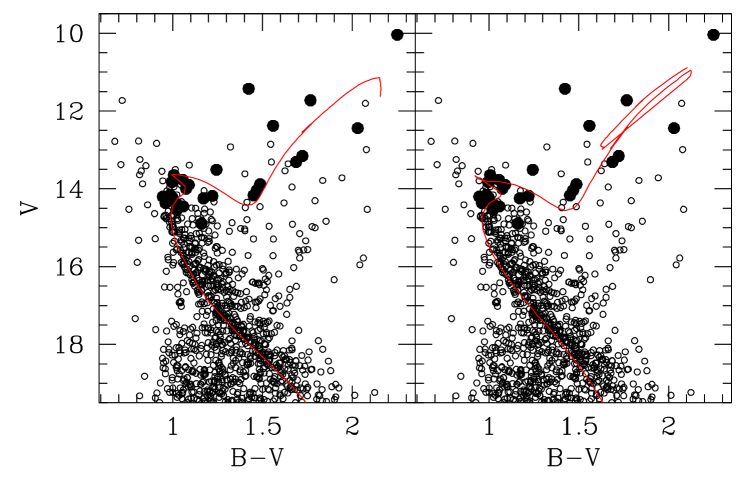
To derive more constrained basic parameters, we consider in Fig. 9
the star distribution in the V vs (B-V) plane, and we highlight the
radial velocity members using filled circles. The best fit isochrone is found
for an age of 1.80.3 Gyr, where the associate error has been derived by
trying different age isochrones.
We find that the both the Yale-Yonsei and Padova sets
fit the star distribution well, and we summarize
the derived values for the basic parameters in Table 8.
On average, we obtained (m-M)V=11.750.15 and E(B-V)=0.600.10. The errors here reported have been derived by displacing the best fit isochrone back and forth in the distance modulus and reddening directions and exploring the values of distance modulus and reddening which produce acceptable fits.
The two sets of models imply the same values for NGC 2112 basic
parameters within the errors. It is worth noticing, however, that the fit
implies a sizeable difference in the mean E(B-V), in the sense that the reddening
that inferred using Yale-Yonsei models is larger than that inferred
from Padova models. At the same age and metal abundance, the apparent Yale-Yonsei RGB is bluer than the Padova one, resulting in
a larger reddening when fitting the observed RGB.
Using the
heliocentric rectangular Galactic coordinates X= 9.3 kpc, Y= -400 pc, and Z = -200 pc and
assuming the Sun distance from the Galactic center is 8.5 kpc, NGC 2112 is located 94070 pc from the Sun towards the anti-center direction.
Consequently, we infer a distance of 9.3 kpc from the Galactic center.
| -0.12 | -0.02 | 0.10 | |
| 0.09 | -0.04 | 0.10 | |
| -0.02 | -0.01 | 0.14 | |
| -0.09 | -0.08 | ||
| 0.18 | -0.08 | -0.02 | |
| 0.03 | 0.04 | -0.06 | |
| 0.05 | 0.24 | 0.10 | |
| -0.20 | 0.18 | ||
| 0.36 | 0.22 | 0.01 | |
| -0.33 | -0.16 | -0.03 | |
| 0.08 | 0.11 | ||
| 0.02 | 0.05 | 0.08 | |
| 0.19 | -0.01 | ||
| 0.26 | 0.38 | ||
| 0.44 | 0.65 | 0.27 |
| Models | Age | E(B-V) | (m-M)V |
|---|---|---|---|
| Yale-Yonsei | 1.80.3 | 0.630.05 | 11.800.10 |
| Padova | 1.80.3 | 0.570.05 | 11.750.10 |
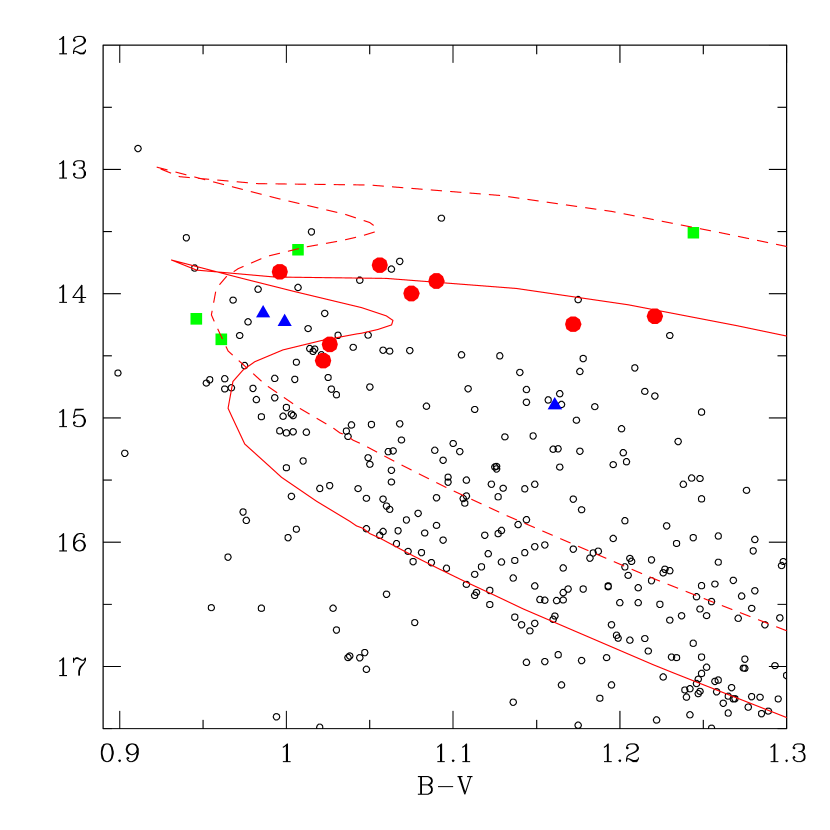
7 A zoom of the TO region: getting additional clues to the binary population
Now that we have determined the cluster’s fundamental parameters, we can use the best fit isochrone as a tool to investigate possible binaries among cluster members from a purely photometric point of view. In Fig 10 we provide a zoom of the TO region, and indicated with filled circles (color coded in red) radial velocity members. The solid line is the best fit Padova isochrone (see Fig. 9). The dashed curve is the same isochrone, but shifted up by 0.75 mag, to illustrate the locus of unresolved equal mass binaries. This exercise is suggesting us that several stars that lie off the best fit isochrone may in reality be unresolved binaries. In fact some of them lie very close to the binary locus, and we indicate them as filled squares (color coded in green) in the CMD of Fig. 10. They are stars 707, 824, 782 and 601. At the same time, we indicated as filled triangles (blue when printed in color) stars which lie neither in the single star nor in the binary star sequence. These are stars 714, 707, and 323. One may speculate that these are unequal mass binaries or maybe systems with more than two components. If we refer only to the TO region, we are left with 14 single member stars and 7 possibly multiple systems, which implies a rough binary percentage of 33.
8 Discussion and conclusions
In this paper we presented new photometric and spectroscopic data
in the field of the old open cluster NGC 2112.
This new dataset allowed us to revise the cluster’s fundamental parameters
and clarify a long lasting debate on its properties, which for many years have been
poorly constrained due to the high level of field star contamination.
By means of multi-fiber spectroscopy, we measured radial velocity for
40 stars and found 21 radial velocity members. This, in turn, allowed
us to clean the CMD, providing a better comparison with stellar models.
The most important result of our study is that the cluster has a metallicity
much higher than previous determinations, and somewhat higher than the Sun.
Also the elements are marginally enhanced with respect to the Sun,
but still compatible with the trends of thin disk stars in the solar
vicinity, as are all the other elements we measured.
Therefore NGC 2112 is typical of old, thin disk star clusters, as metal rich as the Hyades (Boesgaard & Friel 1990), and located at less than 1 kpc from the Sun in the anticenter direction.
In addition, we confirmed the age of the cluster ( 1.8 Gyr), previously derived on a purely
photometric basis (Carraro et al. 2002). As for the distance and reddening, our
values are in agreement within the errors of previous determinations.
This study stresses the importance of performing detailed membership analysis in Galactic open clusters in order to derive more robust estimates of their fundamental parameters.
Acknowledgments
This research was part of a joint project between Universidad the Chile and Yale University, partially funded by the Fundación Andes. Hydra observations were performed remotely from Yale by MVM. CMB acknowledges Universidad de Chile graduate fellowship support from program MECE Educación Superior UCH0118 and Fundación Andes C-13798. MVM was supported by an NSF Astronomy and Astrophysics Postdoctoral Fellowship, under award AST04-011640. GC thanks Doug Geisler, Tom Richtler and Roberto Barbon for long and interesting discussions on NGC 2112, and the anonymous referee who helped us to improve the paper presentation. This study made use of SIMBAD and WEBDA.
References
- (1) Alonso, A., Arribas, S. & Martínez-Roger, C. 1999, A&AS, 140, 261
- (2) Bensby, T., Feltzing, S., Lundström, I., Ilyin, I., 2005, A&A 433, 185
- (3) Boesgaard, A.M., Friel, E.D., 1990, ApJ 351, 467
- (4) Brown J.A., Wallerstein G., Geisler D., & Oke J. B. 1996, AJ, 112, 1551
- (5) Carraro, G., Ng, Y.K., & Portinari, L. 1998, MNRAS, 296, 1045
- (6) Carraro, G., Barbon, R., & Boschetti, C.S. 2002, MNRAS, 336, 259
- (7) Carraro G., Villanova, S., Demarque, P., McSwain, M.V., Piotto, G., Bedin, L.R., 2006, ApJ 643, 1151
- (8) Carraro G., Geisler, D., Villanova, S., Frinchaboy, P.M., Majewski, S.R., 2008, A&A 476, 217
- (9) Demarque P.,Wo,Y-H., Kim, Y-C., Yi, S.K. 2004, ApJS 115, 667
- (10) Dias, W.S., Alessi, B.S., Moitinho, A., Lepine, J.R.D. 2002, A&A 389, 871
- (11) Friel E.D., Janes K.A., 1993, A&A 267, 75
- (12) Friel, E.D., Jacobson, H.R., Barrett, E., Fullton, L., Balachendran, S.C., Pilachowski, C.A, 2003, AJ 126, 2372
- (13) Geisler D. 1987, AJ, 94, 84
- (14) Geisler D., Claria J.J., Minniti. D 1991, AJ, 102, 1836
- (15) Girardi L., Bressan A., Bertelli G., & Chiosi, C. 2000, A&AS, 141, 371
- (16) Gratton R. G., Carretta E., Eriksson K., & Gustafsson B. 1999, A&A, 350, 955
- (17) Houdashelt M.L., Bell R.A., & Sweigart A.V. 2000, AJ, 119, 1448
- (18) Horne, K., 1986, PASP 98, 60
- (19) Karatas Y., Schuster W.J., 2006, MNRAS 371, 1793
- (20) Kim, Y.-C., Demarque, P., Alexander, D.R., 2002, ApJS 143, 499
- (21) Kurucz R.L., Furenlid I., Brault J., & Testerman, Larry 1984, sfat.book, K
- (22) Kurucz R.L. 1992, IAUS, 149, 225
- (23) Janes, K.A., Phelps, R.L., 1994, AJ 108, 1773
- (24) Landolt, A.U., 1992, AJ 104, 340
- (25) Mermilliod, J.-C., Mayor, M., 2007, A&A 470, 919
- (26) Richtler T. 1985, A&AS, 59, 491
- (27) Richtler T., & Kaluzny J. 1989, A&AS, 81, 225
- (28) Schlegel D.J., Finkbeiner D.P., & Davis M. 1998, ApJ, 500, 525
- (29) Schmidt-Kaler, Th., 1982, in Schaifers K., Voigt, H.H., eds., Numerical Data and Functional Relationships in Science and Technology, Landolt-Börbstein, New Series, Group VI, Vol 2(b), Springer, Berlin, p. 14
- (30) Stetson, P.,B., 1987, PASP 99, 191
- (31) Zacharias, N., Urban, S.E., Zacharias, M.I., Wycoff, G.L., Hall, D.M., Monet, D.G., Rafferty, T.J., 2004, AJ 127, 3043
- (32) Yi, S.K, Demarque P.,Kim, Y-C., Lee, Y.-W, Ree, C.H., Lejeune, Th., Barnes, S., 2001, ApJS 136, 417