11email: ykovalev, alobanov, apushkar, azensus@mpifr-bonn.mpg.de 22institutetext: Astro Space Center of Lebedev Physical Institute, Profsoyuznaya 84/32, 117997 Moscow, Russia 33institutetext: Central (Pulkovo) Astronomical Observatory, Pulkovskoe Chaussee 65-1, St. Petersburg 196140, Russia 44institutetext: Crimean Astrophysical Observatory, Crimea, Ukraine
Opacity in compact extragalactic radio sources and its effect on astrophysical and astrometric studies
Abstract
Context. The apparent position of the “core” in a parsec-scale radio jet (a compact, bright emitting region at the narrow end of the jet) depends on the observing frequency, owing to synchrotron self-absorption and external absorption. While providing a tool probing physical conditions in the vicinity of the core, this dependency poses problems for astrometric studies using compact radio sources.
Aims. We investigated the frequency-dependent shift in the positions of the cores (core shift) observed with very long baseline interferometry (VLBI) in parsec-scale jets. We discuss related physics, as well as its effect on radio astrometry and the connection between radio and optical positions of astrometric reference objects.
Methods. We searched for the core shift in a sample of 277 radio sources imaged at 2.3 GHz (13 cm) and 8.6 GHz (4 cm) frequency bands using VLBI observations made in 2002 and 2003. The core shift was measured by referencing the core position to optically thin jet features whose positions are not expected to change with frequency.
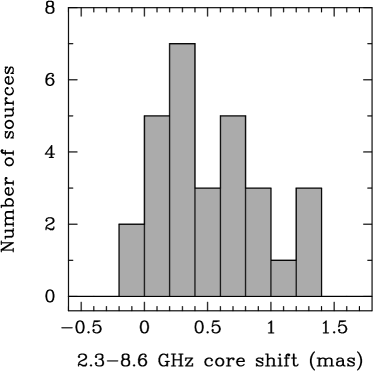
Results. We present here results for 29 selected active galactic nuclei (AGN) with bright distinct VLBI jet features that can be used in differential measurements and that allow robust measurements of the shift to be made. In these AGN, the magnitude of the measured core shift between 2.3 and 8.6 GHz reaches 1.4 mas, with a median value for the sample of 0.44 mas. Nuclear flares result in temporal variability of the shift.
Conclusions. An average shift between the radio (4 cm) and optical (6000 Å) bands is estimated to be approximately 0.1 mas, and it should be taken into account in order to provide the required accuracy of the radio-optical reference frame connection. This can be accomplished with multi-frequency VLBI measurements yielding estimates of the core shift in the sources used for the radio reference frame and radio-optical position alignment.
Key Words.:
galaxies: active — galaxies: jets — radio continuum: galaxies — astrometry — reference systems1 Introduction
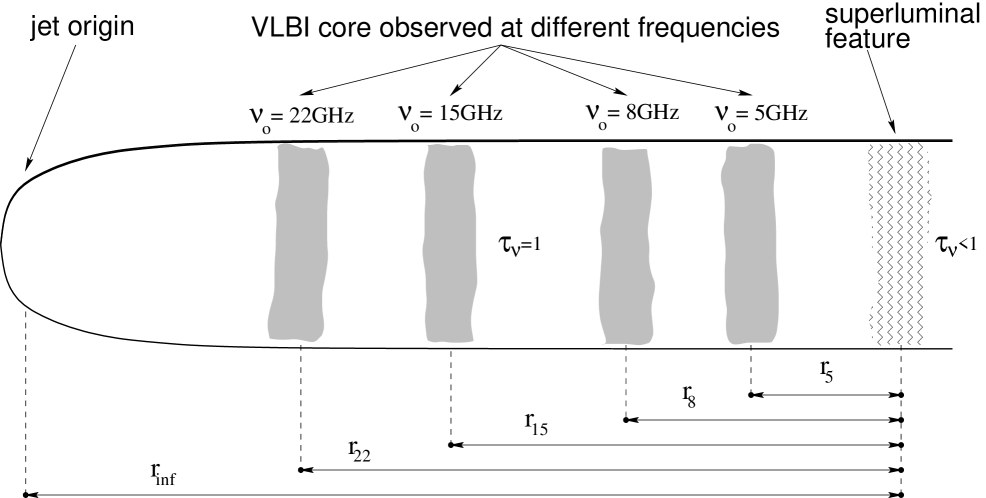
Extragalactic relativistic jets are formed in the immediate vicinity of the central black holes in galaxies, at distances on the order of 100 gravitational radii, and they become visible in the radio at distances of about 1000 gravitational radii (Lobanov & Zensus, 2007). This apparent origin of the radio jets is commonly called the “core”. In radio images of extragalactic jets, the core is located in the region with an optical depth . This causes the absolute position of the core, , to vary with the observing frequency, , since the optical depth profile along the jet depends on : (Blandford & Königl, 1979). See an illustration of this effect in Fig. 1. Variations in the optical depth along the jet can result from synchrotron self-absorption (Königl, 1981), pressure and density gradients in the jet and free-free absorption in the ambient medium most likely associated with the broad-line region (BLR) (Lobanov, 1998b). If the core is self-absorbed and in equipartition, the power index (Blandford & Königl, 1979). Density and pressure gradients in the jet and external absorption can lead to deviations in from unity (Lobanov, 1998b). Changes in the core position measured between three or more frequencies can be used to determine critical physical and geometrical parameters of the relativistic jet origin.
The core shift induced by synchrotron self-absorption extends over the entire spectral range and has an immediate effect on astrometric measurements made in the radio and optical domains. One particular issue likely to be affected by the core shift is the connection between the radio and optical positions of distant quasars. At present, the International Celestial Reference System (ICRS) is realized primarily by the International Celestial Reference Frame (ICRF, Ma et al., 1998; Fey et al., 2004) based on very long baseline interferometry (VLBI) measurements at 2.3 GHz (13 cm band) and 8.6 GHz (3.6 cm band). The present extension of the ICRF to visible light is based on the Hipparcos Catalogue, with rms uncertainties estimated to be 0.25 mas yr-1 in each component of the spin vector of the frame and 0.6 mas in the components of the orientation vector at the catalogue epoch, J1991.25 (Kovalevsky et al., 1997). The link between the VLBI and Hipparcos reference frames and its accuracy is discussed by Lestrade et al. (1995). In the near future, new optical astrometric reference frames will be established by the GAIA astrometry mission (Lindegren & Perryman, 1996) and the Space Interferometry Mission (SIM, Shao, 1998). Both missions will explore largely the 3000 Å–10000 Å range corresponding to (0.3– GHz. GAIA will measure optical positions of about 500,000 distant quasars with mas accuracy, similar to the accuracy of radio source positions from the ICRF and the VLBA111Very Long Baseline Array of the National Radio Astronomy Observatory Calibrator Survey (Beasley et al., 2002; Fomalont et al., 2003; Petrov et al., 2005, 2006; Kovalev et al., 2007; Petrov et al., 2008). SIM is expected to deliver high precision astrometric positions of bright quasars at as accuracy and a target accuracy of as is envisaged for the radio-optical alignment (Unwin, 2005). For both of these missions, an important problem will be matching the optical catalogues to the radio astrometry catalogues based on precise positions of compact extragalactic objects and determining mutual rotations, distortions and zonal systematic errors (e.g. Fey et al., 2001; Souchay et al., 2006; Lambert et al., 2006; Frey et al., 2006; Bourda et al., 2007). This match relies on an assumption that the dominating component of emission in both the radio and optical bands is physically the same region (see sect. 3.4 for detailed discussion).
The core shift is expected to introduce systematic offsets between the radio and optical positions of reference sources, affecting strongly the accuracy of the radio-optical matching of the astrometric catalogues. The magnitude of the core shift can exceed the inflated errors of the radio and optical positional measurements by a large factor. This makes it necessary to perform systematic studies of the core shift in the astrometric samples in order to understand and remove the contribution of the core shift to the errors of the radio-optical position alignment.
Measurements of the core shift have been done so far only in a small number of objects (e.g., Marcaide et al., 1994; Lara et al., 1994; Porcas & Rioja, 1997; Lobanov, 1996, 1998b; Paragi et al., 2000; Ros & Lobanov, 2001; Bietenholz et al., 2004; Kadler et al., 2004). In this paper, we present for the first time results for 29 compact extragalactic radio sources used in VLBI astrometric studies. In Sect. 2 we describe global VLBI data, the source sample, and the method of measurement used in this paper, and present results of the core shift measurements. In Sect. 3 we discuss astrophysical applications of the frequency-dependent core shift (Sect. 3.1), variability of the shift resulting from nuclear flares (Sect. 3.2), effect of the shift on multi-frequency VLBI studies (Sect. 3.3). We investigate the influence of this effect on the radio-optical reference frame matching and suggest a method to compensate for it (Sect. 3.4). We summarize our results in Sect. 4.
2 Core shift measurements
We have imaged and analyzed 277 sources from geodetic RDV222Research and Development VLBA experiments (see, e.g., Gordon, 2005). observations made in 2002 and 2003 — ten 24 hr-long experiments on 16 January 2002, 6 March 2002, 8 May 2002, 24 July 2002, 25 September 2002, 11 December 2002, 12 March 2003, 7 May 2003, 18 June 2003. Geodetic RDV sessions feature simultaneous observations at 2.3 GHz and 8.6 GHz (S and X bands) with a global VLBI network at right circular polarization. This includes for every session the VLBA and up to nine other radio telescopes from the following list: Algonquin Park (46 m), Gilcreek (26 m), HartRAO (26 m), Kokee (20 m), Matera (20 m), Medicina (32 m), Noto (32 m), Ny Alesund (20 m), Onsala (20 m), TIGO (6 m), Tsukuba (32 m), Westford (18 m), Wettzell (20 m). The data processing technique and imaging results are described by Pushkarev & Kovalev (2008).
This long-term RDV program is one of the best choices for a large project to measure two-frequency core shifts on the basis of open archival raw VLBI data for several reasons: (i) it is optimized to have a good (,)-coverage, (ii) it has the maximum possible resolution for ground-based VLBI at these frequencies, (iii) the frequency ratio between the simultaneously observed bands is high (3.7), and (iv) the core shift per unit of frequency between 2.3 and 8.6 GHz is larger than that at higher frequencies because of opacity effects (see, e.g., Lobanov, 1998b).
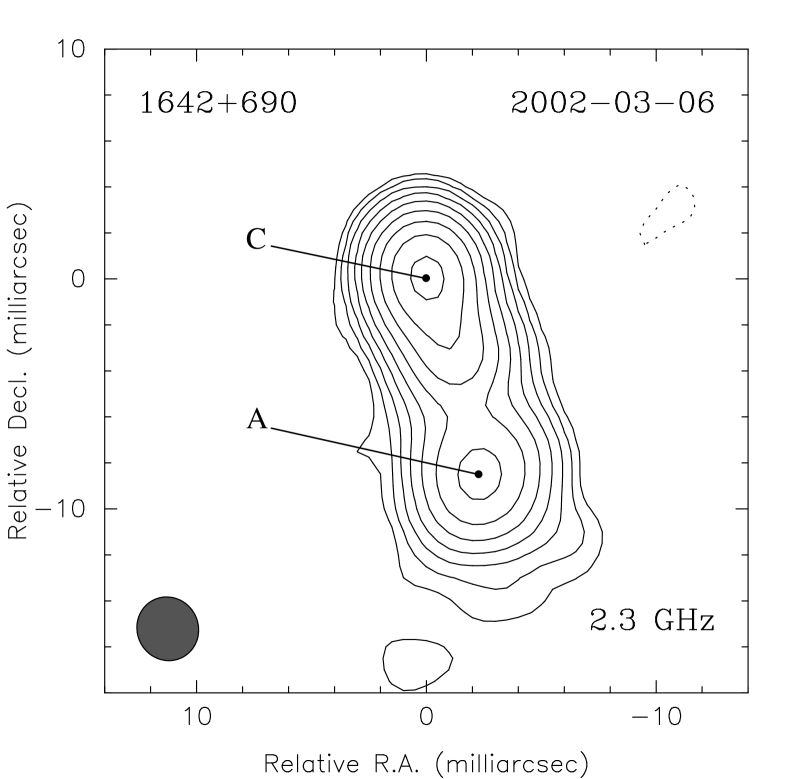
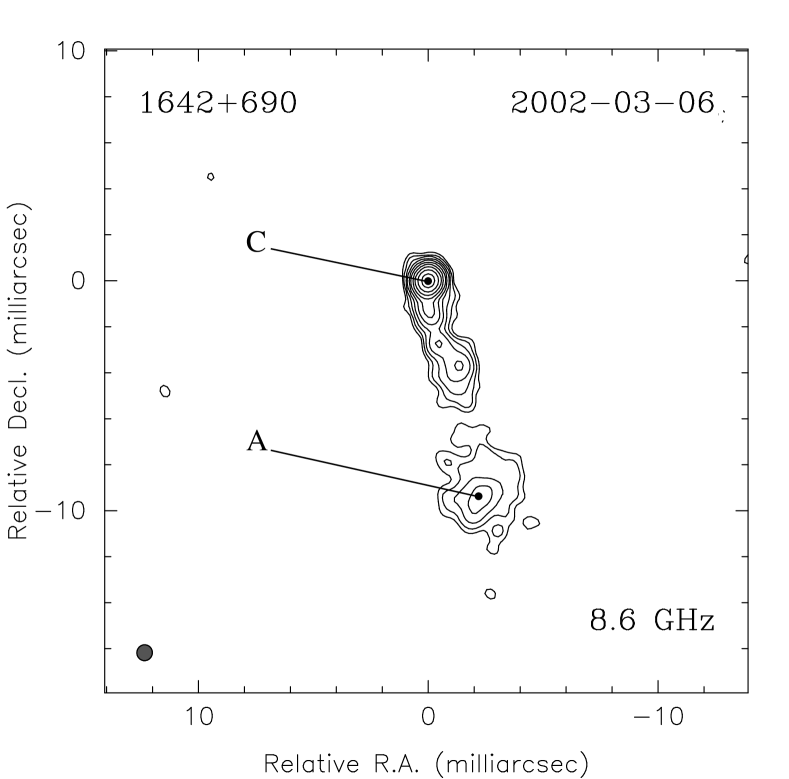
We have measured the frequency-dependent core shift by model-fitting the source structure with two-dimensional Gaussian components (Pearson, 1999) and referencing the position of the core component to one or more jet features, assuming the latter to be optically thin and having frequency-independent peak positions (Fig. 1). The method is illustrated in Fig. 2, where astrometric S/X images of 1642+690 are shown, with positions marked for the VLBI core (‘C’) and jet feature (‘A’).
| IAU name | J2000.0 | J2000 | redshift | Observing | Core shifta (mas) |
|---|---|---|---|---|---|
| R.A. | Decl. | epoch | between 2.3 and 8.6 GHz | ||
| 0003$-$066 | 00:06:13.893 | 06:23:35.335 | 0.347 | 2003-05-07 | |
| 2003-09-17 | |||||
| 0118$-$272 | 01:20:31.663 | 27:01:24.652 | 0.557 | 2003-03-12 | |
| 0148$+$274 | 01:51:27.146 | 27:44:41.794 | 1.26 | 2002-09-25 | |
| 0202$+$149 | 02:04:50.414 | 15:14:11.044 | 0.405 | 2002-03-06 | |
| 0239$+$108 | 02:42:29.171 | 11:01:00.728 | 2.680 | 2003-06-18 | |
| 0342$+$147 | 03:45:06.417 | 14:53:49.558 | 1.556 | 2002-01-16 | |
| 0425$+$048 | 04:27:47.571 | 04:57:08.326 | 0.517 | 2002-09-25 | |
| 0430$+$052 | 04:33:11.096 | 05:21:15.619 | 0.033 | 2003-06-18 | |
| 2003-09-17 | |||||
| 0507$+$179 | 05:10:02.369 | 18:00:41.582 | 0.416 | 2002-07-24 | |
| 0607$-$157 | 06:09:40.950 | 15:42:40.673 | 0.324 | 2002-01-16 | |
| 2002-01-16 | |||||
| 0610$+$260 | 06:13:50.139 | 26:04:36.720 | 0.580 | 2002-12-11 | |
| 2002-12-11 | |||||
| 0736$+$017 | 07:39:18.034 | 01:37:04.618 | 0.191 | 2003-05-07 | |
| 0839$+$187 | 08:42:05.094 | 18:35:40.991 | 1.272 | 2003-03-12 | |
| 0850$+$581b | 08:54:41.996 | 57:57:29.939 | 1.322 | 1997-01-10 | |
| 0952$+$179 | 09:54:56.824 | 17:43:31.222 | 1.478 | 2002-01-16 | |
| 1004$+$141 | 10:07:41.498 | 13:56:29.601 | 2.707 | 2002-01-16 | |
| 2003-05-07 | |||||
| 1049$+$215 | 10:51:48.789 | 21:19:52.314 | 1.300 | 2002-01-16 | |
| 1147$+$245 | 11:50:19.212 | 24:17:53.835 | 0.200 | 2003-05-07 | |
| 1219$+$285 | 12:21:31.691 | 28:13:58.500 | 0.102 | 2002-03-06 | |
| 1642$+$690 | 16:42:07.849 | 68:56:39.756 | 0.751 | 2002-01-16 | |
| 2002-03-06 | |||||
| 2003-05-07 | |||||
| 1656$+$053 | 16:58:33.447 | 05:15:16.444 | 0.879 | 2002-09-25 | |
| 1655$+$077 | 16:58:09.011 | 07:41:27.541 | 0.621 | 2002-07-24 | |
| 1803$+$784 | 18:00:45.684 | 78:28:04.018 | 0.680 | 2002-05-08 | |
| 2002-05-08 | |||||
| 1830$+$285 | 18:32:50.186 | 28:33:35.955 | 0.594 | 2002-03-06 | |
| 1845$+$797 | 18:42:08.990 | 79:46:17.128 | 0.057 | 2002-01-16 | |
| 2002-01-16 | |||||
| 1926$+$087 | 19:28:40.855 | 08:48:48.413 | … | 2002-03-06 | |
| 2021$+$317 | 20:23:19.017 | 31:53:02.306 | … | 2002-07-24 | |
| 2143$-$156 | 21:46:22.979 | 15:25:43.886 | 0.698 | 2002-05-08 | |
| 2155$-$152 | 21:58:06.282 | 15:01:09.328 | 0.672 | 2003-09-17 |
Column designation:
Col. 1 – IAU source name (B1950),
Col. 2 – Right Ascension (J2000),
Col. 3 – Declination (J2000),
Col. 4 – redshift as given by Véron-Cetty & Véron (2006) with the following exceptions:
the redshifts for 0239+108, 0342+147, 1147+245,
2320+506 are taken from Sowards-Emmerd et al. (2005); the redshift for
0425+048 is taken from Afanasiev et al. (2003),
Col. 5 — epoch at which the shift was measured (YYYY-MM-DD),
Col. 6 – shift of the VLBI core position (mas) between 2.3 and 8.6 GHz
and its error.
If the shift is measured relative to two different jet features, two
independent values for the same epoch are given.
a
Positive values of the shift mean that the distance between the core
and the jet feature measured at 8.6 GHz is greater than the one measured
at 2.3 GHz.
b The measurement for this source is based
on our imaging results of the NRAO archival data from the VLBA only
S/X project BF025 (see description of the BF025 program in Fey & Charlot, 2000).


D. C. Homan and Y. Y. Kovalev (in prep.) have made tests comparing core shifts measured in the quasars 1655$+$077 and 2201$+$315 with relative astrometry (phase referencing to a calibrator source) to those obtained as here from self-calibrated images by referencing the core to optically thin jet features. The core shifts obtained using these two methods agreed within the errors. This result indicates that self-calibrated images provide sufficient accuracy for measuring the core shift and can be used for a systematic study of this effect. However, the VLBI phase referencing method is required for jets whose structure does not allow the self-referencing technique to be applied.
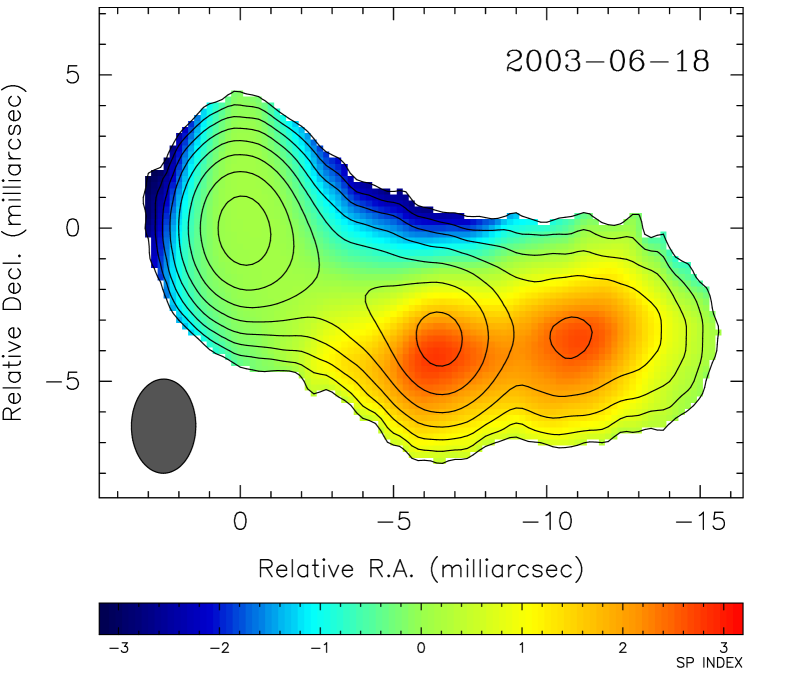
Other approaches have also been tried. Rioja et al. (2005) have proposed a “source/frequency phase referencing” method for measuring the core shift, which could be particularly useful while working at higher radio frequencies. Walker et al. (2000) performed a 2-D cross-correlation analysis in order to align VLBA images of 3C~84 measured at different frequencies with a formal accuracy less than 5 as, see also discussion of this method by Croke & Gabuzda (2008). However, the real error margins of the cross-correlation method are certainly substantially larger, as this method requires the assumption that there are no large variations in observed spectral index along the jet (if the core region is blended) which is not the case for many extragalactic jets (see, e.g., the reconstructed spectral index gradient along the jet for 3C~120 in Fig. 7).
We have measured core shifts between 2.3 and 8.6 GHz in 29 AGN (see Fig. 3 and Table 1), with the resulting values of the shift ranging between and 1.4 mas and the median value for the sample of 0.44 mas. Errors of the core shift measurements presented in Table 1 are estimated from the uncertainties of component positions calculated following Fomalont (1999). The robustness of the measurements is supported by the following observation. In objects with several bright jet components, similar core shift values within errors are obtained from referencing the core position to different jet features. The core shift measurements for these objects are indicated by separate symbols in the top panel of Fig. 4. In objects observed more than once, comparable core shift values are obtained from referencing the core position to the same jet feature at different observing epochs (see sect. 3.2 for details on a possible core shift variability). In both cases, no systematic dependencies are observed (Fig. 4), implying that measured core shift values do not depend on the component location and features cross-identified between the two frequency bands S/X have similar position angles (). In order to further ensure the fidelity of the measurements made, we have also performed an independent check by analyzing spectral index images with and without core shift applied and dropping all objects in which application of the core shift resulted in unphysical values of the spectral index (see details below).
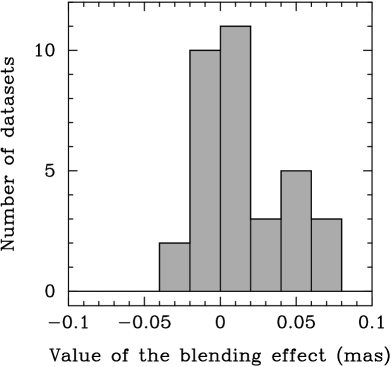
The difference in resolution and corresponding angular size of the restoring VLBI beam at 2.3 GHz and 8.6 GHz could lead to a systematical apparent (not real) shift of the core position due to resolution-dependent blending of the core and optically thin parts of the jet. To estimate the magnitude of this effect, we have downgraded the resolution of 8.6 GHz data to the one of the 2.3 GHz band by setting the maximum (,)-radius at 8.6 GHz to about 75 M. Then the 8.6 GHz model was re-fitted for every source and epoch from Table 1 by varying all free parameters. These models were compared to the original 8.6 GHz ones, and the magnitude of the core shift due to blending was calculated. Distribution of these blending shifts of the core position along the jet axis at 8.6 GHz is presented in Figure 5. The median value for this blending effect is mas which is much less than the typical error of the core-shift measurements presented in this paper (Table 1).
For about 90 percent of the 277 objects imaged, no reliable estimates of core shifts have been obtained. All of these objects satisfy one or more of the following five conditions:
-
1)
The core and jet features could not be extracted reliably at one or both frequency bands because of components blending, or a smooth or weak jet.
-
2)
The same structures at both bands could not be identified reliably.
-
3)
Modeling by two-dimensional Gaussians is not adequate due to the complexity of the observed brightness distribution.
Decision on every of the items 1) to 3) is made on the basis of our analysis of two-frequency model parameters and their errors, values of fits of models to calibrated visibility datasets, as well as comparison of residual images after a model is subtracted with the imaging noise (Fomalont, 1999; Pearson, 1999). -
4)
Jet components may be partially opaque (spectral index , ) and as a result of this their positions change with frequency.
-
5)
Application of derived core shift value results in unphysical values of the spectral index. This implies large optical depth observed in extended jet regions (), and/or optically thin core region (), and/or steep and irregular gradients across the jet.
The goal of this study is to provide and analyze most reliable core shift detections and therefore such stringent selection criteria are applied to reduce the chance of an erroneous measurement. Based on these considerations, we deem acceptable the relatively low percentage (about 10 percent of the sample) of positive measurements. A designated study with significantly higher rate of successful core shift detections would require dedicated, time consuming, multi-band VLBI experiments with phase referencing. We estimate that about 6 hours of VLBA time per source will be needed in this case, assuming the current sustainable recording data rate of 128 Mbps. The time requirements would be shorten significantly after the VLBA recording system is upgraded for operations at a 4 Gbps recording rate.
3 Physics and astrometry with the core shift
The effect of frequency-dependence of the core position has an immediate connection to several physical and astrometric studies using compact extragalactic radio sources. Systematic observations of the core shift in a sample of compact jets can be used for probing the conditions in the compact jets and nuclear regions in AGN and understanding the effect the shift may have on the alignment of the radio and optical reference frames.
3.1 Deriving physical properties of the opaque jet base and absorbing material
If the core shifts and the power index are measured from VLBI observations at more than two frequencies, the magnetic field strength and distribution can be reconstructed in the ultra-compact regions of the jets (Lobanov, 1998b). The offset of the observed core positions from the true base of the jet as well as the distance from the nucleus to the jet origin can also be derived (Lobanov, 1998b). Estimates of the total (kinetic + magnetic field) power, synchrotron luminosity and the maximum brightness temperature, , in the jets can be made. The ratio of particle energy to magnetic field energy can also be estimated, from the derived . This information enables testing of the Königl (1981) model and several of its later modifications (e.g., Hutter & Mufson, 1986; Bloom & Marscher, 1996). The estimated distance from the nucleus to the jet origin constrains the self-similar jet model (Marscher, 1995) and the particle-cascade model (Blandford & Levinson, 1995). This approach can also be applied to determine the matter content in parsec-scale jets (Hirotani et al., 2000; Hirotani, 2005).
If the core shifts are measured at four or more frequencies, the absolute geometry of the jet can be determined, giving the absolute offset, [pc], of the core from the central engine. Combined with the value for magnetic field, [G], this gives an estimate for the mass of the central black hole (Lobanov, 1998b).
Density and pressure gradients in the jet and external absorption can lead to deviations in from unity. If the changes in with frequency are measured with sufficient precision, they can be used to estimate the size, particle density and temperature of the absorbing material surrounding the jets (Lobanov, 1998b). These estimates can be compared with the black hole masses and BLR sizes obtained from reverberation mapping and applications of the relation established between the black hole mass and various kinematic properties of central regions in AGN (c.f., Peterson & Bentz, 2006).
3.2 Nuclear flares and core shift

Opacity in the compact jet can be changed substantially if the source undergoes a nuclear flare. This can affect the observed position of the core at a given frequency and modify the core shift between different frequencies. The magnitude of this effect can be estimated using the following argument. Let us assume that, during a flare, the compact jet does not change its orientation and opening angle. Then, following Lobanov (1998b), the magnitude of the core shift is
| (1) |
where is the flux density of the core and , , are the speed, Lorentz factor and Doppler factor of the jet, respectively. The flux density of the core is , where is the magnetic field in the core region, is the particle density of the jet plasma and is the spectral index. It follows immediately that
| (2) |
It has been shown that nuclear flares are likely to be produced by particle density variations in the compact jet, while the Doppler factor and magnetic field change only weakly (Lobanov & Zensus, 1999). Thus, it can be expected that, in the simplest case . This proportionality can be measured from comparison of core shifts measured in the same object at different epochs, yielding a power index .
In our data, core shifts can be compared at multiple epochs only in four objects, at five instances altogether (see Table 1). The ratios of the core shifts measured at different epochs in the same objects are plotted in Fig. 6 against the respective ratios of the core flux density at 8.6 GHz. Ideally, the ratios of core shifts should approach unity as the flux density ratio approaches unity. This is not the case in Fig. 6, implying that flares in compact jets involve changes not only in the density of the plasma but also in its physical properties. This can be further examined by analyzing the slope of the relation plotted in Fig. 6.
The measurements plotted in Fig. 6 indicate a positive trend, with larger core shifts for higher core flux density. A linear fit shown in Fig. 6 corresponds to , which is larger than the value of 2/3 expected for nuclear flares resulting entirely from plasma density variations in the flow. This may imply that flaring jets contain a hotter plasma or stronger magnetic field. However, the small number of data points in the present plot results in large errors and precludes making any conclusions about the physical meaning of the fit, and we present it here only as an example of the effect nuclear flares may have on the core shift. This effect certainly deserves a more comprehensive study.
3.3 Effect of the core shift on multi-frequency VLBI studies
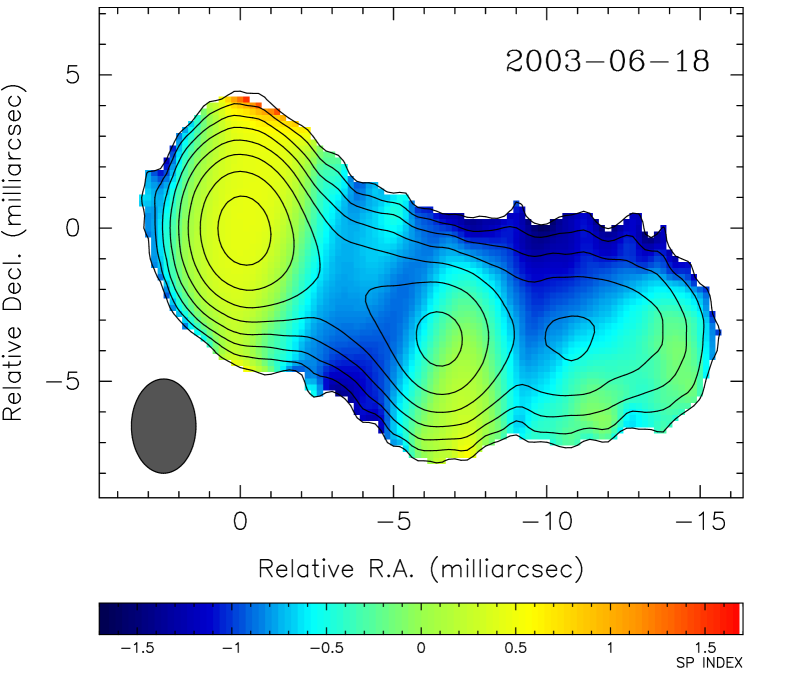
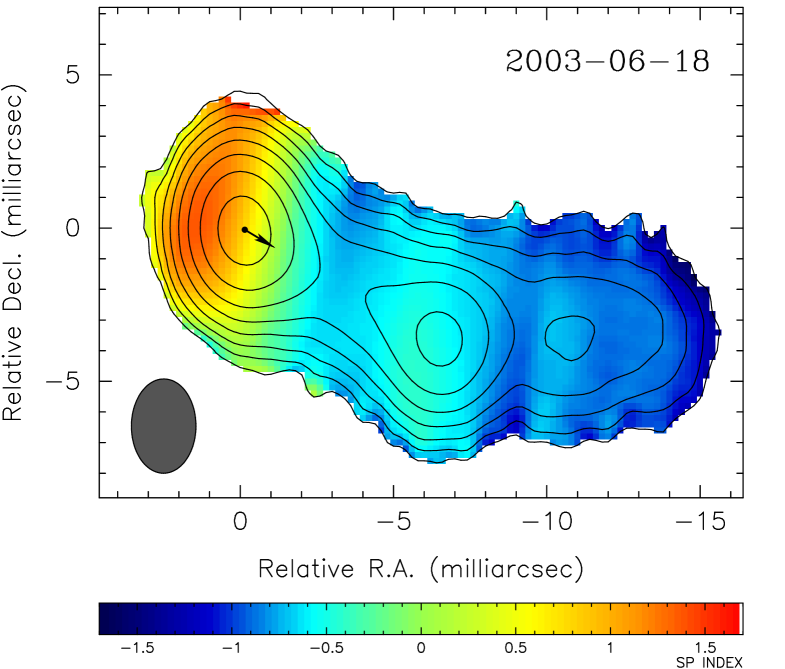
In VLBI observations, application of the self-calibration technique based on closure phases (e.g., Jennison, 1958; Readhead & Wilkinson, 1978) results in a loss of information about absolute positions of target objects. In this situation, multi-frequency VLBI images are often aligned at the apparent position of the core at different frequencies (i.e., assuming implicitly a zero core shift). In the case of a non-zero core shift, this approach may undermine the results of any study based on multi-frequency VLBI data (e.g. spectral imaging and Faraday rotation measurements). It has been shown that accounting for the core shift is critical for spectral index imaging (Lobanov, 1996, 1998b) and synchrotron turnover frequency imaging (Lobanov et al., 1997; Lobanov, 1998a). The effect of the core shift is illustrated by Fig. 7–8 for radio spectral index images of the jet in 3C~120. The spectral index image (Fig. 7) and the spectral index profile along the jet ridge line (Fig. 8) obtained without accounting for the core shift can clearly result in misleading conclusions about the physical conditions in the jet flow. Therefore, the alignment of VLBI images should be given proper consideration in all studies involving multi-frequency measurements.
At present, the S/X band VLBI astrometry programs (e.g., Ma et al., 1998; Fey et al., 2004; Beasley et al., 2002; Fomalont et al., 2003; Petrov et al., 2005, 2006; Kovalev et al., 2007) employ an implicit assumption that the source positions are the same for both bands (i.e., all objects are assumed to be point-like, optically thin radio sources). However, both the core shift and the source structure should be taken into account in order to achieve a higher positional accuracy of VLBI astrometry. This issue regarding the source structure was discussed by Charlot (1990). The likely time variability of the core shift (due to flaring activity of the nucleus, Sect. 3.2) may lead to even larger errors in positional accuracy of repeated astrometric VLBI experiments (e.g., the RDV project) and must be also taken into account.

3.4 Radio-optical alignment of astrometric positions
The core shift issue becomes an even more important factor when the radio reference frame needs to be connected to an optical reference frame. So far the link is based on the study of optically bright radio-emitting stars which are seen both by Hipparcos and VLBI (see, e.g., Lestrade et al., 1995; Johnston & de Vegt, 1999; Ros, 2005). Future accurate alignment of the frames has to rely on using compact radio sources in distant quasars (e.g., Fey et al., 2001; Bourda et al., 2007).
Below, we discuss the alignment problem for compact extragalactic radio sources. We assume that the dominating component in both the radio and optical bands is the synchrotron self-absorbed compact jet origin (core). Broad-band modeling of blazar spectral energy distribution supports this hypothesis (see, e.g., recent review by Böttcher, 2007). High-resolution VLBI observations of nearby AGN imply that the jet is formed and emitting in the radio already at distances of gravitational radii from the central engine (e.g. Junor et al., 1999; Kadler et al., 2004). Thus the physical offset between the jet base and the central nucleus is much smaller than the positional shift due to opacity in the jet (the latter can be larger than 1 pc). This implies that the offset between radio and optical positions of reference quasars will be dominated by the core shift even if the optical emission comes from the accretion disk around the central nucleus.
The magnitude of the core shift, , between two arbitrary frequencies and () caused by synchrotron self-absorption can be predicted for an object with known synchrotron luminosity, , of the compact jet (Lobanov, 1998b):
| (3) | |||||
where is the luminosity distance to the object, and are the jet speed and Lorentz factor, is the angle between the jet velocity vector and the line of sight, is the jet opening angle and describes the extent, , of the compact jet.
If not corrected for, the core shift will introduce an additional additive error factor in the alignment of the radio and optical reference frames. The magnitude of this error can be estimated from the following considerations. If the two reference frames are aligned using a sample of AGN with compact radio jets, the expected mean offset of the source position caused by the core shift can be calculated from equation (3). For this calculation, the sample averages , and can be applied. A conservative estimate of the jet opening angle can be made, assuming that the jet has a Mach number . A typical compact jet extent of (Lobanov, 1998b) can be adopted for all objects. It should also be noted that this parameter contributes to the result of the calculation only logarithmically.
If the sources are selected from a flux density limited sample, the distribution of their orientations will be affected by the Doppler boosting (Vermeulen & Cohen, 1994; Kellermann et al., 2004; Cohen et al., 2007), with the resulting maximum viewing angle given by:
| (4) |
where is the intrinsic brightness temperature of the jet, is the minimum detectable brightness temperature in the observations, and is the spectral index of the radio emission (Lobanov et al., 2000). In the cores of the VLBI jets, K (Lobanov et al., 2000; Kovalev et al., 2005; Homan et al., 2006), and typical VLBI snapshot observations reach K (Lobanov et al., 2000).
With the assumptions described above, equation (3) can be used to calculate the average core shift expected from observations of a flux density limited sample of extragalactic objects:
| (5) | |||||
where is the metric (or “proper motion”) distance to the object and evaluates the term at a “median” angle of the sample, , determined from the condition .
| [deg] | [deg] | [mas] | [mas] | [ erg/s] | |
|---|---|---|---|---|---|
| 5 | 107.4 | 37.4 | 0.13 | 0.05 | 6.2 |
| 10 | 69.2 | 23.2 | 0.19 | 0.07 | 3.5 |
| 15 | 55.2 | 17.8 | 0.23 | 0.08 | 2.6 |
| 20 | 47.4 | 14.8 | 0.26 | 0.10 | 2.2 |
| 25 | 42.1 | 12.9 | 0.28 | 0.11 | 2.0 |
| 30 | 38.3 | 11.5 | 0.30 | 0.12 | 1.8 |
Column designation: — jet Lorentz factor; — maximum viewing angle for detection; — median viewing angle for a sample with random orientation; — average shift expected between 2.3 GHz and 8.6 GHz; — average shift expected between 8.6 GHz and 6000 Å. All parameters are calculated for a sample with erg/s, Gpc (). The last column lists the mean synchrotron luminosities required to reconcile the predicted with the median value of the core shift (0.44 mas) measured in the data presented in this paper.
Table 2 gives average core position shifts expected between 2.3 GHz and 8.6 GHz and between 8.6 GHz and 6000 Å for an average synchrotron luminosity of erg s-1 (Lobanov, 1998b) and a quasar sample peaking at a redshift . The shifts are calculated for several different values of ranging from 5 to 30. The average 2.3–8.4 GHz core shift of 0.3 mas predicted for is close to the mean value of 0.44 mas measured from our data. The direct comparison of these two values is not strictly valid, as our measurements are not done for a complete sample. We can note however that this discrepancy can be easily reconciled by allowing for small variations of the model parameters (i.e. varying the mean luminosity of the sample, as illustrated in Table 2). With this assumption, the maximum measured value of the 2.3–8.4 GHz core shift can be readily explained by a one sigma deviation from the mean in a sample of compact jets with a Gaussian distribution of Lorentz factors characterized by and .
It is immediately seen from Table 2 that the average shifts between the radio and optical bands are comparable to the positional accuracy of VLBI and GAIA, and significantly exceed that of SIM. These numbers, albeit not definite and assumption-dependent, imply that the core shifts should be carefully investigated, and corrected for, before attempting to make a connection between the ICRF and the reference frames that will be produced by GAIA and SIM.
To achieve this goal, a coordinated program should be established, aiming at defining a Primary Reference Sample (PRS) of extragalactic objects to be used for radio-optical reference frame alignment and investigating the magnitude and variability of the core shift in this sample. This would require making multi-frequency and multi-epoch VLBI observations of the PRS in order to measure the core shifts and monitor their variability for a period of time comparable with the mission duration of GAIA and SIM. Additional VLBI observations of the sample would have to be done contemporaneously with the optical measurements.
The accuracy of the determination of the optical position of the core from radio measurements can be assessed in the following way. Let there be measurements of core shift between radio frequencies (). Then the core position at an arbitrary frequency can be determined from the core offset measure, (see definition in Lobanov, 1998b), provided that for all measurements (this ensures that the accuracy of extrapolation does not depend on the actual wavelength to which the core position is extrapolated). The error, , can be estimated from
| (6) |
where is the positional measurement accuracy at the lowest frequency, , in the data set. For typical VLBI measurements (, ) spanning four frequencies from 8 GHz to 43 GHz, we estimate mas, with referencing the core position to an optically thin feature in the jet (measurements at 2 GHz and 5 GHz may still be required for monitoring at lower frequencies and verifying that it is not variable). For relative astrometry VLBI measurements with phase referencing, we obtain mas, assuming that measurements are done at four frequencies between 5 GHz and 22 GHz and respective positional errors are the typical ones reported by Fomalont (2005) for the case of one phase reference calibrator at a distance of from the target. These estimates indicate that extrapolating core shifts to optical wavelengths can be done with sufficient accuracy for astrometric applications.
If the core shift effect is not corrected for, reaching the accuracy goal for the radio-optical alignment would require increasing the number of reference sources by some factor. Using the average radio-optical core shift in Table 2, we estimate this factor to be about 3.5 and 4.5 for the alignment of the ICRF reference frame with the reference frames of GAIA and SIM, respectively. These values may be reduced by about 20 percent, if individual radio-optical position offsets are weighted appropriately with respect to the radio jet direction (e.g., Kovalev et al., 2005) along which the core is expected to shift. But even then it would require a substantial increase in the number of reference objects required for reaching the sufficient accuracy of the alignment.
4 Summary
Measurements of the frequency-dependent shift of the parsec-scale jet cores in AGN are reported for 29 bright extragalactic radio sources. It is shown that the shift can be as high as 1.4 mas between 2.3 and 8.6 GHz. If not taken into account, such core shifts could influence and corrupt both astrophysical (e.g., spectral imaging and Faraday rotation imaging) and astrometric studies. It is shown that nuclear flares can result in temporal variability of the core shift. Analysis of this effect can shed light on the physics of the flares. The core shifts are likely to influence the positional accuracy of the radio reference frame and pose problems for connecting radio and optical reference frames. The next steps in this study are to measure core shifts in a complete flux-density-limited sample of bright extragalactic radio sources, to estimate physical parameters from the measured shifts and to look for their temporal variations. We plan to achieve these goals by combining together further analysis of RDV VLBA S/X datasets, four-frequency (8.1, 8.4, 12, & 15 GHz) MOJAVE-2 VLBA observations333http://www.physics.purdue.edu/astro/MOJAVE/ in 2006, and dedicated multi-frequency 1.4–15 GHz VLBA observations in 2007 of more than half of the objects in Table 1.
We have estimated from theory an average shift between the radio (4 cm) and optical (6000 Å) bands to be approximately 0.1 mas for a complete sample of radio selected AGN. The robustness of this prediction is supported by the fact that the same method gives an average core shift of 0.2 to 0.3 mas between 2.3 and 8.6 GHz, which agrees well with the median shift of 0.44 mas reported by us here for a non-complete sample of 29 AGN.
The estimated radio-optical core shift is comparable to the positional accuracy of GAIA and significantly exceeds that of SIM. It implies that the core shift effect should be carefully investigated, and corrected for, in order to align accurately the radio and optical positions. We suggest two possible approaches to tie the radio and optical reference frames together. 1) In the first approach, multi-frequency VLBI measurements can be used for calculating the projected optical positions, assuming that the radio and optical emission regions are both dominated by a spatially compact component marginally resolved with VLBI and SIM and point-like for GAIA. The core shift measurements of the objects are required to be made quasi-simultaneously with astrometric measurements of their positions. The discrepancies between the measured optical and radio positions can then be corrected for the predicted shifts, and the subsequent alignment of the radio and optical reference frames can be done using standard procedures. 2) A more conservative approach may also be applied, by employing the VLBI observations to identify, and include in the Primary Reference Sample, only those quasars in which no significant core shift has been detected in multi-epoch experiments. Either of the two approaches should lead to substantial improvements of the accuracy of the radio-optical position alignment.
Acknowledgements.
This work is based on the analysis of global VLBI observations including the VLBA, the raw data for which were provided to us by the open NRAO archive. The National Radio Astronomy Observatory is a facility of the National Science Foundation operated under cooperative agreement by Associated Universities, Inc. Y. Y. Kovalev is a Research Fellow of the Alexander von Humboldt Foundation. Y. Y. Kovalev was supported in part by the Russian Foundation for Basic Research (projects 05-02-17377 and 08-02-00545). We would like to thank Patrick Charlot, Ed Fomalont, José Carlos Guirado, Jon Marcaide, Leonid Petrov, Richard Porcas, Eduardo Ros as well as the NASA GSFC VLBI group and the MOJAVE team for fruitful discussions. We thank the anonymous referee for thoughtful reading and useful comments which helped to improve the manuscript. This research has made use of the NASA/IPAC Extragalactic Database (NED) which is operated by the Jet Propulsion Laboratory, California Institute of Technology, under contract with the National Aeronautics and Space Administration. This research has made use of NASA’s Astrophysics Data System.References
- Afanasiev et al. (2003) Afanasiev, V. L., Dodonov, S. N., Moiseev, A. V., et al. 2003, Astronomy Reports, 47, 458
- Beasley et al. (2002) Beasley, A. J., Gordon, D., Peck, A. B., et al. 2002, ApJS, 141, 13
- Bietenholz et al. (2004) Bietenholz, M. F., Bartel, N., & Rupen, M. P. 2004, ApJ, 615, 173
- Blandford & Königl (1979) Blandford, R. D. & Königl, A. 1979, ApJ, 232, 34
- Blandford & Levinson (1995) Blandford, R. D. & Levinson, A. 1995, ApJ, 441, 79
- Bloom & Marscher (1996) Bloom, S. D. & Marscher, A. P. 1996, ApJ, 461, 657
- Böttcher (2007) Böttcher, M. 2007, Ap&SS, 309, 95
- Bourda et al. (2007) Bourda, G., Charlot, P., Porcas, R., & Garrington, S. 2007, ArXiv e-prints 0711.3455
- Charlot (1990) Charlot, P. 1990, AJ, 99, 1309
- Cohen et al. (2007) Cohen, M. H., Lister, M. L., Homan, D. C., et al. 2007, ApJ, 658, 232
- Croke & Gabuzda (2008) Croke, S. M. & Gabuzda, D. C. 2008, MNRAS, in press
- Fey et al. (2001) Fey, A. L., Boboltz, D. A., Gaume, R. A., Eubanks, T. M., & Johnston, K. J. 2001, AJ, 121, 1741
- Fey & Charlot (2000) Fey, A. L. & Charlot, P. 2000, ApJS, 128, 17
- Fey et al. (2004) Fey, A. L., Ma, C., Arias, E. F., et al. 2004, AJ, 127, 3587
- Fomalont (1999) Fomalont, E. B. 1999, in Astronomical Society of the Pacific Conference Series, Vol. 180, Synthesis Imaging in Radio Astronomy II, ed. G. B. Taylor, C. L. Carilli, & R. A. Perley, 301–320
- Fomalont (2005) Fomalont, E. B. 2005, in Astronomical Society of the Pacific Conference Series, Vol. 340, Future Directions in High Resolution Astronomy, ed. J. Romney & M. Reid, 460–465
- Fomalont et al. (2003) Fomalont, E. B., Petrov, L., MacMillan, D. S., Gordon, D., & Ma, C. 2003, AJ, 126, 2562
- Frey et al. (2006) Frey, S., Veres, P., & Vida, K. 2006, Publications of the Astronomy Deparment of the Eotvos Lorand University, 17, 149
- Gordon (2005) Gordon, D. 2005, in Astronomical Society of the Pacific Conference Series, Vol. 340, Future Directions in High Resolution Astronomy, ed. J. Romney & M. Reid, 496–500
- Hirotani (2005) Hirotani, K. 2005, ApJ, 619, 73
- Hirotani et al. (2000) Hirotani, K., Iguchi, S., Kimura, M., & Wajima, K. 2000, ApJ, 545, 100
- Homan et al. (2006) Homan, D. C., Kovalev, Y. Y., Lister, M. L., et al. 2006, ApJ, 642, L115
- Hutter & Mufson (1986) Hutter, D. J. & Mufson, S. L. 1986, ApJ, 301, 50
- Jennison (1958) Jennison, R. C. 1958, MNRAS, 118, 276
- Johnston & de Vegt (1999) Johnston, K. J. & de Vegt, C. 1999, ARA&A, 37, 97
- Junor et al. (1999) Junor, W., Biretta, J. A., & Livio, M. 1999, Nature, 401, 891
- Kadler et al. (2004) Kadler, M., Ros, E., Lobanov, A. P., Falcke, H., & Zensus, J. A. 2004, A&A, 426, 481
- Kellermann et al. (2004) Kellermann, K. I., Lister, M. L., Homan, D. C., et al. 2004, ApJ, 609, 539
- Königl (1981) Königl, A. 1981, ApJ, 243, 700
- Kovalev et al. (2005) Kovalev, Y. Y., Kellermann, K. I., Lister, M. L., et al. 2005, AJ, 130, 2473
- Kovalev et al. (2007) Kovalev, Y. Y., Petrov, L., Fomalont, E. B., & Gordon, D. 2007, AJ, 133, 1236
- Kovalevsky et al. (1997) Kovalevsky, J., Lindegren, L., Perryman, M. A. C., et al. 1997, A&A, 323, 620
- Lambert et al. (2006) Lambert, S. B., Le Poncin-Lafitte, C., & Bouquillon, S. 2006, in SF2A-2006: Semaine de l’Astrophysique Francaise, ed. D. Barret, F. Casoli, G. Lagache, A. Lecavelier, & L. Pagani, 33–34
- Lara et al. (1994) Lara, L., Alberdi, A., Marcaide, J. M., & Muxlow, T. W. B. 1994, A&A, 285, 393
- Lestrade et al. (1995) Lestrade, J.-F., Jones, D. L., Preston, R. A., et al. 1995, A&A, 304, 182
- Lindegren & Perryman (1996) Lindegren, L. & Perryman, M. A. C. 1996, A&AS, 116, 579
- Lobanov & Zensus (2007) Lobanov, A. & Zensus, J. A. 2007, in Exploring the Cosmic Frontier, ESO Astrophysics Symposia, ed. A. P. Lobanov, J. A. Zensus, C. Cesarsky, & P. J. Diamond, 147–162
- Lobanov (1996) Lobanov, A. P. 1996, PhD thesis, New Mexico Institute of Mining and Technology, Socorro, NM, USA (1996)
- Lobanov (1998a) Lobanov, A. P. 1998a, A&AS, 132, 261
- Lobanov (1998b) Lobanov, A. P. 1998b, A&A, 330, 79
- Lobanov et al. (1997) Lobanov, A. P., Carrara, E., & Zensus, J. A. 1997, Vistas in Astronomy, 41, 253
- Lobanov et al. (2000) Lobanov, A. P., Krichbaum, T. P., Graham, D. A., et al. 2000, A&A, 364, 391
- Lobanov & Zensus (1999) Lobanov, A. P. & Zensus, J. A. 1999, ApJ, 521, 509
- Ma et al. (1998) Ma, C., Arias, E. F., Eubanks, T. M., et al. 1998, AJ, 116, 516
- Marcaide et al. (1994) Marcaide, J. M., Elosegui, P., & Shapiro, I. I. 1994, AJ, 108, 368
- Marscher (1995) Marscher, A. P. 1995, Proceedings of the National Academy of Science, 92, 11439
- Paragi et al. (2000) Paragi, Z., Fejes, I., & Frey, S. 2000, in International VLBI Service for Geodesy and Astrometry: 2000 General Meeting Proceedings, ed. F. Takahashi, 342
- Pearson (1999) Pearson, T. J. 1999, in Astronomical Society of the Pacific Conference Series, Vol. 180, Synthesis Imaging in Radio Astronomy II, ed. G. B. Taylor, C. L. Carilli, & R. A. Perley, 335–355
- Peterson & Bentz (2006) Peterson, B. M. & Bentz, M. C. 2006, New Astronomy Review, 50, 796
- Petrov et al. (2005) Petrov, L., Kovalev, Y. Y., Fomalont, E. B., & Gordon, D. 2005, AJ, 129, 1163
- Petrov et al. (2006) Petrov, L., Kovalev, Y. Y., Fomalont, E. B., & Gordon, D. 2006, AJ, 131, 1872
- Petrov et al. (2008) Petrov, L., Kovalev, Y. Y., Fomalont, E. B., & Gordon, D. 2008, ArXiv e-prints 0801.3895; AJ, in press
- Porcas & Rioja (1997) Porcas, R. W. & Rioja, M. J. 1997, in Proceedings of the 12th working meeting on European VLBI for Geodesy and Astrometry, ed. B. R. Pettersen, 133–143
- Pushkarev & Kovalev (2008) Pushkarev, A. B. & Kovalev, Y. Y. 2008, A&A, to be submitted
- Readhead & Wilkinson (1978) Readhead, A. C. S. & Wilkinson, P. N. 1978, ApJ, 223, 25
- Rioja et al. (2005) Rioja, M. J., Dodson, R., Porcas, R. W., Suda, H., & Colomer, F. 2005, in Proceedings of the 17th Working Meeting on European VLBI for Geodesy and Astrometry, ed. Vennebusch & Nothnagel, 125–130
- Ros (2005) Ros, E. 2005, in Astronomical Society of the Pacific Conference Series, Vol. 340, Future Directions in High Resolution Astronomy, ed. J. Romney & M. Reid, 482–488
- Ros & Lobanov (2001) Ros, E. & Lobanov, A. P. 2001, in Proceedings of the 15th Workshop Meeting on European VLBI for Geodesy and Astrometry. Institut d’Estudis Espacials de Catalunya, Consejo Superior de Investigaciones Científicas, Barcelona, Spain, ed. D. Behrend & A. Rius, 208
- Shao (1998) Shao, M. 1998, in Proc. SPIE, Astronomical Interferometry, ed. R. D. Reasenberg, Vol. 3350, 536–540
- Souchay et al. (2006) Souchay, J., Gontier, A. M., & Barache, C. 2006, A&A, 453, 743
- Sowards-Emmerd et al. (2005) Sowards-Emmerd, D., Romani, R. W., Michelson, P. F., Healey, S. E., & Nolan, P. L. 2005, ApJ, 626, 95
- Unwin (2005) Unwin, S. C. 2005, in Astronomical Society of the Pacific Conference Series, Vol. 338, Astrometry in the Age of the Next Generation of Large Telescopes, ed. P. K. Seidelmann & A. K. B. Monet, 37
- Vermeulen & Cohen (1994) Vermeulen, R. C. & Cohen, M. H. 1994, ApJ, 430, 467
- Véron-Cetty & Véron (2006) Véron-Cetty, M.-P. & Véron, P. 2006, A&A, 455, 773
- Walker et al. (2000) Walker, R. C., Dhawan, V., Romney, J. D., Kellermann, K. I., & Vermeulen, R. C. 2000, ApJ, 530, 233