.
Decay dynamics of quantum dots influenced by the local density of optical states of two-dimensional photonic crystal membranes
Abstract
We have performed time-resolved spectroscopy on InAs quantum dot ensembles in photonic crystal membranes. The influence of the photonic crystal is investigated by varying the lattice constant systematically. We observe a strong slow down of the quantum dots’ spontaneous emission rates as the two-dimensional bandgap is tuned through their emission frequencies. The measured band edges are in full agreement with theoretical predictions. We characterize the multi-exponential decay curves by their mean decay time and find enhancement of the spontaneous emission at the bandgap edges and strong inhibition inside the bandgap in good agreement with local density of states calculations.
Photonic crystals (PCs) are of fundamental importance due to their ability to modify the dynamics of light-matter interaction Yablonovitch1987a . The radiative lifetime of internal light sources can be controlled and the spatial emission pattern can be modified Lodahl2004a ; Fujita2005a ; Kaniber2007a ; Nikolaev2005a . These effects open up the possibility of improving the efficiency and compactness of devices such as light-emitting diodes (LEDs) Vahala2003a , and offer control of the propagation of single photons of use in, e.g., quantum information protocols Simon2007a . In order to determine the ultimate potential of PCs in such applications, a thorough understanding of light emitters in PCs is needed. Here we study systematically the spontaneous emission dynamics of quantum dots (QDs) in two-dimensional (2D) photonic crystal membranes (PCMs) and compare our results to theory. The radiative decay rate of a single QD inside the PCM is governed by the projected local density of optical states (LDOS) Sprik1996a . In order to probe variations herein, we investigate ensembles of QDs since in this case any dependence on the property of individual QDs is averaged out. Furthermore, QD ensembles provide good signal-to-noise ratio in the measurements and are important for large-volume applications such as PC lasers, LEDs, or solar cells. The projected LDOS varies with the position and orientation of the emitter inside the PCM Koenderink2006a , and a distribution of decay rates is expected to arise from the QD ensemble with a multi-exponential decay curve as a result. Such an effect has already been reported in 3D inverse opals using colloidal QDs Nikolaev2007a , but so far a systematic study of the decay curves in 2D PCMs exists only theoretically Koenderink2006a .
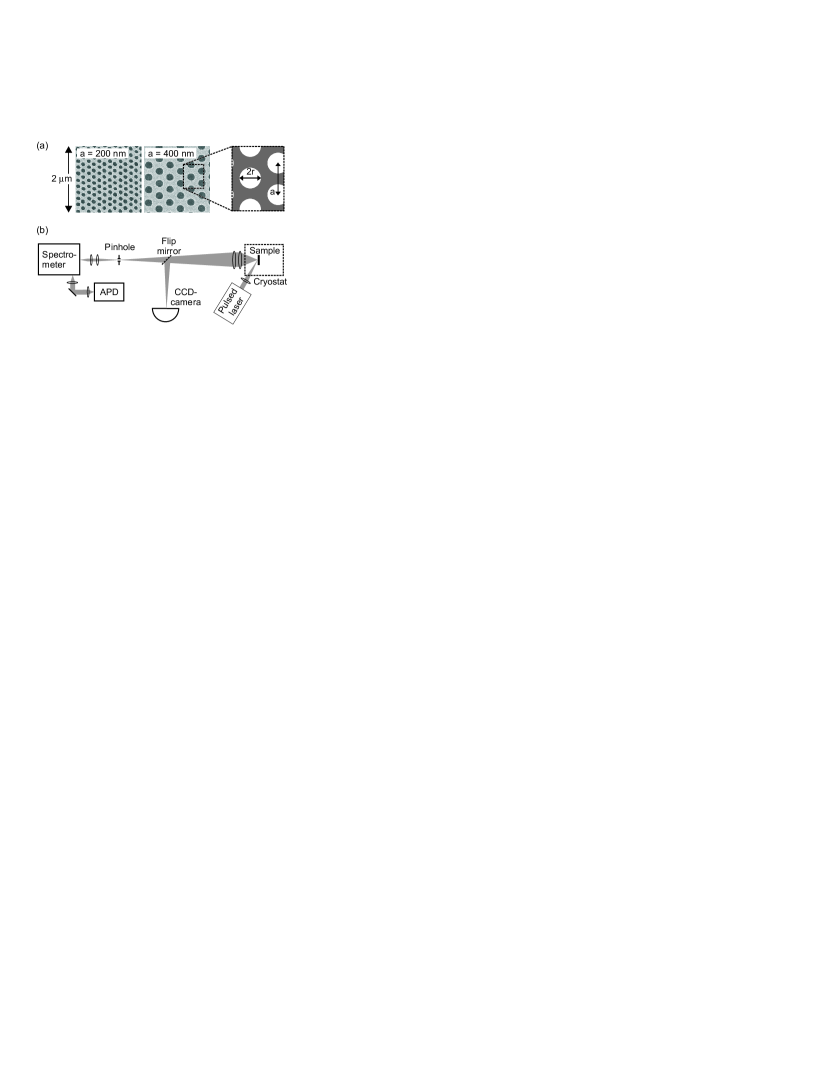
We consider ensembles of InAs QDs in GaAs PCMs that have been fabricated with systematically varied lattice constants. We optically excite the QDs within the membranes and detect the time-resolved spontaneous emission from a spectrally selected ensemble of approximately QDs. The dimension of each membrane is with thickness 150 nm. The QDs are grown by molecular beam epitaxy with density and centered within the membrane. The PCM consists of holes arranged in a triangular lattice, see Fig. 1(a), with hole radius, , and lattice constant (hole spacing), . All membranes in this experiment are in the range measured by scanning electron microscopy (SEM), and the lattice constant ranges from 180 to 470 nm in steps of 10 nm. The samples are placed in a closed-cycle cryostat keeping the temperature at 14 K. The QDs in the PCMs are excited in the GaAs barrier with a PicoQuant PDL-800 pulsed diode laser running at 781 nm with a repetition period of 100 ns. The chosen pump intensity corresponds to an upper estimate of 5-10 electron-hole pairs per QD generated in each excitation pulse, and emission from the ground state, the bi-excitonic state, and the higher excited states of the QDs are thus expected. Spectral selection of the ground state energy () ensures that we only observe spontaneous emission from the ground and bi-excitonic states. Saturation of the QDs leads to a 50% increase of the decay rate, but this effect is expected to be independent of the PCM geometry and therefore does not pose a problem to our measurements. The high pump power improves the signal-to-noise ratio compared to the case of non-saturated QDs. The experimental setup is shown in Fig. 1(b).
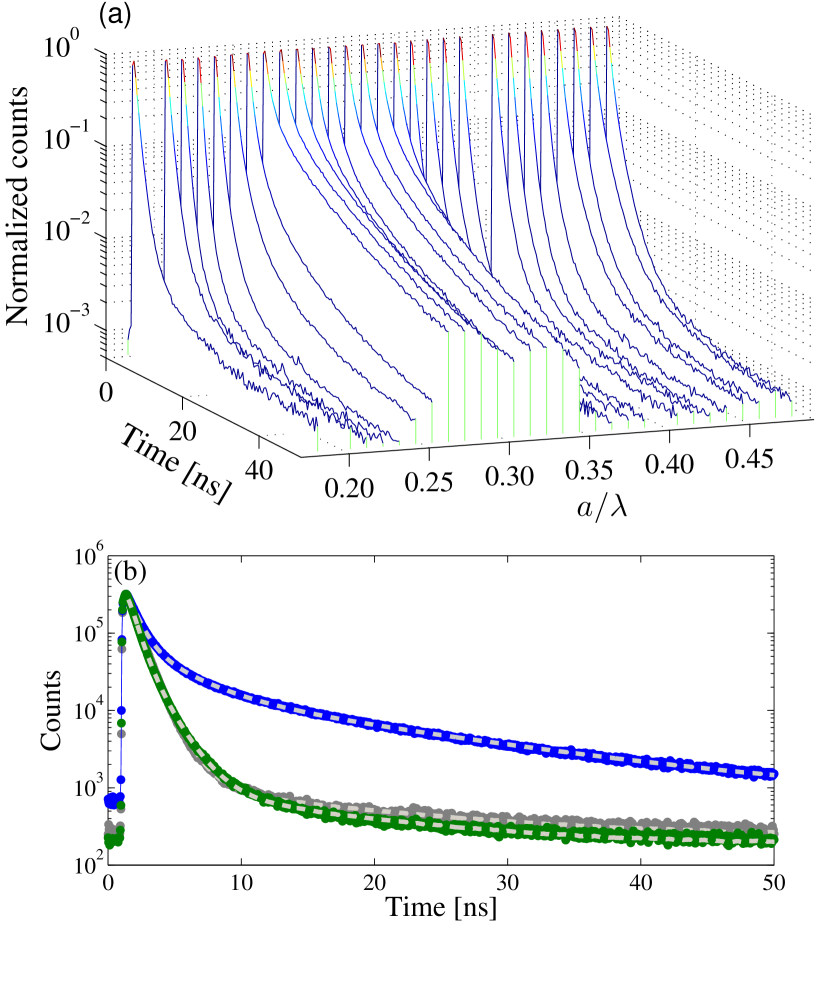
The recorded decay curves are shown on a normalized scale for comparison in Fig. 2(a) with varying lattice constant, , and fixed detection wavelength, , within a bandwidth of 2 nm. We readily observe a pronounced slow down of the decay dynamics in the range . This slow down is the signature of strongly inhibited spontaneous emission for emission energies within the 2D photonic bandgap. Note that the decay curves span up to three decades due to the long repetition period of the laser. This allows for a detailed study of the slow components of the decay curves where strong inhibition of spontaneous emission will appear.
As expected from the strong position and orientation dependence of the LDOS Koenderink2006a , the spontaneous-emission decay curves are multi-exponential. Approximating the initial fast decay by a single-exponential decay model will only determine the fastest decay rates in the multi-exponential decay. Hence, a single exponential model will clearly not suffice in characterizing the decay dynamics. A suitable measure to quantify the overall change in emission rate is the inverse of the mean decay time, , which is computed as: , where describes the ensemble luminescence. To obtain we fit a triple-exponential model to the data. The model has been convolved with the instrument response function Lakowicz2006a obtained by detecting the pump laser scattered from the sample. Examples of triple-exponential models fitted to the data are shown in Fig. 2(b). We stress that the individual parameters are of no physical significance, the triple-exponential model is merely chosen as it is able to model the luminescence decay well and thus ensures a reliable extraction of .
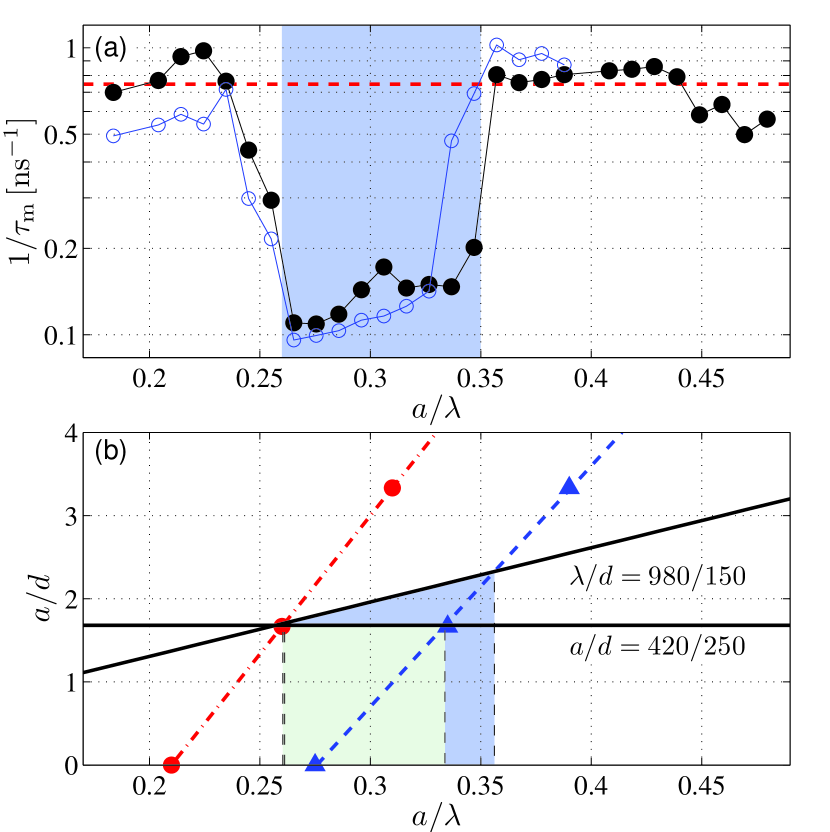
The inverse mean decay times are plotted in Fig. 3(a) for the various values of . Compared to the value of obtained in absence of the PCM, we observe more than six-fold decrease of the inverse mean decay time inside the 2D photonic bandgap and an increase of up to outside the bandgap. It should be noted, that the effect of variations in the LDOS will be less pronounced in the mean decay time than in the purely radiative decay time, since the former also includes contributions from non-radiative decay, which is unaffected by the LDOS Johansen2008a . The experimental variations in the mean decay times are thus expected to be a conservative estimate of the actual LDOS variations in the PCM.
In order to compare the measured mean decay times with theory the complex QD decay dynamics in a photonic crystal must be adequately accounted for. The decay curves for an ensemble of QDs will depend on the position and orientation of the emitter through the LDOS, redistribution of the emitted light, as well as internal QD dynamics. Simulation of the data is a comprehensive task and the details will be described elsewhere. Here we briefly discuss the approach and show the resulting comparison (Fig. 3(a)). The radiative decay rate is modeled using the full 3D LDOS that was calculated for seven different positions and two orthogonal dipole orientations in Ref. Koenderink2006a . Redistribution is accounted for by assuming that modes propagating in the slab are completely inhibited by the 2D photonic bandgap while radiation modes are unaltered. This simplistic model has been implemented successfully in the literature Kaniber2007a ; Fujita2005a , however a rigorous treatment would require calculating the full 3D Green’s function of the PCM, which is not available in the literature. Finally, internal QD dynamics is modeled by including the interplay between bright and dark excitons states, which leads to a bi-exponential decay of the spontaneous emission Labeau2003a ; Smith2005a . The relevant parameters describing the QD dynamics, including non-radiative decay Johansen2008a (which is assumed identical for all QDs and hence neglecting possible surface recombination effects at the membrane holes), were derived from measurements performed on an unpatterned membrane.
As shown in Fig. 3(a) we find a remarkably good agreement between experimental observations and simulated inverse mean decay times. This is to our knowledge the first detailed comparison between experiment and theory for QDs in photonic crystals. Note in Fig. 3(a) that the measured spectral position of the upper bandgap edge deviates from the calculated value based on Ref. Koenderink2006a . However, this is readily explained by noting that the scaled frequencies of the band edges, , vary linearly with as calculated in Ref. Andreani.JQuantElec.38.891(2002) where the spectral positions of the 2D photonic bandgap edges were determined for three different ratios between the lattice spacing, , and membrane thickness, . This allows for interpolation to any value of this ratio, as shown in Fig. 3(b). The LDOS calculations of Ref. Koenderink2006a were performed for a constant membrane thickness and lattice spacing, , while varying the scaled emission frequency, , corresponding to the horizontal line in Fig. 3(b). It can be shown that identical results will be obtained by scaling both and while keeping fixed. Since it is very inconvenient to vary the membrane thickness, , our experiment is performed for fixed detection wavelength, , and membrane thickness, , while the lattice constant, , is varied. In Fig. 3(b) this corresponds to the inclined line, , which intersects the red (dash-dotted) and blue (dashed) band-edge lines very closely (within experimental precision) to our observed values of 0.26 and 0.35, respectively. While very good agreement between experiment and theory is obtained, when comparing the inverse mean decay time, , as is apparent from Fig. 3(a), we note that increased complexity is found when comparing the full decay curves to theory (not shown). We believe that the discrepancies found are primarily caused by the rather simplistic model for the redistribution of light, while deviations due to the slight differences in between experiment and theory are expected to be of minor importance.
In conclusion, we have carried out a systematic study of the spontaneous emission dynamics in 2D PCMs. Very pronounced inhibition of spontaneous emission was demonstrated within the range of lattice constants for which a 2D photonic bandgap is predicted by theory. Comparing to a reference measurement on QDs in unpatterned membranes we report an inverse mean decay time which is reduced by more than a factor of 6 for emission energies inside the bandgap, while an increase of was observed on the red side of the bandgap. Our experiment was compared to theory taking into account the full 3D LDOS and very good agreement was observed.
We thank Femius Koenderink for generously sharing his LDOS calculations and Jørn M. Hvam for fruitful discussion and general support. We gratefully acknowledge financial support from the Danish Research Council (FNU grant 272-05-0083 and 272-06-0138 and FTP grant 274-07-0459). The work is part of the EU project “QPhoton”. B. Julsgaard is supported by the Carlsberg Foundation.
References
- (1) E. Yablonovitch, Phys. Rev. Lett. 58, 2059 (1987).
- (2) P. Lodahl, A. F. van Driel, I. S. Nikolaev, A. Irman, K. Overgaag, D. Vanmaekelbergh, and W. L. Vos, Nature 430, 654 (2004).
- (3) M. Fujita, S. Takahash, Y. Tanaka, T. Asano, and S. Noda, Science 308, 1296 (2005).
- (4) M. Kaniber, A. Kress, A. Laucht, M. Bichler, R. Meyer, M. Amann, and J. J. Finley, Appl. Phys. Lett. 91, 061106 (2007).
- (5) I. S. Nikolaev, P. Lodahl, and W. L. Vos, Phys. Rev. A 71, 053813 (2005).
- (6) K. J. Vahala, Nature 424, 839 (2003).
- (7) C. Simon, Y.-M. Niquet, X. Caillet, J. Eymery, J.-P. Poizat, and J.-M. Gérard, Phys. Rev. B 75, 081302(R) (2007).
- (8) R. Sprik, B. A. van Tiggelen, and A. Lagendijk, Europhys. Lett. 35, 265 (1996).
- (9) A. F. Koenderink, M. Kafesaki, C. M. Soukoulis, and V. Sandoghdar, J. Opt. Soc. Am. B 23, 1196 (2006).
- (10) I. S. Nikolaev, P. Lodahl, A. F. van Driel, A. F. Koenderink, and W. L. Vos, Phys. Rev. B 75, 115302 (2007).
- (11) J. R. Lakowicz, Principles of Fluorescence Spectroscopy (Springer, New York, 2006).
- (12) J. Johansen, S. Stobbe, I. S. Nikolaev, T. Lund-Hansen, P. T. Kristensen, J. M. Hvam, W. L. Vos, and P. Lodahl, Phys. Rev. B 77, 073303 (2008).
- (13) O. Labeau, P. Tamarat, and B. Lounis, Phys. Rev. Lett. 90, 257404 (2003).
- (14) J. M. Smith, P. A. Dalgarno, R. J. Warburton, A. O. Govorov, K. Karrai, B. D. Gerardot, and P. M. Petroff, Phys. Rev. Lett. 94, 197402 (2005).
- (15) L. C. Andreani and M. Agio, IEEE J. Quant. Elect. 38, 891 (2002).