“Slow” and Fast Rotators Among Hypervelocity Stars11affiliation: Based on data gathered with the 6.5 meter Clay Magellan Telescope located at Las Campanas Observatory, Chile.
Abstract
We measure the projected rotational velocities of the late B-type hypervelocity stars HVS7 and HVS8 from high resolution spectroscopy to be 60 17 km s-1 and 260 70 km s-1. The ’slow’ rotation of HVS7 is in principle consistent with having originated in a binary system, assuming a high inclination angle of the stellar rotation axis. However, the fast rotation of HVS8 is more typical of single B-type stars. HVS8 could have therefore been ejected by a mechanism other than that proposed by Hills. We also estimate the effective temperatures and surface gravities for HVS7 and HVS8 and obtain an additional measurement of their radial velocities. We find evidence in support of a blue horizontal branch nature for HVS7, and a main sequence nature for HVS8.
1 Introduction
The recent discovery of 10 hypervelocity stars (HVSs; Brown et al., 2005; Edelmann et al., 2005; Hirsch et al., 2005; Brown et al., 2006a, b, 2007) has raised many questions about their nature and origin. The most widely accepted ejection mechanism, proposed by Hills (1988), involves the encounter of a close binary with a supermassive black hole (SMBH). Other possible mechanisms ejecting stars from the Galactic center involve intermediate-mass black holes (IMBHs; e.g. Yu & Tremaine, 2003; Löckmann & Baumgardt, 2008), a binary massive black hole (BMBH; e.g. Yu & Tremaine, 2003; Merritt, 2006; Sesana et al., 2006, 2007), or a cluster of stellar mass black holes around the SMBH (O’Leary & Loeb, 2008). Hansen (2007) claimed that the rotational velocities of HVSs should be lower than those measured for single stars of the same spectral type if they originated in binaries, because of tidal effects. He predicted that the rotational velocities of the known B-type HVSs should be km s-1, based on values compiled by Abt & Boonyarak (2004) for B-stars in binaries. Löckmann & Baumgardt (2008) predicted high rotational velocities for HVSs that were ejected by a very close encounter with an IMBH in the Galactic center, however such encounters are very unlikely.
These predictions cannot be tested with existing observations, as the low resolution of the discovery spectra of most HVSs is not sufficient to determine projected rotational velocities (). The only HVS with high resolution spectroscopy and a measurement is HE 0437–5439, found by Edelmann et al. (2005). It has km s-1 (Bonanos et al., 2008), in agreement with the prediction of Hansen (2007). However, Bonanos et al. (2008) and Przybilla et al. (2008) measured half-solar metallicity for this early B-star, establishing its origin in the Large Magellanic Cloud (LMC). The possible ejection mechanisms for this star include an interaction with an IMBH or a SMBH, and a dynamical interaction of a single star in a dense cluster. This example demonstrates the importance of high resolution spectroscopy for understanding this newly discovered class of objects.
Of the remaining HVSs, HVS2 (or US 708; Hirsch et al., 2005), is classified as an evolved sdO star and reasonably well understood. However there is some ambiguity in the nature of the late B-type HVSs, since at their temperatures and gravities, the blue horizontal branch (BHB) crosses the main sequence. Hot BHB stars generally have low rotational velocities and peculiar chemical abundances (Behr, 2003a), thus high resolution spectroscopy of these faint HVSs can determine their nature by measuring their atmospheric parameters, chemical abundances and . In addition, time series photometry can reveal pulsations and confirm their main sequence nature, as was done for HVS1 by Fuentes et al. (2006).
Motivated by the lack of and stellar parameter measurements for most of the known HVSs and the possibility of testing the nature of the SMBH in the center of our Galaxy, we performed high resolution spectroscopy of two HVSs. In this Letter we present our results.
2 Observations
We collected spectra of HVS7 and HVS8 (SDSS J113312.12010824.9 and J094214.04200322.1) with the blue chip of the MIKE spectrograph (Bernstein et al., 2003) installed at the 6.5-m Magellan Clay Telescope at Las Campanas Observatory (Chile), on two half nights on UT 2008 January 18–19. Each star was observed twice, with individual exposure times between 900 and , using a slit and 33 binning. The total exposure times were for HVS7 and for HVS8. The resolution of the spectra is R = 32,000 at 4500 Å.
The spectra were extracted using the MIKE reduction pipeline (Kelson et al., 2000; Kelson, 2003). The extracted spectra for each star were then averaged, normalized and merged. The wavelength coverage of the merged spectra is 3900-5050 Å, with an average S/N-ratio per pixel of 15 for HVS7 and 14 for HVS8, based on the extracted continuum around 4500 Å. These S/N-ratios and our spectral resolution are sufficient to distinguish between high ( km s-1; Abt et al., 2002) and low ( km s-1; Hansen, 2007) values for B-stars. Next, we corrected the wavelength scale for Doppler shift, to allow comparison of the spectra with models (see §3). We measured the heliocentric radial velocity of each star using the IRAF111IRAF is distributed by the NOAO, which is operated by the Association of Universities for Research in Astronomy, Inc., under cooperative agreement with the NSF. cross-correlation package RVSAO (Kurtz & Mink, 1998) and the grid of models described in §3. Table 1 lists our results and the values previously reported by Brown et al. (2007). §4 discusses the implications of our new radial velocity measurements.
3 Spectral Analysis
Our high resolution spectra allow direct determination of the effective temperature , surface gravity , and of the stars by comparing synthetic model spectra to the observations. The S/N-ratio of the data is however too low to reliably measure abundances.
We generated a grid of synthetic spectra using the LTE ATLAS9 models and opacities developed by Kurucz (1993). The grid covers between 8000–15000 K in steps of 1000 K, and between 3.0–5.0 in steps of 0.25 dex. The metallicity was set to solar, assuming that the HVSs are ejected from the Galactic center, where abundances are solar or supersolar (Carr et al., 2000; Ramírez et al., 2000; Najarro et al., 2004; Wang et al., 2006; Cunha et al., 2007). For the macro- and micro-turbulence velocities we adopted 0 and 2 km s-1, which are typical for late B-stars (Fitzpatrick & Massa, 1999). The models were broadened by 0.15 Å to match MIKE’s instrumental profile and resampled to a dispersion of 0.03 Å/pix to match the dispersion of the stellar spectra. Finally, we convolved each model with rotational profiles between 10–350 km s-1 in 10 km s-1 velocity increments.
Simultaneous fits to , and were performed for each star by iteratively comparing each model to the data. The agreement between each model and the observed spectra is quantified by the spectroscopic quality-of-fit parameter, (normalized ), defined by Behr (2003a) and given by the equation
| (1) |
where is the number of points in the spectrum, and and are the root mean squared deviation between each model and the stellar spectrum, and the smallest value of the rms found. = 0 gives the best model fit, and = 1 defines the statistical 1 confidence interval of the result. The following subsections describe the derivation of , and for each target.
3.1 HVS7
The spectrum of HVS7 (V=17.80 mag, S/N=15) includes four Balmer lines ( – ) from which , and can be estimated. We also detect Mg II, Si II, Ca II and Fe II lines that can in principle be used to further constrain and , however the two main indicators (Mg II and Si II) have anomalous line strengths and cannot be used to constrain the . We are therefore left with only the Balmer lines that are simultaneously sensitive to , and , but can still provide non-degenerate values of these parameters for late B-type stars (see §4 of McSwain et al., 2007). We performed two tests to verify that Balmer lines alone are sufficient to simultaneously derive the three parameters: a) we applied our analysis to synthetic spectra with added random noise matching the S/N-ratios of the observations, and in all cases recovered the input values within errors, b) we applied our analysis to a high S/N spectrum of a late B-type star (HR7447, B5 III), kindly provided by L. Lyubimkov. Our analysis yielded = 14,000 1000 K, = 3.75 0.25 dex, and = 70 20 km s-1, in agreement with the parameters derived by Lyubimkov et al. (2002, 2004, = 13,400 K, = 3.64 dex, = 76 km s-1).
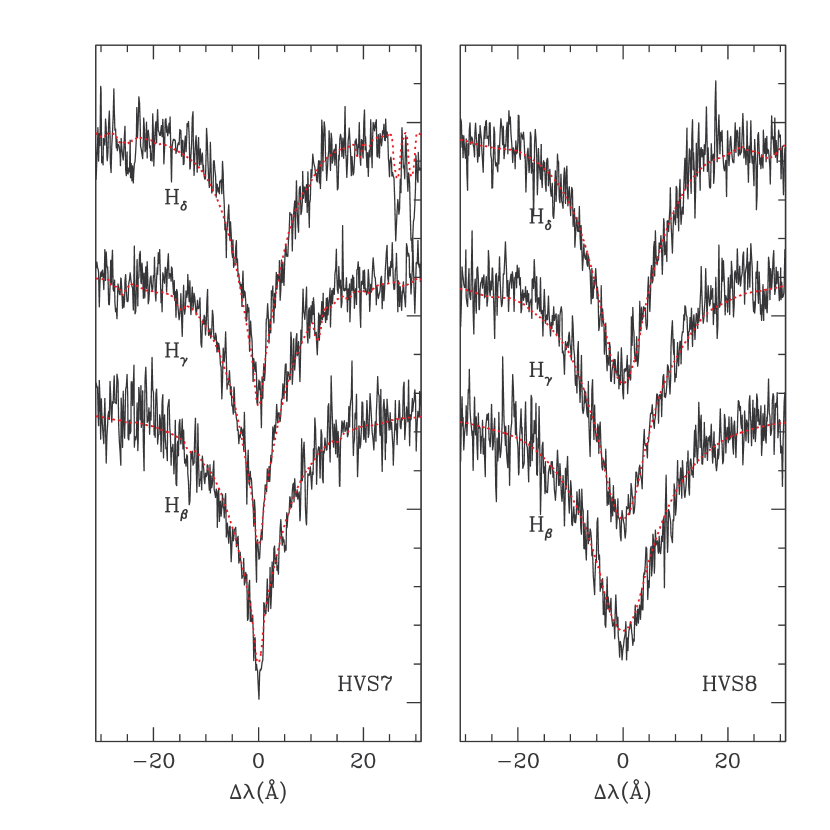
We then proceeded to fit the spectrum of HVS7 for , and . We performed several tests to determine the stability of the best fit solutions. We ran fits to the entire spectrum, 100 Å windows centered on each Balmer line (to ensure that the wings and some continuum are included), portions of the spectrum outside the Balmer lines, and 10–20 Å windows centered on metal lines. In the last two cases we had to fix and to the values from the fits to the entire spectrum and the Balmer lines and only fit for . All the tests give fully consistent results, with the following best fit parameters: = 12,000 1000 K, = 3.50 0.25 dex, and = 60 17 km s-1. The minimization results for the full spectrum are shown in Figure 1. We have adopted conservative errors for and equal to the grid step size, versus their smaller 1 statistical errors. The statistical 1 errors for (horizontal dotted line in the vs. plot in Figure 1), are and km s-1, however visual comparison of the models to the observed spectrum show they are too large. Instead we adopted the errors resulting from the fits to individual metal lines. The left panel in Figure 2 compares the best fit model to the Balmer lines of HVS7.
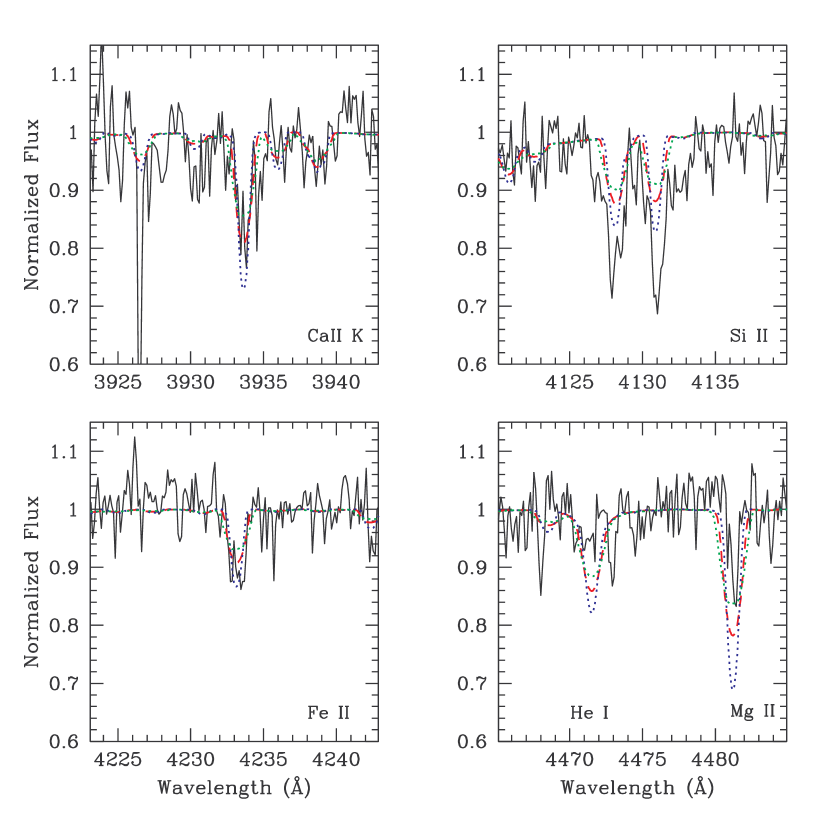
Figure 3 shows metal lines detected in HVS7 with = 40, 60, and 80 km s-1 models overplotted. The purpose of this plot is two-fold; the left-side panels show how the Ca II K and Fe II 4233 lines ( is derived from these two and the Fe II 4549 and 4583 lines) give = 60 km s-1 as the best model fit, and their depths agree with the solar abundance adopted in the models. The from these lines also agrees with the fits to the full spectrum and the Balmer lines. The right-side panels show the behavior of the Si II doublet, the Mg II and He I lines. None of the models in the grid can reproduce the depths of those lines. While He I and Mg II seem depleted in the atmosphere of HVS7, the Si II 4128/4130 lines seem strongly enhanced. The models cannot reproduce either the depth nor the line strength ratio of the He I and Mg II lines. The enhancement of the Si II 4128/4130 doublet is even more significant when taking into account that the Kurucz LTE ATLAS9 models overpredict the strengths of these lines. This problem persists even after including non-LTE corrections (Smartt et al., 2001) . Abundance peculiarities have been noticed before in BHB stars by several authors (Glaspey et al., 1989; Moehler et al., 1999; Behr et al., 1999); however, most of these are very slow rotators ( km s-1; Behr, 2003a).
3.2 HVS8
The spectrum of HVS8 (V=18.09 mag, S/N = 14) has a S/N similar to the HVS7 spectrum, however, inspection of the spectrum of HVS8 for metal lines gives null results. This can be explained by very low metal abundances, strong depletion, or highly broadened metal lines. The obtained below points towards the latter case.
To derive , and we used only the spectrum above 4000 Å because of problems with the continuum normalization at shorter wavelengths. As with HVS7, we simultaneously fit for , and by iteratively comparing the spectrum of HVS8 to our model grid. We ran fits to the entire spectrum and 160 Å windows centered on the Balmer lines, which gave consistent parameters: = 11,000 1000 K, = 3.75 0.25 dex, and = 260 70 km s-1. The lack of metal lines in the spectrum of HVS8 is consistent with a high that results in strong line broadening. The error in in this case comes directly from the = 1 statistical 1 result, as visual comparison of the spectrum to the models does not allow us to place a finer constraint. The right-side panel in Figure 2 compares the best fit model to the , and lines of HVS8. The flat-bottomed cores of the Balmer lines, which are the most sensitive regions to , clearly illustrate that HVS8 rotates faster than HVS7.
4 Radial Velocities
The new radial velocity observations in Table 1 provide a third epoch for each star and allow to check for variations. Our radial velocity measurement for HVS7 is identical to the values reported by Brown et al. (2006b) and Brown et al. (2007), within errors. Such measurements provide clues to the nature of HVSs. As pointed out by Brown et al., determining the nature of late B-type HVSs is not straightforward because late-type main sequence B-stars and hot Blue Horizontal Branch (BHB) stars have identical atmospheric parameters. BHB stars are less luminous and therefore closer in distance to us. Establishing the evolutionary stage of HVS7 is critical because its radial velocity is marginally consistent with it being a BHB runaway star bound to our Galaxy (Brown et al., 2006b). The lack of significant radial velocity variations for HVS7 suggests it is not a binary, nor a pulsator. Slowly pulsating main sequence B-type stars typically show radial velocity variations of 20 km s-1 in amplitude (Aerts et al., 1999; Mathias et al., 2001), while BHB stars appear to be stable, as they fall outside the RR Lyrae instability strip (Contreras et al., 2005; Catelan, 2005). The long term radial velocity stability of HVS7, combined with the metal abundance anomalies (see §3.1), hint towards HVS7 being a BHB star. Its (60 km s-1) is higher than typically found for BHB stars ( km s-1), although rotators with up to km s-1 have been observed (e.g. Behr, 2003a, b). The true nature of HVS7 as a bound BHB star will have to be disentangled by astrometry.
For HVS8 we detect a radial velocity variation of 23 km s-1, consistent with a pulsating main sequence B-type star. We cannot discard the possibility of HVS8 being a binary, although the system would have a very low mass-ratio, since there is no evidence of lines from a companion in the spectrum. The star is most likely a main sequence slow pulsator, like HVS1 (Fuentes et al., 2006). The low S/N of our spectrum does not allow to test for metal abundance anomalies in HVS8, however, the high rotational velocity of this star will make its abundance analysis difficult, even with higher S/N spectra.
5 Discussion
We have derived , and for HVS7 and HVS8, two of the ten currenty known HVSs. Their and are consistent with the stars being late B-type, as initially classified by Brown et al. (2006b, 2007) using photometric color indexes. HVS7 has a projected rotational velocity = km s-1, while for HVS8 = km s-1. These measurements provide the first direct observational test to the prediction by Hansen (2007), who suggests that HVSs ejected via Hills’ mechanism should rotate systematically slower ( km s-1) than single stars of the same spectral type ( km s-1; Abt et al., 2002). If the HVSs have fast rotational velocities typical of single B-type stars in the field, other ejection mechanisms, such as three-body encounters of single stars with – IMBHs, with a binary MBH, or with 10 stellar-mass black holes orbiting the Galactic SMBH, have to be invoked.
The values of HVS7 and HVS8 are lower limits to their true rotational velocities, imposed by the inclination angle of the rotation axis of the stars. If the inclination of the rotation axis of HVS7 is low, its rotational velocity could in principle be much higher. In that case both targets are inconsistent with Hansen’s prediction for Hills’ scenario. However, a sample of only two measurements is not enough to conclusively discern between the different scenarios proposed and more measurements are necessary. Statistical tests performed by Perets (2007) conclude that a sample of 25 or more HVSs will be needed to distinguish between scenarios at a 95 confidence level.
We also detect abnormal enhancement and depletion effects in the strength of some of the metal lines of HVS7. These anomalies, together with the apparent lack of pulsations are consistent with HVS7 being a BHB star. Its is also marginally consistent with it being a fast-rotating BHB star, if the inclination angle of the star’s rotation axis is close to 90 degrees. However, confirmation that HVS7 is a BHB star will not be possible until its proper motion is accurately measured. Finally, we find evidence of radial velocity variations in HVS8 consistent with a pulsating main-sequence B-type star nature. Additional radial velocity measurements and time-series precision photometry will confirm this detection.
References
- Abt & Boonyarak (2004) Abt, H. A. & Boonyarak, C. 2004, ApJ, 616, 562
- Abt et al. (2002) Abt, H. A. et al. 2002, ApJ, 573, 359
- Aerts et al. (1999) Aerts, C., De Cat, P., Peeters, E., et al. 1999, A&A, 343, 872
- Behr (2003a) Behr, B. B. 2003a, ApJS, 149, 67
- Behr (2003b) —. 2003b, ApJS, 149, 101
- Behr et al. (1999) Behr, B. B. et al. 1999, ApJ, 517, L135
- Bernstein et al. (2003) Bernstein, R. et al. 2003, in SPIE, Vol. 4841, pp. 1694-1704, ed. M. Iye & A. F. M. Moorwood
- Bonanos et al. (2008) Bonanos, A. Z., López-Morales, M., et al. 2008, ApJ, 675, L77
- Brown et al. (2005) Brown, W. R. et al. 2005, ApJ, 622, L33
- Brown et al. (2006a) —. 2006a, ApJ, 640, L35
- Brown et al. (2006b) —. 2006b, ApJ, 647, 303
- Brown et al. (2007) —. 2007, ApJ, 671, 1708
- Carr et al. (2000) Carr, J. S. et al. 2000, ApJ, 530, 307
- Catelan (2005) Catelan, M. 2005, preprint (astro-ph/0507464)
- Contreras et al. (2005) Contreras, R. et al. 2005, ApJ, 623, L117
- Cunha et al. (2007) Cunha, K., Sellgren, K., Smith, V. V., et al. 2007, ApJ, 669, 1011
- Edelmann et al. (2005) Edelmann, H., Napiwotzki, R., et al. 2005, ApJ, 634, L181
- Fitzpatrick & Massa (1999) Fitzpatrick, E. L. & Massa, D. 1999, ApJ, 525, 1011
- Fuentes et al. (2006) Fuentes, C. I., Stanek, K. Z., et al. 2006, ApJ, 636, L37
- Glaspey et al. (1989) Glaspey, J. W. et al. 1989, ApJ, 339, 926
- Hansen (2007) Hansen, B. M. S. 2007, ApJ, 671, L133
- Hills (1988) Hills, J. G. 1988, Nature, 331, 687
- Hirsch et al. (2005) Hirsch, H. A. et al. 2005, A&A, 444, L61
- Kelson (2003) Kelson, D. D. 2003, PASP, 115, 688
- Kelson et al. (2000) Kelson, D. D. et al. 2000, ApJ, 531, 159
- Kurtz & Mink (1998) Kurtz, M. J. & Mink, D. J. 1998, PASP, 110, 934
- Kurucz (1993) Kurucz, R. 1993, ATLAS9 Stellar Atmosphere Programs and 2 km/s grid. Kurucz CD-ROM No. 13. Cambridge, Mass.: Smithsonian Astrophysical Observatory
- Löckmann & Baumgardt (2008) Löckmann, U. & Baumgardt, H. 2008, MNRAS, 384, 323
- Lyubimkov et al. (2002) Lyubimkov, L. S., et al. 2002, MNRAS, 333, 9
- Lyubimkov et al. (2004) Lyubimkov, L. S., et al. 2004, MNRAS, 351, 745
- Mathias et al. (2001) Mathias, P., Aerts, C., Briquet, M., et al. 2001, A&A, 379, 905
- McSwain et al. (2007) McSwain, M. V., Boyajian, T. S., et al. 2007, ApJ, 655, 473
- Merritt (2006) Merritt, D. 2006, ApJ, 648, 976
- Moehler et al. (1999) Moehler, S. et al. 1999, A&A, 346, L1
- Najarro et al. (2004) Najarro, F., Figer, D. F., et al. 2004, ApJ, 611, L105
- O’Leary & Loeb (2008) O’Leary, R. M. & Loeb, A. 2008, MNRAS, 383, 86
- Perets (2007) Perets, H. B. 2007, preprint (astro-ph/0712.1888)
- Przybilla et al. (2008) Przybilla, N., Nieva, M. F., et al. 2008, A&A, 480, L37
- Ramírez et al. (2000) Ramírez, S. V. et al. 2000, ApJ, 537, 205
- Sesana et al. (2006) Sesana, A., Haardt, F., & Madau, P. 2006, ApJ, 651, 392
- Sesana et al. (2007) —. 2007, ApJ, 660, 546
- Smartt et al. (2001) Smartt, S. J., Venn, K. A., et al. 2001, A&A, 367, 86
- Wang et al. (2006) Wang, Q. D. et al. 2006, MNRAS, 371, 38
- Yu & Tremaine (2003) Yu, Q. & Tremaine, S. 2003, ApJ, 599, 1129
| Target | RV (km s-1) | RV (km s-1) |
|---|---|---|
| (this work) | (previous work**Brown et al. (2007) report two radial velocity observations for each star and find identical values within their errorbars.) | |
| HVS7 | 529 2 | 531 12 |
| HVS8 | 489 2 | 512 10 |