A deep X-ray observation of M82 with XMM-Newton
Abstract
We report on the analysis of a deep (100 ks) observation of the starburst galaxy M82 with the EPIC and RGS instruments on board the X-ray telescope XMM-Newton. The broad-band (0.5-10 keV) emission is due to at least three spectral components: i) continuum emission from point sources; ii) thermal plasma emission from hot gas; iii) charge exchange emission from neutral metals (Mg and Si). The plasma emission has a double-peaked differential emission measure, with the peaks at keV and keV. Spatially resolved spectroscopy has shown that the chemical absolute abundances are not uniformly distributed in the outflow, but are larger in the outskirts and smaller close to the galaxy centre. The abundance ratios also show spatial variations. The X-ray derived Oxygen abundance is lower than that measured in the atmospheres of red supergiant stars, leading to the hypothesis that a significant fraction of Oxygen ions have already cooled off and no longer emit at energies keV.
keywords:
galaxies: individual: M82 – galaxies: abundances – X-rays: ISM – ISM: jets and outflows – plasmas – atomic processes.1 Introduction
M82 is a nearby galaxy often considered as the prototype starburst galaxy (Rieke et al., 1980). Its proximity (3.63 Mpc, Freedman et al., 1994) and luminosity ( erg s-1 in the far infrared, erg s-1 in the X-ray domain; Ranalli et al., 2003), along with the presence of an ongoing powerful ( M⊙ yr-1) starburst has made it the subject of countless studies at all wavelengths. The starburst, located in the galaxy central regions, is driving a several kpc large outflow perpendicular to the plane of the galaxy (Heckman et al., 1990) which has been observed at multiple wavelengths, such as the radio (Seaquist & Odegard, 1991), infrared (Alton et al., 1999; Engelbracht et al., 2006), H and X-rays (Lehnert et al., 1999). Recent observations in the X-ray domain with the Chandra, XMM-Newton and Suzaku observatories are reported in Griffiths et al. (2000), Read & Stevens (2002), Origlia et al. (2004), Strickland & Heckman (2007) and Tsuru et al. (2007). The small inclination of the galaxy disc makes M82 observed almost exactly edge-on, thus allowing a good perspective on the supernova-driven outflow and contributing to its success as an astrophysical laboratory.
M82 was thus chosen as a test case where the metal enrichment due to a burst of star formation can be directly measured. Determining the abundance of key elements released in the interstellar medium (ISM) by supernovae (SN) with different mass progenitors and hence on different time scales, will have a strong astrophysical impact in drawing a global picture of galaxy formation and evolution (McWilliam, 1997; Maeder & Conti, 1994). While the metals locked into the stellar atmospheres give a picture of the abundances at the beginning of the last burst of star formation (SF), the hot gas heated by core-collapse supernova explosions and emitting in the X-rays should trace the enrichment by the SN which were formed in the new generation of stars.
In our previous paper (Origlia et al., 2004) we presented high resolution infrared (J and H band) spectra that we acquired with the 3.6 m Italian Telescopio Nazionale Galileo (TNG), together with a rather shallow ( ks) X-ray observation obtained from the XMM-Newton archive. Our results hinted for a confirmation of the expected scenario in which the gaseous component has a higher content of -elements than the stellar one, and a similar content of Fe. However, some new issues were posed, since we found a very low abundance of O and Ne with respect to other -elements (e.g., O/Mg , Ne/Mg ) in the hot gas present in the central ( kpc) regions of M82, which could not be satisfactorily explained. For these reasons we were granted the deeper ( ks) observation of M82 which we present in this article. Two reports on an early analysis appeared in Ranalli et al. (2005) and Ranalli et al. (2006). Both this work and Origlia et al. (2004) are part of an ongoing larger effort to measure metallicity enhancements in a sample of galaxies.
The X-ray spectrum of M82 is rich and complex. For a review about the physical and observational parameters which may be recovered through X-ray spectroscopy (shape of the spectra; slopes of power-laws; temperatures and abundances of thermal plasmas; etc.), we refer the reader to Paerels & Kahn (2003), while for the physical processes of thermal and charge-exchange emission we refer to the book by Osterbrock (1989) and to the recent review by Kallman & Palmeri (2007); for plasma emission we mention both historical references such as Landini & Monsignori Fossi (1970) and the current ones which illustrate the state of the art (e.g., Mewe et al. 1995 and Smith et al. 2001).
This paper is structured as follows: Sect. 2 presents the XMM-Newton observation and data reduction of M82. In Sect. 3 the EPIC spectra of the central region are analysed, and results are shown about the temperature distribution of the plasma, charge exchange emission, and a comparison of different plasma codes. In Sect. 4 the RGS spectra are analysed, improving and extending the results obtained from EPIC data. In Sect. 5 a spatially-resolved spectral analysis of the EPIC data of the M82 outflow is presented; a dependence of the chemical abundances on the height from the galaxy plane is found. The implications of the main findings of this article are discussed in Sect. 6. Finally, in Sect. 7, the results are summarised.
Throughout this paper, the abundances are linearly scaled according to the Grevesse & Sauval (1998) solar composition (i.e., we always mean X/X⊙ for each chemical element X, following the common usage of X-ray based literature). We assume 3.63 Mpc as the distance to M82, based on Cepheids observations by Freedman et al. (1994).
2 Observations
M82 was observed with XMM-Newton on April 21st 2004 for about 100 ks (Obs-id: 0206080101). After screening for background flares, about 73 ks of data were accepted for analysis. A true-colour image of M82 is showed in Fig. 1, with the red, green and blue colour channels representing the 0.4–1.0 keV, 1.0–2.0 keV and 2.0–8.0 keV bands, respectively. The images in the three bands have been smoothed with the asmooth SAS task, and scaled for the best visual presentation according to Lupton et al. (2004). Superimposed on the image, we also show the regions from which the EPIC spectra were extracted. The RGS spectrum covers an area centred on the galaxy nucleus and extends approximately over the region shown in Fig. 1 as the blue dashed parallel lines.
Please insert fig01.jpg here.
3 Spectroscopy of the central regions of M82: EPIC data
The EPIC data for both the MOS (Turner et al., 2001) and pn (Strüder et al., 2001) cameras were analysed with the SAS (version 6.5.0) and XSPEC (version 11.3.2z) software. We began the spectral analysis from the central region of M82, by extracting spectra from a circle with diameter and centred on the coordinates 09:55:51 and 69:40:39. In this area the largest emission from hot plasma is present; however, many point sources exist in the same region (Griffiths et al., 2000). Thus, the spectral model should account for both plasma emission and point sources, along with considerable absorption.
3.1 Spectrum of underlying point sources
To define an optimal model for the point sources, we analysed the spectrum in the 3-8 keV band, and found that it can be described by a power law with photon index (all errors on spectral parameters are at ), and (with 571 degrees of freedom, hence ). This emission may be ascribed, for all practical purposes, to M82 X-1 (Matsumoto et al., 2001) because the luminosity of this source is much larger than the other ones (Griffiths et al., 2000). This best-fitting value for was not kept frozen in the spectral fits discussed below, but rather used as a consistency check. The point sources, although accounted for in the spectral fits, will not be discussed further. Results about M82 X-1 from this observation have been presented in Mucciarelli et al. (2006). M82 X-1 is also clearly visible in Fig. 1 as the blue spot near the galaxy centre.
3.2 Background spectra for extended sources
The background spectra were derived from blank-sky observations. Because of the source extent, and the spatial dependence of the background spectrum on the XMM-Newton CCDs, it is in fact impossible to obtain background fields from the M82 observation. While background spectra could be extracted near the edges of the field of view where the M82 emission is negligible, these spectra would be different from what is expected in the detector region covered by M82. Thus we used the XMM-Newton blank-sky files provided by the Birmingham group (Read & Ponman, 2003).
Blank-sky observations have the advantage that a background spectrum can be extracted in the same detector region covered by the source, but they need greater care in checking that the background level be as close as possible to the source’s one. In order to match the background brightness, we selected two large circular regions (radius ) in a position several arcmin off-axis where no emission from M82 is present, and extracted spectra from both the M82 data and blank-sky files. In this way, spectra extracted from the same detector region are compared in order to scale the brightness of the latter to the former’s. We found only small differences: the blank-sky/source flux ratios in these two regions are (MOS1), (MOS2) and (pn), and are largely independent from the details of model fitting. Thus, in the following analysis we rescaled every background spectrum by means of the BACKSCAL keyword in the FITS files.
3.3 Temperature distribution of the plasma
It is customary to model the gaseous emission in star forming galaxies with one or more single-temperature plasmas. A ‘warm’ component around 0.7–1 keV is often reported (e.g. Ptak et al. 1999). A ‘hot’, high energy component is also sometimes present (della Ceca et al., 1997; Cappi et al., 1999) in studies based on ASCA or BeppoSAX data, described either as a power-law, or as a thermal spectrum with –10 keV. Because of the poor spatial resolution of those satellites it is not clear if this component is really diffuse or rather due to point sources. Thus, some care should be taken in comparing literature results to this paper, since in the following we will account for both point sources (via the power law discussed in the previous paragraph) and for hot gas. A ‘cold’ component, around 0.1–0.3 keV, has been also occasionally observed (della Ceca et al., 1999; Tsuru et al., 2007). Moreover, a potential pitfall has been discovered (the so-called ‘Fe-bias’, Buote & Fabian, 1998), which occurs when fitting single-temperature models to data which are intrinsically multi-temperature, and which leads to artificially low abundances.
The use of multi-temperature models that allow a fine control of the Differential Emission Measure (DEM) and are also insensitive to the Fe-bias might be preferable. However, this method has been seldom used because of its demanding requirements in terms of data quality and computing time. The quality of our M82 observation is sufficiently high to allow for the first time the use of multi-temperature models even in spatially-resolved spectroscopy.
Two spectral codes, MEKAL (Mewe et al., 1995) and APEC (Smith et al., 2001), are currently used in the literature. However, while several versions of the common MEKAL code are present with multi-temperature flavours (Lemen et al., 1989; Singh et al., 1996) in the XSPEC distribution, no multi-temperature APEC model is present. Since we intended to test which code offers the best performances, we built multi-temperature APEC models for XSPEC, which behave like the MEKAL ones, with the only difference that the APEC routines are called.
We used initially the XSPEC c6pvmkl model, which parametrizes the plasma DEM (i.e. the amount of plasma at different temperatures) with a order polynomial, and allows to vary the abundances.


However, this model allows only temperatures with keV, causing the best-fitting DEM to have a sharp cut, clearly noticeable in Fig. 2 (left panel). Feeling that this limitation was somewhat artificial, we modified the available multi-temperature plasma models by enlarging the allocated energy range, so that the high-temperature part of the DEM could be better sampled (Fig. 2, right panel). The improvement in was however not significant, indicating that the DEM sampling was already sufficiently good: as it may be seen, the high-temperature component is distributed like a rather narrow bell curve, so little difference is found between a single temperature element and the sum of a few elements with very similar temperatures.
3.4 Results and comparison of plasma codes
| M. mospn | M. mos | M. pn | M. mospn no-lines | A. mospn | A. mospn no-lines | |
| ( cm-2) | — | |||||
| ( cm-2) | — | |||||
| O | ||||||
| Ne[,Na] | ||||||
| Mg,Al | ||||||
| Si | ||||||
| S | ||||||
| Ar,Ca | ||||||
| Fe,Ni | ||||||
| normth | ||||||
| ( cm-2) | ||||||
| normpow | ||||||
| 2743 (2267) | 1101 (881) | 1471 (1365) | 3172 (2271) | 2779 (2267) | 2905 (2271) | |
| 1.21 | 1.25 | 1.08 | 1.40 | 1.23 | 1.28
|
|
| line energy (keV) | — | — | ||||
| line wavelength (Å) | — | — | ||||
| line eq. w. (eV) | 22.6 | 15.8 | 15.8 | — | 7.74 | — |
| line energy (keV) | — | — | ||||
| line wavelength (Å) | — | — | ||||
| line eq. w. (eV) | 22.4 | 31.7 | 16.4 | — | 13.6 | — |
The abundances for O, Ne, Mg, Si, S, Fe were left free to vary, since these elements have strong lines in the considered wavelength range. Other -elements with weaker lines (Na, Al, Ar, Ca), which would not be sufficiently constrained on their own, were initially left at the Solar value. However, after noticing that the metals close in atomic number have similar abundances relative to the solar values (Table 1), we hooked Na and Al to Mg, and coupled Ar and Ca together in order to achieve a better . An F-test showed that this approach, as opposed to leaving Na, Al, Ar and Ca to solar values, leads to an improvement of the with significance . While this can be regarded as low significance, we still preferred this approach rather than assigning arbitrary values. Also, the abundances for the strong-line elements did not change significantly. The best-fitting abundances are all reported in Table 1.
To account for absorption, we used the Tübingen model (tbabs, Wilms et al., 2000), which should be regarded as an update of the common, and older, Wisconsin model (wabs, Morrison & McCammon, 1983). A value of cm-2 was used for the Galactic absorption.
The best-fitting values for the slope of the power-law component lie in the range 1.5–1.7, depending on the model (Table 1), consistently with emission from X-ray binaries.
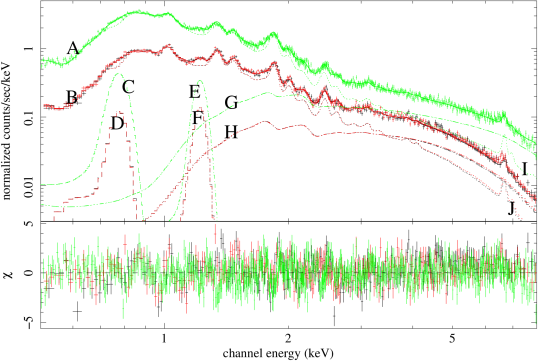
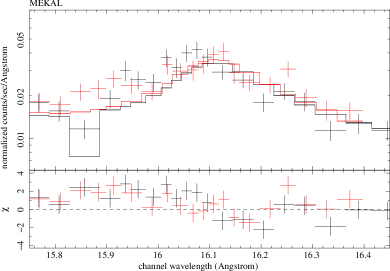
The best-fitting depends on the instrument whose data are analysed, on the plasma code (MEKAL or APEC), and on whether two lines possibly due to charge exchange (CE) emission (see Sect. 3.5) are modelled. Not including the CE lines in the model, a switch from the Mekal- to the APEC-based model improves the fit: for the Mekal one, one gets, considering MOS+pn spectra, with 2271 degrees of freedom (d.o.f.; ); for the APEC one, (). A visual inspection of the residuals confirms that the APEC model provides a slightly better representation of the data. On the other hand, after including the CE lines, the difference in greatly reduces, and both models yield similar values for the . The equivalent widths of the CE lines differ, between the Mekal and APEC models, by a factor of –3. The spectra, with best-fitting models and values, are shown in Fig. 3. A comparison of the residuals is shown in Fig. 4.
3.5 Charge exchange emission
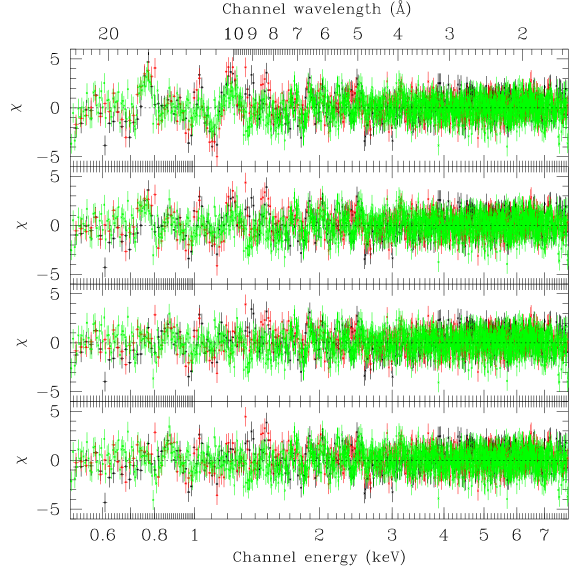
Two spectral lines which are not accounted for by the Mekal and APEC models, showed prominently in the residuals around 16 Å (0.78 keV) and 10 Å (1.2 keV); they may be best seen in the uppermost panel in Fig. 4. The best-fitting wavelengths and equivalent widts derived by parametrizing the lines with Gaussian models are reported in Table 1.
The significance for all these lines when fitting MOS, pn, and joint MOS+pn data can be put at a confidence level . To estimate the confidence level, we used Montecarlo simulations (Protassov et al., 2002) which can be briefly outlined as follows:
-
1.
the model is fit to the data both with and without the line component (‘line-model’ and ‘null-model’, respectively);
- 2.
-
3.
sets of fake data files and fake backgrounds are generated according to the null-model.
-
4.
the fake data are fit with both the null-model and the line-model, and the statistic as defined in Eq. (1) is calculated for each of them;
-
5.
if is the number of fake data sets for which , the confidence level is defined as .
These lines may be considered real also because: i) the effective areas in all EPIC cameras in the considered energy range are smooth functions of the wavelength and do not show any feature around the considered wavelengths; and ii) no background feature is present near these wavelengths. Moreover, the count rate of the central region of M82 is about 100 times larger than the background.
We first looked for identifications in the Chianti database of line emission from astrophysical plasma (Dere et al., 2001). The best candidates for the Å line would be an Fe XVII line at 10.1340 Å or a Ne X line at 10.24 Å, while for the Å line the best candidate might be an Fe XVIII line at 15.83 Å. However, the main problem with this interpretation is that it is not clear why these lines should not be accounted for by the Mekal and APEC models.
A more plausible hypothesis is that these lines, or at least the Å one, are due to charge exchange (CE) emission, occurring at the interface between the hot wind and clouds of cold neutral gas within the galaxy itself. In the CE framework, ions from the wind diffuse through the interface into the cold gas, where electrons are transferred from the neutrals to the ions. Both the resulting ions can be highly excited and consequently re-arrange their electrons by emitting photons in the extreme ultraviolet and X-ray part of the spectrum. Only line emission occurs (no continuum), and the photon emission rate is proportional to the wind ion flux. CE emission has long been known to occur in (optical) nebular spectra (Chamberlain, 1956) and it has been proposed to account for the X-ray emission from the comet Hyakutake (Cravens, 1997), the solar system planets (e.g., Mars: Dennerl et al., 2006), and it might also play a non-negligible role in explaining the emission from galactic winds interacting with dense clouds (Lallement, 2004).
In such a CE scenario, the Å line may be identified with emission from neutral Mg at 9.92 Å (1.25 keV), and this would be consistent with the presence of olivine and pyroxene grains in the cold clouds (Djurić et al., 2005). The Å line, on the other hand, might be emission from excited O VIII ions also resulting from CE interactions, where the electron is decaying from the to the level (but see also Sect 4.2).
Djurić et al. (2005) suggest that, given the grain composition cited above, the Mg line should be companied by a Si line at 1.73 keV. The addition of this line to the MOS+pn spectra is significant, at the 99.97% level, for the APEC model only, and does not remarkably change the . It is, however, not significant for the MEKAL model (98.9% level). The equivalent width would be eV (APEC) or eV (MEKAL). These values can be compared to the equivalent widths for the other two lines, which are found in the ranges 7–24 eV (see Table 1 for the details).
4 Large field of view, high resolution spectroscopy: RGS data
The RGS instrument (den Herder et al., 2001) is a slitless grating spectrometer which allows, thanks to its better energy resolution (, while the EPIC pn camera has in the overlapping energy range), a more precise identification of the emission lines and of their properties, including their individual redshifts and —at least for broad lines— profiles. However, it is sensitive also to extended emission on scales larger than , and M82 was observed with the outflow extent along the RGS dispersion axis, so that for our purposes the line profiles are dominated by instrumental broadening. Thus we shall not discuss the line profiles in the following.
The RGS spectra for the inner region were extracted with the rgsproc tool, considering only events within of the PSF width (while the PSF width is actually energy-dependent, this corresponds roughly to ) in the cross-dispersion direction. On the dispersion direction, the incoming photons are only limited by the instrument vignetting. The alignment of the RGS cross-dispersion direction is shown in Fig. 1 as the blue dashed lines. The background spectra were taken from the blank sky observations using the rgsbkgmodel tool. Following the current calibration documentation111The CAL-TN-0030-3-0 document, available on the XMM web pages., systematic errors for an amount of in the 9–12 Å range, and of in the 24.5–31 Å range, have been allowed in the fitting procedure.
The biggest problem in reducing the RGS data is the resolution degradation due to source extent. The rgsxsrc convolution model contained in the XSPEC package may be used to account for the source extent: it uses an image of the source to derive the line broadening function, assuming that the image profile is the same at all energies. Unfortunately, this is not true for M82 mainly because of the heavy absorption to which its central regions are subject. To mitigate this problem, we used separate input images for the 6–18 Å and 18–30 Å bands, and for narrower bands when appropriate. A source of uncertainty is the aperture size used by rgsxsrc to derive the broadening function. While a small aperture may introduce artefacts in the spectrum due to parts of the source not accounted by rgsxsrc yet contributing to the spectrum, a large aperture may include too much background thus biasing the source profile. We found that an aperture of gives the best trade-off.
In the fitting procedure used for the RGS data, the point sources contribution to the spectra is taken into account by including the same power-law component discussed in Sect. 3, with fixed parameters.
4.1 Thermal lines
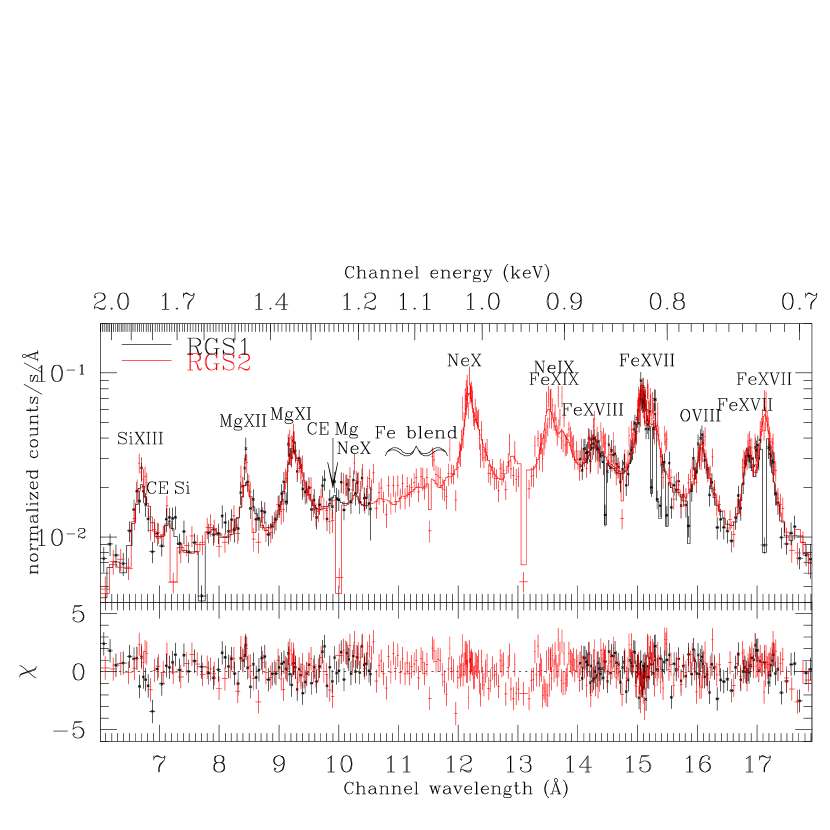
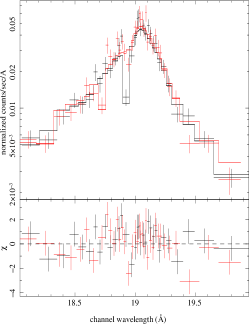
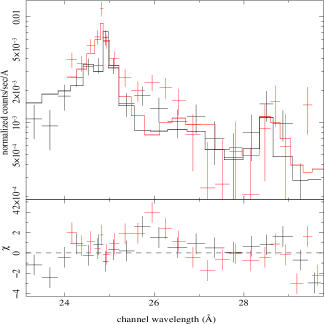
The spectra, with the best-fitting model and the residuals, are shown in Fig. 5 (6–18 Å) and Fig. 7 (18–30 Å), while the spectral results are listed in Table 2. The brightest lines between 6 and 10.5 Å are from Si XIII (a blended triplet around 6.7 Å), Mg XII (8.42 Å), and Mg XI (9.17 Å). Other elements with fainter emission in this region are Al, Na and Ne, while the 10.5–12.0 Å region is dominated by L-shell Fe emission, mainly from Fe XII, Fe XIII and Fe XIV. The Ne X Å line is also prominent. At longer wavelengths many lines are present from Fe and Ni, plus some bright lines from Ne and O; the brightest ones are Fe XVII , 16.8–17.1 Å; Fe XVIII Å; Fe XIX Å), and from Ne IX ( Å) and O VIII ( Å). Longwards of 18 Å, the lines O VIII Å, O VII –22.1 Å, N VII Å and a hint of C VI Å are detected. Line identifications and wavelengths are from CHIANTI (Dere et al., 2001, and references therein).
The O lines, because of the possible contribution from the CE mechanism and because a different best-fitting redshift is needed for O VIII Å than for the lines at shorter wavelengths, will be discussed in Sects. 4.2. Thus, for the dependence on energy of the line profiles and also because the N VII and C VI lines have much fewer counts than all other lines, it is best to restrict the interval to analyse to the 6–18 Å region. This restriction does not affect most elements (i.e. Ne, Mg, Al, Si, Fe and Ni) whose lines are weak, if present at all, in the 18–30 Å region.
The best-fitting values for the abundances provided by the two codes are in agreement within errors for all elements. The APEC model gives the best-fitting to the observed 6–18 Å spectrum, with . It was not possible to get a good fit by using the MEKAL model (the best one has ). The best-fitting abundances from both models are shown in Table 2, and the APEC-derived ones are also displayed as the red horizontal lines in Fig. 12).
The restricted wavelength interval 12-18 Å looks like the best one in which to test our assumption that the Fe and Ni have equal abundances, both because of fit goodness () and of the relative paucity of lines from other elements. By using an F-test, the improvement in resulting from thawing the Ni abundances was not significant (improvement only at 75% confidence level); this was achieved by keeping all other parameters except Fe frozen; thawing O and Ne further reduced the significance of the improvement.
The N VII and C VI lines
Because of the strong absorption, few photon counts are available in the 24–30 Å region where the N VII and C VI lines are present. No significant constraint may be put on the C abundance, which would mainly be obtained from the C VI line at 28.46 Å where the absorption is maximum. An estimate of the N abundance may be placed at values larger than solar, albeit with rather large errors. The random errors are reported in Table 2. As to the systematic ones, one could make the following consideration. The best-fitting abundance of N in Table 2 was calculated by using an input image for rgsxsrc in the 24–26 Å band, and the redshift as a free parameter. Had we included the 24–26 Å region along the 6–18 Å one, with the same 6–18 Å input image for rgsxsrc, and assigned to the N VII line the same redshift of the other considered ones, then the best-fitting N abundance would have been .
| Mekal | Apec | |
| ( cm-2) | ||
| N | ||
| O (16Å) | ||
| Ne[,Na] | ||
| Mg | ||
| Al | ||
| Si | ||
| Fe,Ni | ||
| normth | ||
| 1559.7 (1133) | 1303.4 (1133) | |
| 1.38 | 1.15 | |
| O (19Å) | ||
| 284.1 (148) | 181.3 (148) | |
| 1.9 | 1.22 | |
| eq. w. of Mg line (eV) | 13.1 | 12.4 |
| eq. w. of Si line (eV) | 43.7 | 43.3 |
4.2 The O lines
Two lines from O VIII ( Å and Å) and one triplet from O VII (21.6–22.1 Å) are present in the RGS spectrum. It is not possible to fit all lines together, either with the APEC or with the MEKAL models, because these models assume a common redshift for all lines, which is not the case for O. Thus these lines will be analysed separately.
An additional complication may be the possible presence of CE emission, that should company the Mg and Si emission if the ions impacting on the dust contain O. The relative strengths of the three components of the O triplet arising from CE have recently been measured for the first time in laboratory experiments (Beiersdorfer et al., 2003), finding that the dominant contribution comes from the forbidden line. This effect has also been observed astronomically in Jupiter’s auroras, albeit with large errors on the line fluxes (Branduardi-Raymont et al., 2006). Experiments on CE emission from the Fe XXV triplet have also confirmed the predominance of the intercombination and forbidden lines relative to the resonance one (Wargelin et al., 2005).
4.2.1 The O VIII Å line
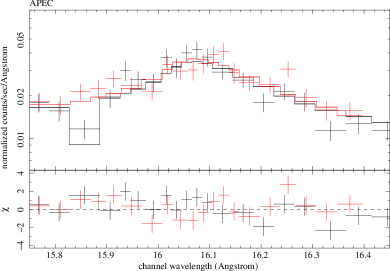
The O VIII Å line can be fit together the other lines in the 6–18 Å range; the abundances derived from this line are shown in Table 2 along with the results from the other elements. A juxtaposition of close-up images of the O VIII Å with both the APEC and MEKAL models is shown in Fig. 6. The goodness’s of fit in the 15.75–16.45 Å interval are and for the APEC and MEKAL models, respectively. From the comparison, one may attribute the deviations to a different modelling of Fe XVIII lines at 15.4 Å, 15.6 Å and 15.8 Å. The APEC-derived value for the O abundance seems therefore more robust.
The O VIII Å line
The O VIII line Å formally needs a different redshift than the lines at shorter wavelength to be fitted. The best-fitting redshifts are and 0 for the APEC and MEKAL models, respectively. However, the relative shifts between O VIII Å and the lines at shorter wavelengths are of the same magnitude of the systematic uncertainties (see Sect. 4.4). The uncertainties are mainly due to the dependency of the line broadening function on the energy. The amount of absorption makes O lines especially sensitive to this effect, so that using a narrow band image as the input for rgsxsrc gives the best results.
The O abundances extracted from this line, with all other parameters kept the same as for the 6–18 Å spectrum, are shown in Table 2. While the APEC model gives an acceptable fit () by using the same parameters for the 6–18 Å spectrum, the MEKAL model needs a different value for the column density or for the normalisation to achieve a good fit. For the MEKAL model, had we thawed the column density, we would have got cm-2, O/O and . Had we thawed the normalisation, a similarly high abundance of O would have been obtained.

The O VII triplet
In the 20.5–23.0 Å the only strong lines are the He-like O VII triplet, at 21.6 Å, 21.8 Å and 22.1 Å, known as the resonance, intercombination and forbidden lines, respectively. We shall retain this nomenclature hereafter. One difficulty in fitting the O VII triplet is that all the lines are blended.
The RGS1 spectrum in the O VII region (RGS2 is not working at these wavelengths) is reproduced neither by the APEC nor by the MEKAL model. Thus in the following we will try and fit the spectrum with Gaussian lines. The following line ratios are used in the literature, which have been shown to be sensitive to the electron density and temperature (Gabriel & Jordan, 1972):
| (2) |
| (3) |
where , , and represent the fluxes in the forbidden, intercombination and resonant line respectively.
From Beiersdorfer et al. (2003) one would get, for CE emission, and ; Branduardi-Raymont et al. (2006) gives values which are consistent, within errors, with Beiersdorfer et al.’s results.
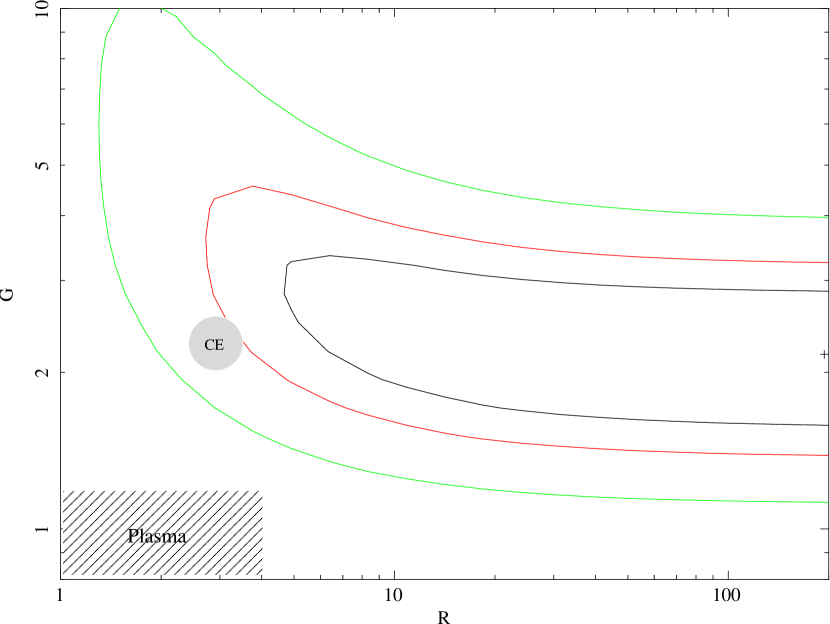
For a thermal plasma dominated by collisional ionisation (CI), the ranges for these parameters are (considering densities ranging from cm-3 to 1 cm-3, respectively) and (temperatures from keV to keV, respectively222While temperatures warmer than 0.35 keV may also be plausible, we did not consider this possibility in the fit, since for higher the flux in the whole O VII triplet decreases.); however the presence of photo-ionisation may lower mimicking a high density plasma; for a hybrid (collisional+photo) plasma one should consider (Porquet et al., 2001). Thus it may be difficult to distinguish between a high density, low temperature collisional plasma and CE emission. In the following, we always refer to Porquet et al. (2001) for the links among , and the physical parameters of the plasma.
It is possible to obtain an acceptable () fit to the spectrum by using a single triplet of lines, provided that some additional broadening is present beyond the ones accounted for by the instrumental response and rgsxsrc; this may be parametrized as a dispersion eV for each Gaussian component of the triplet. If this broadening were of thermal origin, the corresponding velocity would be km s-1. The line intensity ratios are marginally consistent with CE but not consistent with plasma emission, as may be seen in the confidence contours plotted in Fig. 8. It is not clear why only O VII needs additional broadening, with respect to all other lines; while it may be that multiple components (for instance, CE and plasma) are present at different velocities, the data resolution is not high enough to disentangle this issue.
4.3 Lines with possible contribution from Charge-Exchange: Mg, Si
Some residuals around 7.2 Å could be identified with a CE line from neutral Si, with a best-fitting energy within errors from what expected (rest frame wavelength: 7.1280 Å, or 1.7394 keV, Djurić et al. 2005). The significance of this line can be estimated, with the Montecarlo simulations described in Sect. 3.5 and using the APEC model, at a confidence level .
Another possible identification for this line might be Al XIII 7.17 Å, which however is not allowed by the APEC model because an enhancement of this line due to a larger Al abundance should be companied by a similar increase in the Al XII triplet at 7.76–7.87 Å, which is not observed. In order to reproduce the Al XIII/Al XII intensity ratio, the plasma temperature should be keV, which is at odds with the DEM structure derived from the other elements.
The Mg CE line (referred to as ‘the Å’ line in Sect. 3.5) is detected only at a lower confidence level (99.8%).
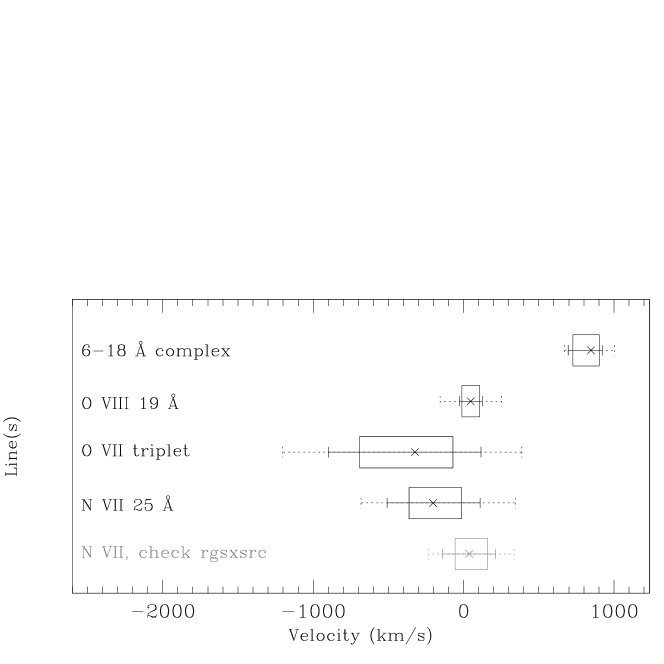
4.4 Comparison of best-fitting velocities
In Fig. 9 we show a comparison of the different ranges for the best-fitting velocities of the X-ray plasma in the 6–18 Å range, the O VIII Å line, the O VII –22.1 Å triplet, and the N VII Å line. The lines in the 6–18 Å interval formally have a larger velocity than the others at longer wavelengths.
In the following we discuss possible systematic uncertainties which may be responsible of the observed discrepancy between ‘short-’ and ‘long’-wavelength lines.
-
•
We recalculated the distribution for the redshift of the N VII line using a 6–18 Å image, in order to maximize the distance between the wavelengths of the line and of the reference image. The result is shown in grey in Fig. 9 with the label ‘N VII check rgsxsrc’. We found that in this case the redshift of the N VII line becomes slightly larger, but it is still not consistent with the redshift of the lines in the 6–18 Å range.
-
•
Using a 6-12 Å image as input for rgsxsrc while studying the O VIII Å line results in a much worse fit () than using an image in the proper band (). Allowing additional broadening does not make the fit better.
-
•
At variance, splitting the 6–18 Å range in two smaller intervals (6–12 Å and 12–18 Å) did not show any difference in the best-fitting velocities, with both cases confirming the 6–18 Å value.
The shift between the ‘long-’ and ‘short’-wavelength lines amounts to ; considering an average wavelength of 15 Å, this corresponds to a mÅ, hence to a spatial separation of , if due to an angular offset of the two emitting regions within the RGS aperture. This distance is shorter than the aperture considered for rgsxsrc, and is comparable to the size of the region where there is the maximum foreground absorption. Thus the velocity shift may well be possibly attributed to the apparent spatial separation of the regions emitting at long and short wavelengths.
5 Spectroscopy of the outflow
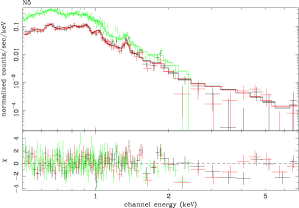
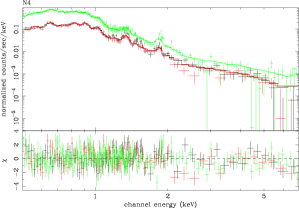
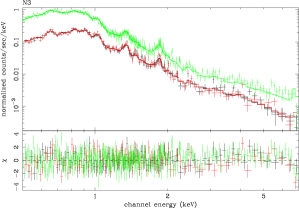
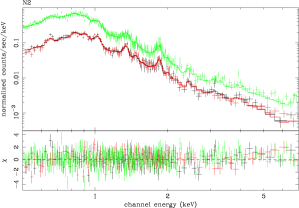
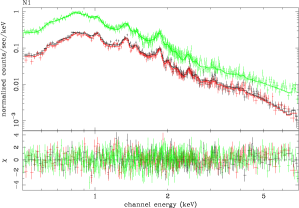
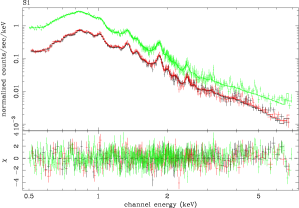
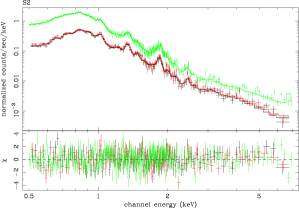
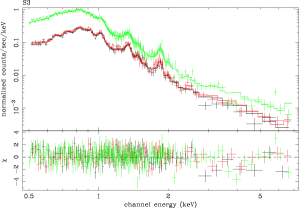
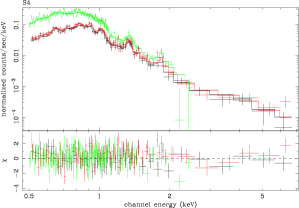
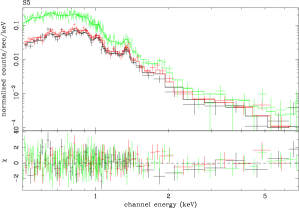
To study the different properties of the hot gas as it flows and is heated from the central starburst towards the intergalactic space, we divided both outflows in five regions each. Each region has a rectangular shape, the larger side being parallel to the galaxy major axis. The regions are numbered from N1 to N5, and from S1 to S5 with increasing height above the galactic plane as shown in Fig. 1; in the figures we adopt the convention of assigning negative heights to the northern regions. The regions have different sizes, chosen mainly to guarantee enough photon counts and a sufficiently good signal to noise ratio to perform a meaningful spectral analysis in each area. The spectra were extracted from the MOS and pn data, and fitted with the same models used for the central region, the only difference being point sources, which in the outflow are sufficiently apart to be excluded when extracting spectra. The positions of point sources were determined by running the PWXDETECT wavelet-based detection code on the MOS1, MOS2 and pn images (the algorithm is described in Damiani et al., 1997). An atlas of the spectra with best-fitting models is shown in Fig. 10. The APEC model was used; no significant difference was found using the Mekal one.
The same multi-temperature structure is found in every region. By fitting the DEM polynomial with two Gaussian components, we found that the centre of the colder component moves slightly from 0.53 keV in the centre of M82 to 0.33 and 0.37 in the outer regions (N5 and S5, respectively). The hotter component does not significantly change its temperature. Fig. 11 shows the centres and FWHM of the best-fitting Gaussians.

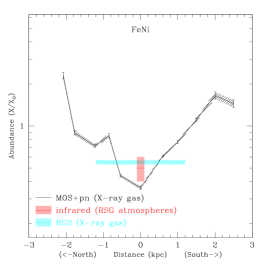
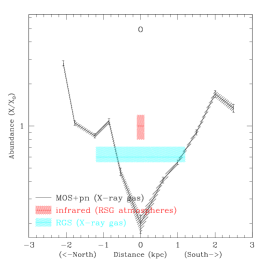
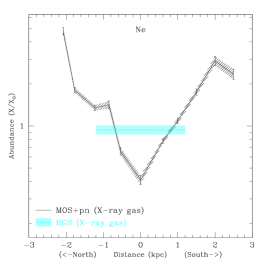
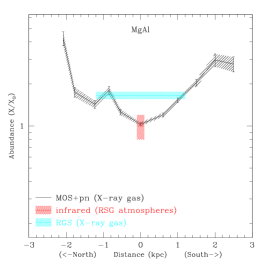
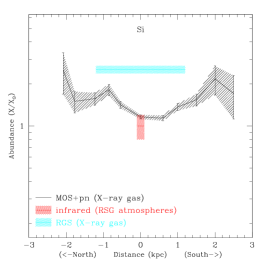
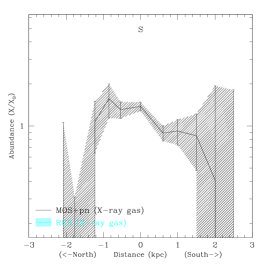
The best-fitting chemical abundances from EPIC and RGS data are shown in Fig. 12 along with results from infrared observations for the central regions (Origlia et al., 2004). Only one region (S1) required in its spectrum some absorption in excess of the Galactic value, probably due to the M82 disc partially covering the southern outflow. We confirm our previous finding (Origlia et al., 2004), that the lighter -elements are more concentrated in the outflow than in the centre. This effect is larger for elements with lower atomic mass, becomes less evident for Si and reverses for S. The centre/outskirt abundance ratio in the centre is about for O and Ne. Fe is also more concentrated in the outflow.
The abundances ratios, shown in Fig. 13, have smaller variations, and present different trends for light and massive elements: while the O/Fe and Ne/Fe ratios are lower in the centre than in the outskirts, the opposite holds for Si/Fe and S/Fe, with Mg/Fe being an intermediate case showing no variation. The scatter between values for centre and outskirts is a factor of .
The physical parameters of the plasma may be obtained from the temperature () and normalisation () of the model, with some assumptions about the volume () and filling factor (). The normalisation of plasma models in XSPEC is defined as
| (4) |
using c.g.s. units and where is the angular distance, and and are the electron and hydrogen volume densities. One usually assumes , and defines the Emission Integral (EI) as . From this, one can obtain the density , the pressure , the gaseous mass , the thermal energy content , and the radiative cooling time , where is the proton mass, and is the emissivity of the gas. Since depends on the temperature, its values were interpolated from Table 6 of Sutherland & Dopita (1993) ( is of the order of erg cm3 s-1, valid for solar metallicity and the temperatures of interest).
The parameters were calculated using the best-fitting normalisations for each region. The used temperatures are the best-fittings to the low-energy components of the DEMs (see lower panel in Fig. 11). For each of the rectangular N and S regions (Fig. 1), the volume was assumed to be that of a cylinder with base diameter and height equal to the major and minor sides of the rectangle, respectively. Normalisations, volumes and physical parameters of the plasma are shown in Table 3. The values for the galaxy centre are also shown in the same table, assuming a cylindrical volume with base radius and height . From the Table, one may see that the gas density and pressure decrease by a factor of from the centre to the outskirts, while the cooling time increases.

| N5 | N4 | N3 | N2 | N1 | centre | S1 | S2 | S3 | S4 | S5 | |
| Normalisation () | 0.14 | 0.68 | 1.6 | 1.6 | 4.0 | 27 | 5.3 | 2.4 | 0.77 | 0.14 | 0.18 |
| Volume (kpc3) | 0.61 | 1.2 | 1.1 | 0.43 | 0.41 | 1.4 | 0.24 | 0.35 | 0.26 | 0.21 | 0.22 |
| Density ( cm-3) | 5.4 | 8.7 | 14 | 23 | 32 | 35 | 19 | 13 | 6.0 | 6.5 | |
| Pressure ( dine cm-2) | 6.1 | 10 | 19 | 35 | 54 | 58 | 31 | 19 | 8.3 | 7.7 | |
| Mass ( M⊙) | 1.7 | 2.4 | 1.5 | 2.3 | 11 | 2.0 | 1.7 | 0.81 | 0.31 | 0.37 | |
| Energy ( erg) | 3.3 | 5.2 | 3.6 | 6.3 | 33 | 6.0 | 4.8 | 2.2 | 0.76 | 0.77 | |
| Energy density ( erg cm-3) | 9.2 | 15 | 28 | 52 | 81 | 87 | 47 | 28 | 12 | 12 | |
| Cooling time (Myr) | 310 | 210 | 160 | 120 | 100 | 89 | 160 | 220 | 390 | 280 |
6 Discussion
6.1 Multi-temperature nature of the gas
To find why the DEM has a double-peaked shape (Figs. 2 and 11), we first checked if the hot component (the peak at keV) was really required to achieve a good fit. By truncating the DEM and leaving only the low energy ( keV) peak, no similar or better fit than those shown in Table 1 could be obtained, ( with 2273 degrees of freedom, , CE lines included). Then we checked if the hot component could have a non-thermal origin. Since star forming galaxies are known as radio sources, bremsstrahlung emission should in principle arise from the same population of electrons from which the synchrotron emission is originated. Thus we developed a non-thermal bremsstrahlung model for XSPEC following the prescriptions in Blumenthal & Gould (1970). By including such a component in the model, no improvement of the fit statistics was observed with respect to the previous case (i.e., no hot component at all).
It is unlikely that the hot component is due to unresolved point sources. By analysing the Chandra 3–9 keV spectra of the diffuse emission of M82, and by considering the Log –Log of point sources in star forming galaxy, Strickland & Heckman (2007) have shown that significant flux remains in that band after accounting for unresolved sources.
Thus, assuming that both components were thermal, one might naively identify the two temperatures with plasma coming from different regions, but this idea would have a hard time explaining why the temperatures are about the same across all the outflow, and also why a similar pattern with same temperatures seems to be exhibited by other galaxies, e.g. NGC253.
The temperature pattern exhibited by M82 is strikingly similar to that of the Galactic ridge (GR), which is an enhancement of the X-ray background along the Galactic equator (Cooke et al., 1969), and whose explanations range from truly diffuse emission to the sum of many faint sources. Unlike the GR case, an interpretation based on the hypothesis of unresolved point sources does not seem viable for M82. The main evidence against is the morphology of the outflow, which is not associated with any stellar structure, such as the disc or the halo.
The temperature pattern is not the only similarity between M82 and the GR: another, important one is the energy of the Fe K lines. By using a simple model (power-law plus Gaussian line) for the 4-8 keV EPIC spectrum, an Fe thermal line was detected333This line is fully reproduced by the MEKAL and APEC models of Sect. 3. at keV (, ) with equivalent width eV (thus confirming the value originally found with BeppoSAX by Cappi et al. 1999). A similar value is found in Suzaku data (P. Ranalli, in prep.).
For the GR, Koyama et al. (1986) found a line energy of keV in observations with the Tenma satellite. Kaneda et al. (1997) reported a line energy of keV. The best-fitting line width also seem to agree (GR: eV; M82: ). One should also note, however, that Tanaka (2002) reported a higher energy for the Fe line in the GR ( keV), and that a line centroid of keV is also consistent with a CE origin for the Fe XXV triplet (Wargelin et al., 2005).
Anyway, the presence of hot gas with keV should put a significant number of Fe atoms in the highest ionisation states, namely He- and H-like, whose line emission happens at higher energies ( keV). Since the presence of such a line in M82 can be safely excluded, one might ask if the hot plasma component is indeed real or is just an artefact.
An important insight has been provided by Dogiel et al. (2002) and Masai et al. (2002). The authors argue that the bremsstrahlung emission of electrons from the regions in which particle acceleration occurs has a peculiar spectrum which mimics the double-temperature pattern found both in the GR and in M82. By considering in situ acceleration of thermalised electrons, they derive a broad transition region between the thermal and non-thermal energy regions. The total X-ray spectrum resulting from both the thermal and transition regions of the electron energy spectrum may then be described, with good approximation, by the sum of two thermal plasmas whose temperatures are in the ratio 4–5. In this model, the actual temperature of the thermalised gas is the colder of the two (the authors propose a value of 0.3 keV for the GR). This would then naturally explain the measured energy of the Fe K line. Another consequence of this model would be the presence of synchrotron emission from the outflow, which in M82 is already known (Seaquist & Odegard, 1991). However, the ratios observed in M82 are larger than the predicted one by a factor 3–4 (see Fig. 11). While the model looks promising, some more work is still needed to check if the discrepancy in the temperature ratio can be reconciled.
6.2 Vertical abundance gradients
In a somewhat naive scheme, a cavity of hot enriched gas is created in the ISM when the first supernova explosions begin. The hot gas which happens to be at the boundary between the cavity and the cold ISM may either cool and mix, or stay hot and unmixed. Let us suppose it does not mix significantly until the hot gas bubble breaks out of the galaxy plane and the outflow is formed. Since the more massive a SN progenitors is, the more metals are produced, the outer regions of the outflow should have larger abundances than the inner one.
To set this idea in a quantitative framework, the relationships between the lifetime of the SN progenitor and the mass of material released after the explosion are shown in Fig. 14, with data from Woosley & Weaver (1995, hereafter WW95) and evolutionary tracks from Bressan et al. (1993). Among the several models present in WW95 we have considered a solar value for metallicity, since this meets most closely the IR and X-ray values. In Fig. 15 we also show the X/Fe mass ratio from WW95.
To locate the proper time-scale, it is important to consider the age of the starburst in M82. Matsushita et al. (2000) report from CO measurements the presence of a molecular super-bubble of size pc in the central regions of M82, expanding at km s-1, which lead them to derive an age of 1–2 Myr. However, this bubble seems to have not yet fully broken, so it may represent a starburst episode successive to the one(s) that produced the X-ray emitting outflow. Strickland et al. (1997) report from ROSAT observations of the X-ray halo that the age may be 10 million years. Also, Silva et al. (2001) investigated the radio to X-ray spectral energy distribution in M82 and found a value for the starburst age of Myr. The models in Strickland & Stevens (2000) suggest that the time required for the starburst in M82 to break out of the ISM is about 5 million years. Finally, the presence of red supergiant stars in the centre of M82 (Origlia et al., 2004) puts a lower limit to the starburst age at Myr.
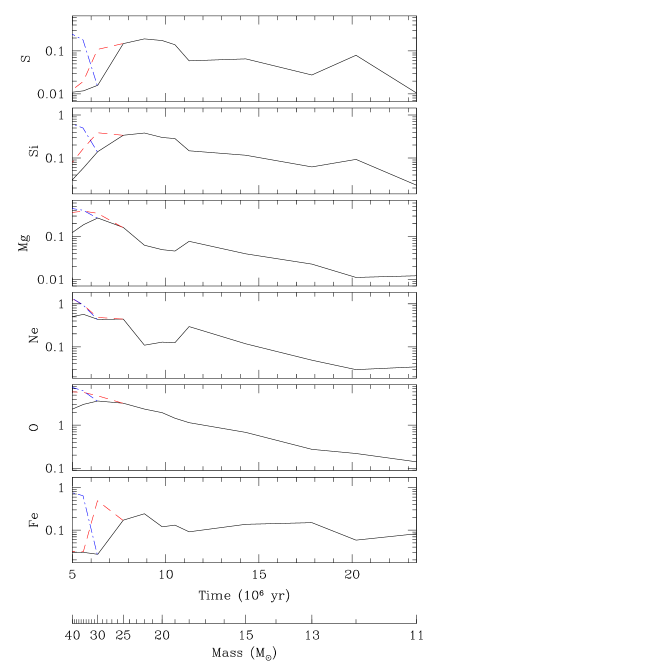
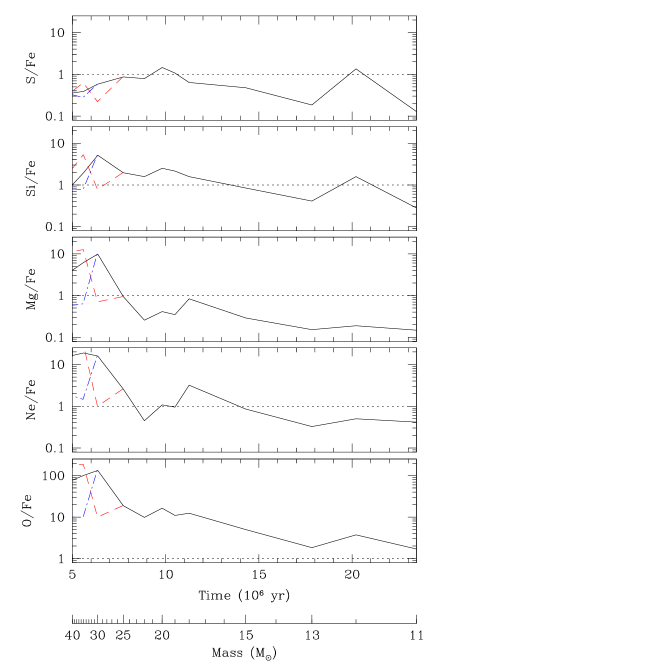
Looking at Fig. 14 one may find a global decrease of the production of O, Ne, Mg, Si, S for increasing progenitor lifetime (or, equivalently, for decreasing mass). In other words, the first stars to explode are also the ones with larger yields. The Fe production, on the other hand, has a less pronounced decrease, with a secondary maximum at Myr; it also has large uncertainties for short-lived stars. It may be tempting to look again at Fig. 12, under the hypothesis that the emission further away from the galaxy centre traces the ejecta from more massive and short-lived stars. This picture may be checked also by comparing the observed and theoretical abundance ratios (Figs. 13 and 15). However, several pitfalls may hamper this interpretation. For instance, we have ignored here any role of the IMF or of the mixing; this is only true insofar as one assumes that the outflow gas is produced in an instantaneous starburst, and then moves in bulk with a constant velocity and without running into other material, such as cold neutral gas in the disc or hot halo gas. To cope with this difficulties would require more assumptions about the history of the starburst-produced gas and of its outflow than it is advisable to discuss here. For instance, if the starburst is not instantaneous but rather has a finite duration, then one needs to consider the IMF, whose effect is to introduce a blurring in the yields distribution of Fig. 14. Also, the mixing of the starburst-produced gas with pre-existent halo gas might veer the observed chemical abundances ratios from resembling type-II SN yields towards type-Ia SN yields.
Another possibility is that the M82 wind may be significantly more mass-loaded in the galaxy inner regions than in the outer ones. It is known that the X-ray emission from the wind regions is not due to a volume-filling wind fluid, but rather it arises at the interacting boundaries of the wind and of the ambient material (Marcolini et al., 2005, and references within). Thus the metallicity of the X-ray emitting gas results from the mixing of the wind with the ambient material.
The wind/cloud interaction is related to the mass loading of the wind, i.e. whether the clouds survive to the wind encounter, or on the contrary if they are disrupted, their material is accelerated and becomes part of the wind. The lifetime of the clouds is not very well known, since it depends on how thermal conduction is modelled at the wind/cloud border. Marcolini et al. (2005) estimate for a cloud of radius pc a lifetime in the 0.9–12.8 Myr interval, depending on the conduction model. It is also known, however, that it scales with , being the cloud radius, so that larger clouds may have much longer lifetimes.
Thus, recalling that the starburst age in M82 is Myr, it is possible that in the inner regions on M82 there are still some clouds not yet disrupted. If the total surface of the clouds which is exposed to the wind has increased with time, e.g. by fragmenting, than it may be possible that mass loading is becoming more and more important. Provided that the supernova-originated wind is enriched with respect to the ambient gas, and that the wind height on the galaxy plane may still be related to the elapsed time, the result is that the metallicity of the X-ray emitting gas is tending towards lower abundances as one moves from the external to the inner regions.
Two possible objections to this picture may be the contradictory behaviour of S, and the fact that fragmenting may be not effective in increasing the clouds surfaces. E.g., if a spherical cloud fragments in smaller spherical clouds and the density does not change, than the total surface scales with .
6.3 Energetics of Charge-Exchange emission
From a Suzaku observation, Tsuru et al. (2007) calculated that the CE process can significantly contribute to the OVII 21–22 Å lines observed from the region of extended emission known as ‘the Cap’. This emission is considered a part of the M82 outflow, and lies (11.6 kpc) north of the M82 nucleus. The best-fitting spectral models of the Cap give a density for the hot gas of cm-3. Under the (extreme) hypothesis that all O ions suffer the CE process and emit O K lines, and assuming a density of the order cm-3 for the neutral material, Tsuru et al. estimated an upper limit to the contribution from CE of photons s-1 cm-2, to be compared with an observed flux of photons s-1 cm-2. To make a similar estimate for the M82 central region, one has to rescale for the volume and densities. The volume and the hot gas density are taken from Table 3 (1.4 kpc3 and cm-3). The mass and density of the molecular material contained in the same volume are M⊙ and 11 cm-3 (Young & Scoville, 1984). The rescaled upper limit on the expected flux would thus be photons s-1 cm-2, to be compared with the observed flux for the OVII triplet which is photons s-1 cm-2. Thus the flux of the OVII triplet can be fully justified if the CE process involves of the OVIII ions. Of course, this is still an upper limit, as the flux contributed to the triplet by thermal emission is highly uncertain.
6.4 Reliability of Oxygen abundances. Discrepancies between measurements in stars and gas
Taken at its face value, the X-ray derived O abundance is found to be smaller than the ones derived for Fe, Mg and other heavier -elements. This effect is true across all the outflow, although it seems more severe in the central regions: using EPIC measurements, the O/Mg abundance ratio is in the external outflow, and in the inner part. On the other hand, WW95 calculates a O/Mg abundance ratio of –20 for all stars with masses between 11 and 40 . Similarly, the observed O/Si ranges from 0.2 and 1.0 while WW95 has 2–10. This was already noticed by Umeda et al. (2002), who found in ASCA data O/Mg and O/Si. Umeda et al. (2002) had some success in explaining these abundance ratios by invoking hypernova explosions, i.e. energetic ( erg) core-collapse supernovae with massive () metal-poor () progenitors.
However, the X-ray derived oxygen absolute abundance is smaller than the IR-derived one. This looks like a more severe problem, because the IR-derived abundances should trace the composition of the gas before any enhancement by the last starburst occurs.
A significant contribution from CE emission has been found in the O VII lines (Sect. 4.2), thus challenging also the O VIII lines because CE is expected to be found in lines from both ionisation states (Djurić et al., 2005). While this might question the reliability of O abundance measurements from X-ray observations, the contributions from CE and thermal emission should add together and result in a stronger line, and hence in a larger measured abundance. Thus it seems that the problem of O under-anbundance is only made worse.
Marcolini et al. (2005) found, in simulation of wind/cloud interaction, that the conductive interface between wind and clouds has a lower temperature than the wind bow shock. Thus they suggested that, since the emissivity of different ions is strongly temperature dependent, the X-ray line emission from low mass ions (O VII, O VIII) should be more influenced by cloud material, while the contribution from wind material should be larger for higher ionisation species (Mg and heavier). On top of this, one could also consider the CE as a cooling mechanism for O ions, because in reactions between O and an element like
| (5) |
the O ion looses energy by falling in a lower ionisation state, and may eventually end out of the ‘temperature window’ available for emission in the 0.5–2.0 keV band. So the bulk of the O mass could probably be traced by measuring O in the UV and far UV bands.
7 Conclusions
We have reported on a deep ( ks) X-ray observation of the starburst galaxy M82 conduced with the XMM-Newton satellite. Spectra of both the galaxy centre and the outflow have been presented.
By observing the M82 nuclear regions with EPIC, at least three spectral components were found: a power-law making most of the flux at energies larger than a few keV, a collisionally ionised plasma accounting for most of the flux at lower energies, and three narrow lines whose origin may be attributed to charge exchange emission.
The power-law emission may be ascribed to the many point sources present in the M82 central region, among whom M82-X1 is by far the most luminous. Its data from this observation have been reported elsewhere (Mucciarelli et al., 2006).
The thermal emission has been found to have a double-peaked differential emission measure, the first peak being at keV and the second one at keV. A similar temperature structure, albeit with a smaller temperature ratio, is predicted by the model proposed by Masai et al. (2002). According to these authors, if a plasma is subject to particle acceleration co-spatial with the thermal emission, then the energy spectrum of the electrons is not fully thermal but includes a non-thermal part, simulating a hot component in the X-ray photon spectrum. Indeed, the Fe line at keV is consistent with a plasma with temperature keV but not with a temperature of keV.
The double-peaked structure of the DEM was confirmed in a series of spectra of the outflow taken with EPIC at increasing distance from the galactic plane. The plasma temperatures do not change significantly, the lower energy peak moving at lower energies further from the galactic plane, while the upper energy peak stays constant across the centre and all the outflow.
Three lines were found in the EPIC spectra which may be attributed to charge exchange reactions involving neutral Mg and Si present in dust grains and the O VIII transition. The equivalent width of these lines depend on the camera (MOS or pn) and on the spectral model used for the plasma (MEKAL or APEC), ranging from to eV. The RGS data confirm the CE lines from Mg and Si, while the CE line from O is not confirmed. RGS data also hint for a CE origin of the O VII –22.1 triplet (EPIC cannot place constraints on the line intensity ratios of this triplet because of insufficient spectral resolution).
Both the O VIII line at 19 Å and the O VII triplet at 21–22 Å consist of two components: the main one, at a redshift similar to that of the other elements’ lines, and a secondary one with lower intensity which exhibits a blueshift ( corresponding to km s-1). Moreover, the lines making the dominant (redshifted) component O VII triplet have line intensity ratios consistent with CE emission but not with a thermal plasma.
The chemical abundances of O (taken at its face value and ignoring any possible contribution from CE), Ne, Mg, Si and Fe as derived with EPIC increase when moving out of the galaxy centre and towards the external regions of the outflow, while the behaviour of S is unclear. On the other hand, since the RGS is a slitless spectrometer with a large field of view, the spectral properties derived with this instrument should be regarded as field-of-view-averaged. Indeed, the RGS-derived abundances are consistent with being a spatially-weighted average of the EPIC ones. Abundance ratios, such as Mg/Fe or Si/Fe also show spatial structure.
Confirming our previous study (Origlia et al., 2004), the X-ray derived O abundance in the M82 centre is lower than the IR-derived one, at variance with the expectation that the X-ray emitting gas would be enriched with respect to the stars. Reminding that the X-ray emission from different elements preferably occurs at different temperatures, and that the main site for X-ray emission is the interface between the hot gas and the colder ambient material (Marcolini et al., 2005), we suggest that a significant fraction of the O VIII and O VII ions already have cooled off through interaction with cold material or the CE mechanism. Observations in the far ultraviolet regime could help clarify this issue.
Acknowledgments
The present version of this paper greatly benefited from a detailed and constructive report from an anonymous referee, who is warmly thanked for her/his job.
This work would not have been possible without the kindness and support of Prof. K. Makishima, director of the Cosmic Radiation Laboratory of the RIKEN institute, who allowed P.R. to work continuously on this project. P.R. would also like to thank A. Bamba, P. Gandhi, N. Isobe, N. Ota, A. Senda, M. Suzuki, Y. Terada, and all the staff of the above laboratory. We thank T. Tsuru and E. Costantini for valuable help and constructive discussions, and K. Arnaud for support of the XSPEC package.
This work was supported by a fellowship from the Japan Society for the Promotion of Science, and by two grants from the RIKEN institute. Part of this work was also supported by ASI/INAF contract I/023/05/0 and by PRIM/MUR grant 2006-02-5203.
References
- Alton et al. (1999) Alton P. B., Davies J. I., Bianchi S., 1999, A&A, 343, 51
- Beiersdorfer et al. (2003) Beiersdorfer P., Boyce K. R., Brown G. V., Chen H., Kahn S. M., Kelley R. L., May M., Olson R. E., Porter F. S., Stahle C. K., Tillotson W. A., 2003, Science, 300, 1558
- Bevington & Robinson (1992) Bevington P. R., Robinson D. K., 1992, Data reduction and error analysis for the physical sciences. McGraw-Hill
- Blumenthal & Gould (1970) Blumenthal G. R., Gould R. J., 1970, Reviews of Modern Physics, 42, 237
- Branduardi-Raymont et al. (2006) Branduardi-Raymont G., Bhardwaj A., Elsner R. F., Gladstone G. R., Ramsay G., Rodriguez P., Soria R., Waite Jr J. H., Cravens T. E., 2006, ArXiv Astrophysics e-prints
- Bressan et al. (1993) Bressan A., Fagotto F., Bertelli G., Chiosi C., 1993, A&AS, 100, 647
- Buote & Fabian (1998) Buote D. A., Fabian A. C., 1998, MNRAS, 296, 977
- Cappi et al. (1999) Cappi M., Persic M., Bassani L., Franceschini A., Hunt L. K., Molendi S., Palazzi E., Palumbo G. G. C., Rephaeli Y., Salucci P., 1999, A&A, 350, 777
- Chamberlain (1956) Chamberlain J. W., 1956, ApJ, 124, 390
- Cooke et al. (1969) Cooke B. A., Griffith R. E., Pounds K. A., 1969, Nature, 224, 134
- Cravens (1997) Cravens T. E., 1997, Geophys. Res. Lett., 24, 105
- Damiani et al. (1997) Damiani F., Maggio A., Micela G., Sciortino S., 1997, ApJ, 483, 350
- de Vaucouleurs et al. (1991) de Vaucouleurs G., de Vaucouleurs A., Corwin Jr. H. G., Buta R. J., Paturel G., Fouque P., 1991, Third Reference Catalogue of Bright Galaxies. Volume 1-3, XII, 2069 pp. 7 figs.. Springer-Verlag Berlin Heidelberg New York
- della Ceca et al. (1997) della Ceca R., Griffiths R. E., Heckman T. M., 1997, ApJ, 485, 581
- della Ceca et al. (1999) della Ceca R., Griffiths R. E., Heckman T. M., Lehnert M. D., Weaver K. A., 1999, ApJ, 514, 772
- den Herder et al. (2001) den Herder J. W., Brinkman A. C., Kahn S. M., Branduardi-Raymont G., Thomsen K., Aarts H., Audard M., Bixler J. V., den Boggende A. J., Cottam J., Decker T., Dubbeldam L., Erd C., Goulooze H., Güdel M., Guttridge P., Hailey C. J., Janabi K. A., Kaastra J. S., de Korte P. A. J., van Leeuwen B. J., Mauche C., McCalden A. J., Mewe R., Naber A., Paerels F. B., Peterson J. R., Rasmussen A. P., Rees K., Sakelliou I., Sako M., Spodek J., Stern M., Tamura T., Tandy J., de Vries C. P., Welch S., Zehnder A., 2001, A&A, 365, L7
- Dennerl et al. (2006) Dennerl K., Lisse C. M., Bhardwaj A., Burwitz V., Englhauser J., Gunell H., Holmström M., Jansen F., Kharchenko V., Rodríguez-Pascual P. M., 2006, A&A, 451, 709
- Dere et al. (2001) Dere K. P., Landi E., Young P. R., Del Zanna G., 2001, ApJS, 134, 331
- Djurić et al. (2005) Djurić N., Lozano J. A., Smith S. J., Chutjian A., 2005, ApJ, 635, 718
- Dogiel et al. (2002) Dogiel V. A., Inoue H., Masai K., Schönfelder V., Strong A. W., 2002, ApJ, 581, 1061
- Engelbracht et al. (2006) Engelbracht C. W., Kundurthy P., Gordon K. D., Rieke G. H., Kennicutt R. C., Smith J.-D. T., Regan M. W., Makovoz D., Sosey M., Draine B. T., Helou G., Armus L., Calzetti D., Meyer M., Bendo G. J., Walter F., Hollenbach D., Cannon J. M., Murphy E. J., Dale D. A., Buckalew B. A., Sheth K., 2006, ApJ, 642, L127
- Freedman et al. (1994) Freedman W. L., Hughes S. M., Madore B. F., Mould J. R., Lee M. G., Stetson P., Kennicutt R. C., Turner A., Ferrarese L., Ford H., Graham J. A., Hill R., Hoessel J. G., Huchra J., Illingworth G. D., 1994, ApJ, 427, 628
- Gabriel & Jordan (1972) Gabriel A. H., Jordan C., 1972, in Case studies in atomic collision physics, McDaniel, McDowell, eds. No. 2, p. 209
- Grevesse & Sauval (1998) Grevesse N., Sauval A. J., 1998, Space Science Reviews, 85, 161
- Griffiths et al. (2000) Griffiths R. E., Ptak A., Feigelson E. D., Garmire G., Townsley L., Brandt W. N., Sambruna R., Bregman J. N., 2000, Science, 290, 1325
- Heckman et al. (1990) Heckman T. M., Armus L., Miley G. K., 1990, ApJS, 74, 833
- Kallman & Palmeri (2007) Kallman T. R., Palmeri P., 2007, Reviews of Modern Physics, 79, 79
- Kaneda et al. (1997) Kaneda H., Makishima K., Yamauchi S., Koyama K., Matsuzaki K., Yamasaki N. Y., 1997, ApJ, 491, 638
- Koyama et al. (1986) Koyama K., Makishima K., Tanaka Y., Tsunemi H., 1986, PASJ, 38, 121
- Lallement (2004) Lallement R., 2004, A&A, 422, 391
- Landini & Monsignori Fossi (1970) Landini M., Monsignori Fossi B. C., 1970, A&A, 6, 468
- Lehnert et al. (1999) Lehnert M. D., Heckman T. M., Weaver K. A., 1999, ApJ, 523, 575
- Lemen et al. (1989) Lemen J. R., Mewe R., Schrijver C. J., Fludra A., 1989, ApJ, 341, 474
- Lupton et al. (2004) Lupton R., Blanton M. R., Fekete G., Hogg D. W., O’Mullane W., Szalay A., Wherry N., 2004, PASP, 116, 133
- Maeder & Conti (1994) Maeder A., Conti P. S., 1994, ARA&A, 32, 227
- Marcolini et al. (2005) Marcolini A., Strickland D. K., D’Ercole A., Heckman T. M., Hoopes C. G., 2005, MNRAS, 362, 626
- Masai et al. (2002) Masai K., Dogiel V. A., Inoue H., Schönfelder V., Strong A. W., 2002, ApJ, 581, 1071
- Matsumoto et al. (2001) Matsumoto H., Tsuru T. G., Koyama K., Awaki H., Canizares C. R., Kawai N., Matsushita S., Kawabe R., 2001, ApJ, 547, L25
- Matsushita et al. (2000) Matsushita S., Kawabe R., Matsumoto H., Tsuru T. G., Kohno K., Morita K.-I., Okumura S. K., Vila-Vilaró B., 2000, ApJ, 545, L107
- McWilliam (1997) McWilliam A., 1997, ARA&A, 35, 503
- Mewe et al. (1995) Mewe R., Kaastra J. S., Liedahl D. A., 1995, ApJ, 6
- Morrison & McCammon (1983) Morrison R., McCammon D., 1983, ApJ, 270, 119
- Mucciarelli et al. (2006) Mucciarelli P., Casella P., Belloni T., Zampieri L., Ranalli P., 2006, MNRAS, 365, 1123
- Origlia et al. (2004) Origlia L., Ranalli P., Comastri A., Maiolino R., 2004, ApJ, 606, 862
- Osterbrock (1989) Osterbrock D. E., 1989, Astrophysics of gaseous nebulae and active galactic nuclei. Research supported by the University of California, John Simon Guggenheim Memorial Foundation, University of Minnesota, et al. Mill Valley, CA, University Science Books, 1989, 422 p.
- Paerels & Kahn (2003) Paerels F. B. S., Kahn S. M., 2003, ARA&A, 41, 291
- Porquet et al. (2001) Porquet D., Mewe R., Dubau J., Raassen A. J. J., Kaastra J. S., 2001, A&A, 376, 1113
- Protassov et al. (2002) Protassov R., van Dyk D. A., Connors A., Kashyap V. L., Siemiginowska A., 2002, ApJ, 571, 545
- Ptak et al. (1999) Ptak A., Serlemitsos P., Yaqoob T., Mushotzky R., 1999, ApJS, 120, 179
- Ranalli et al. (2005) Ranalli P., Comastri A., Origlia L., Maiolino R., Makishima K., 2005, in Proceedings of the conference ”The X-ray universe 2005”, held in San Lorenzo de el Escorial, September 2005
- Ranalli et al. (2003) Ranalli P., Comastri A., Setti G., 2003, A&A, 399, 39
- Ranalli et al. (2006) Ranalli P., Origlia L., Comastri A., Maiolino R., 2006, in Proceedings of the workshop “High resolution X-ray spectroscopy: towards XEUS and Con-X” held at MSSL, 27-28 March 2006
- Read & Ponman (2003) Read A. M., Ponman T. J., 2003, A&A, 409, 395
- Read & Stevens (2002) Read A. M., Stevens I. R., 2002, MNRAS, 335, L36
- Rieke et al. (1980) Rieke G. H., Lebofsky M. J., Thompson R. I., Low F. J., Tokunaga A. T., 1980, ApJ, 238, 24
- Seaquist & Odegard (1991) Seaquist E. R., Odegard N., 1991, ApJ, 369, 320
- Silva et al. (2001) Silva L., Granato G. L., Bressan A., Lacey C., Baugh C. M., Cole S., Frenk C. S., 2001, Ap&SS, 276, 1073
- Singh et al. (1996) Singh K. P., White N. E., Drake S. A., 1996, ApJ, 456, 766
- Smith et al. (2001) Smith R. K., Brickhouse N. S., Liedahl D. A., Raymond J. C., 2001, ApJ, 556, L91
- Strickland & Heckman (2007) Strickland D. K., Heckman T. M., 2007, ApJ, 658, 258
- Strickland et al. (1997) Strickland D. K., Ponman T. J., Stevens I. R., 1997, A&A, 320, 378
- Strickland & Stevens (2000) Strickland D. K., Stevens I. R., 2000, MNRAS, 314, 511
- Strüder et al. (2001) Strüder L., Briel U., Dennerl K., Hartmann R., Kendziorra E., Meidinger N., Pfeffermann E., Reppin C., Aschenbach B., Bornemann W., Bräuninger H., Burkert W., Elender M., Freyberg M., Haberl F., Hartner G., Heuschmann F., Hippmann H., Kastelic E., Kemmer S., Kettenring G., Kink W., Krause N., Müller S., Oppitz A., Pietsch W., Popp M., Predehl P., Read A., Stephan K. H., Stötter D., Trümper J., Holl P., Kemmer J., Soltau H., Stötter R., Weber U., Weichert U., von Zanthier C., Carathanassis D., Lutz G., Richter R. H., Solc P., Böttcher H., Kuster M., Staubert R., Abbey A., Holland A., Turner M., Balasini M., Bignami G. F., La Palombara N., Villa G., Buttler W., Gianini F., Lainé R., Lumb D., Dhez P., 2001, A&A, 365, L18
- Sutherland & Dopita (1993) Sutherland R. S., Dopita M. A., 1993, ApJS, 88, 253
- Tanaka (2002) Tanaka Y., 2002, A&A, 382, 1052
- Tsuru et al. (2007) Tsuru T. G., Ozawa M., Hyodo Y., Matsumoto H., Koyama K., Awaki H., Fujimoto R., Griffiths R., Kilbourne C., Matsushita K., Mitsuda K., Ptak A., Ranalli P., Yamasaki N. Y., 2007, PASJ, 59, 269
- Turner et al. (2001) Turner M. J. L., Abbey A., Arnaud M., Balasini M., Barbera M., Belsole E., Bennie P. J., Bernard J. P., Bignami G. F., Boer M., Briel U., Butler I., Cara C., Chabaud C., Cole R., Collura A., Conte M., Cros A., Denby M., Dhez P., Di Coco G., Dowson J., Ferrando P., Ghizzardi S., Gianotti F., Goodall C. V., Gretton L., Griffiths R. G., Hainaut O., Hochedez J. F., Holland A. D., Jourdain E., Kendziorra E., Lagostina A., Laine R., La Palombara N., Lortholary M., Lumb D., Marty P., Molendi S., Pigot C., Poindron E., Pounds K. A., Reeves J. N., Reppin C., Rothenflug R., Salvetat P., Sauvageot J. L., Schmitt D., Sembay S., Short A. D. T., Spragg J., Stephen J., Strüder L., Tiengo A., Trifoglio M., Trümper J., Vercellone S., Vigroux L., Villa G., Ward M. J., Whitehead S., Zonca E., 2001, A&A, 365, L27
- Umeda et al. (2002) Umeda H., Nomoto K., Tsuru T. G., Matsumoto H., 2002, ApJ, 578, 855
- Wargelin et al. (2005) Wargelin B. J., Beiersdorfer P., Neill P. A., Olson R. E., Scofield J. H., 2005, ApJ, 634, 687
- Wilms et al. (2000) Wilms J., Allen A., McCray R., 2000, ApJ, 542, 914
- Woosley & Weaver (1995) Woosley S. E., Weaver T. A., 1995, ApJS, 101, 181
- Young & Scoville (1984) Young J. S., Scoville N. Z., 1984, ApJ, 287, 153