The outer scale of turbulence in the magneto-ionized Galactic interstellar medium
Abstract
We analyze Faraday rotation and depolarization of extragalactic radio point sources in the direction of the inner Galactic plane to determine the outer scale and amplitude of the rotation measure power spectrum. Structure functions of rotation measure show lower amplitudes than expected when extrapolating electron density fluctuations to large scales assuming a Kolmogorov spectral index. This implies an outer scale of those fluctuations on the order of a parsec, much smaller than commonly assumed. Analysis of partial depolarization of point sources independently indicates a small outer scale of a Kolmogorov power spectrum. In the Galaxy’s spiral arms, no rotation measure fluctuations on scales above a few parsecs are measured. In the interarm regions fluctuations on larger scales than in spiral arms are present, and show power law behavior with a shallow spectrum. These results suggest that in the spiral arms stellar sources such as stellar winds or protostellar outflows dominate the energy injection for the turbulent energy cascade on parsec scales, while in the interarm regions supernova and super bubble explosions are the main sources of energy on scales on the order of 100 parsecs.
1 Introduction
Turbulence in the ionized phase of the interstellar medium (ISM) of the Milky Way is well described on small scales, while its properties on larger scales are more uncertain. On scales smaller than m ( pc), the turbulence in the ionized medium is well characterized from diffractive and dispersive processes in the ISM influencing pulsar signals. The comprehensive study by Armstrong et al. (1995) showed that on scales of to m ( pc to pc) the power spectrum of electron density is well described by a power law with a spectral index consistent with the Kolmogorov spectral index (Kolmogorov, 1941). Most observed electron density power spectra are compatible with a Kolmogorov power spectrum (e.g. Spangler & Gwinn, 1990; Stinebring et al., 2000; Wang et al., 2005; You et al., 2007), although other spectral indices have been reported (e.g. Löhmer et al., 2001; Shishov et al., 2003). On larger scales the slope and extent of the electron density power spectrum are much more uncertain. Armstrong et al. (1995) include measurements of H I and of Faraday rotation measures for which uncertain assumptions about the correlation between H I and and about magnetic fields, respectively, needed to be made. Although these results suggest a power law that connects to the Kolmogorov power spectrum on small scales, these assumptions make the behavior of the power spectrum at larger scales somewhat speculative.
Fluctuations in the magneto-ionized medium on parsec scales have been measured using structure functions777A structure function measures the amount of fluctuations in a quantity as a function of the scale of the fluctuations. The second order structure function of a function is defined as , where is the position of a source in angular coordinates, is the separation between sources, i.e. the scale of the measured fluctuation, and means the averaging over all positions . of rotation measures (RMs) of extragalactic sources. Simonetti & Cordes (1986) showed that the structure function of high-latitude sources is flat, indicating that fluctuations in RM only exist on size scales smaller than the scales they probe, viz. about 3∘. This means that there is no contribution from large-scale fluctuations from the Milky Way in the RM (although a constant RM from the Milky Way is not ruled out), and that it is most likely the RM contribution intrinsic to the sources that dominates. This was confirmed by Leahy (1987). RM structure functions at lower latitudes, however, show structure functions consistent with a power law, although the slope tends to be shallower than a Kolmogorov slope (Simonetti & Cordes, 1986; Clegg et al., 1992). Other observations in or near the Galactic plane (Sun & Han, 2004; Haverkorn et al., 2003, 2006a) also find shallow slopes for RM structure functions.
Measurements of the outer scale of fluctuations, i.e. the scale at which a structure function saturates, differ considerably across the Galaxy. Lazaryan & Shutenkov (1990) used the autocorrelation function of synchrotron radiation to derive a typical scale of 90 pc at a distance of 1 kpc in a region near the north Galactic pole. Haverkorn et al. (2006a) studied sources in the Galactic plane and found that the outer scale of fluctuations is smaller than about 10 pc for the spiral arms, while it is roughly 100 pc for the interarm regions. A similar outer scale of pc in the magneto-ionized medium is found in the Large Magellanic Cloud using Faraday rotation (Gaensler et al., 2005), whereas H I measurements indicate a much larger outer scale of a few kpc in the Large Magellanic Cloud (Elmegreen et al., 2001), Small Magellanic Cloud (Stanimirović et al., 1999), and in external galaxies (Westpfahl et al., 1999; Elmegreen et al., 2003). Han et al. (2004) estimated a magnetic energy spectrum with a slope of up to scales of 15 kpc. They suggest that a magnetic energy spectrum which is flatter than Kolmogorov on scales larger than the injection scale of pc is dictated by magnetic helicity inversely cascading up from the injection scale to larger scales. However, the pulsar rotation measure and dispersion measure data they use for the power law fit has a scatter of several orders of magnitude, making the resulting spectrum uncertain.
Stellar sources of energy input are expected to dominate the turbulent driving in the Milky Way, except in the outskirts of the Galaxy where star formation is low and gravitational sources and instabilities such as the magneto-rotational instability (Balbus & Hawley, 1991; Hawley & Balbus, 1991) come into play (Selwood & Balbus, 1999). The stellar sources include supernovae, superbubbles, stellar winds, protostellar outflows and H II regions. Norman & Ferrara (1996) calculate a broadband source function mostly dominated by supernovae, which is confirmed by Mac Low & Klessen (2004). The Norman & Ferrara (1996) source function shows a contribution of superbubbles to the turbulent driving on scales above 100 pc to about a kpc. Turbulent driving on these scales is not observed, possibly because of the finite extent of the Galaxy. So a maximum driving scale of about 100 pc due to supernovae is often implicitly assumed, although it is not unlikely that these sources inject energy into the medium (also) on smaller scales.
What, if any, is the relation of the electron density and magnetic field fluctuations at these large scales to the Kolmogorov-like spectrum below m? Can both sets of observations be reconciled with one spectrum from kilometer to parsec scales? What are the characteristics of the fluctuations in the ionized ISM on larger scales?
We address these questions in this paper, using RM structure functions from extragalactic sources behind the inner Galactic plane. These data are discussed in Section 2. We determine the outer scale of fluctuations using two independent methods: (1) the amplitude and slope of the structure function indicate an uncommonly small outer scale of Kolmogorov turbulence in the magneto-ionized ISM, as we will explain in Section 3, and (2) the same conclusions can be drawn from analysis of depolarization of extragalactic point sources by the Galactic ISM, as shown in Section 4. Section 5 gives arguments for a steeper (Kolmogorov) power spectrum on small scales, and a discussion of the results can be found in Section 6. Section 7 provides a summary and conclusions.
2 Data analysis of polarized extragalactic point sources
The data used are from the Southern Galactic Plane Survey (SGPS, McClure-Griffiths et al., 2005; Haverkorn et al., 2006), a neutral hydrogen and full-polarization 1.4 GHz continuum survey of the Galactic plane. The continuum part spans an area of and and contains 148 polarized sources of which the rotation measure is measured unambiguously (Brown et al., 2007). The data were obtained with the Australia Telescope Compact Array (ATCA) and are publicly available888http://www.atnf.csiro.au/research/cont/sgps/queryForm.html. For more details on the data reduction see Brown et al. (2007).
Two corrections have been applied to our sample of extragalactic sources. Firstly, structure functions are sensitive to large-scale gradients in electron density across the field of view and include a geometrical component due to the change in direction of the regular magnetic field, (see e.g. Brown et al., 2007). As a first order correction, we approximate this with a 2D linear gradient in RM, and subtract this from the region over which a structure function is computed. Furthermore, lines of sight through discrete structures like H ii regions and supernova remnants can have deceptively large RMs due to an increased electron density and possibly magnetic field within these localized structures (Mitra et al., 2003). Therefore, we have used the total intensity 1.4 GHz radio data from the ATCA combined with Parkes single-dish data as well as H maps (Finkbeiner, 2003) to discard 27 extragalactic sources with a sight line passing through a visible supernova remnant or H ii region. These sources are listed in Table 1. We recognize that omitting RMs through discrete high density regions may introduce a bias in the structure function, viz. decrease the structure function amplitude on large scales. However, the results are very similar to results without discarding extreme RMs (cf. Haverkorn et al., 2006a), indicating that the bias, if present, is low.
| RM | RM | RM | |||||||||
|---|---|---|---|---|---|---|---|---|---|---|---|
| 355.42 | -0.81 | 600.53 | H | 308.93 | 0.40 | -752.10 | I | 267.03 | 0.04 | 298.38 | I |
| 351.82 | 0.17 | 134.43 | I | 308.73 | 0.07 | -661.47 | I | 263.22 | 1.08 | 826.49 | H |
| 337.19 | 0.02 | 56.25 | I | 299.42 | -0.23 | 534.50 | I | 263.20 | 1.07 | 739.48 | H |
| 337.06 | 0.85 | -738.88 | I | 295.29 | -1.23 | -43.36 | H | 260.69 | -0.23 | 203.78 | H |
| 333.72 | -0.27 | 204.08 | I | 295.23 | -1.05 | -206.71 | H | 260.52 | -0.55 | 247.36 | H |
| 332.14 | 1.03 | -754.43 | I | 294.38 | -0.75 | 470.04 | H | 260.41 | -0.43 | 221.22 | H |
| 329.48 | 0.22 | -100.23 | I | 294.29 | -0.90 | 449.20 | H | 259.78 | 1.22 | 250.40 | H |
| 312.37 | -0.03 | -438.49 | I | 288.27 | -0.70 | 491.08 | H | 254.16 | -0.34 | -337.84 | H |
| 309.06 | 0.84 | -504.17 | I | 282.07 | -0.78 | 861.69 | I | 253.68 | -0.60 | -348.90 | H |
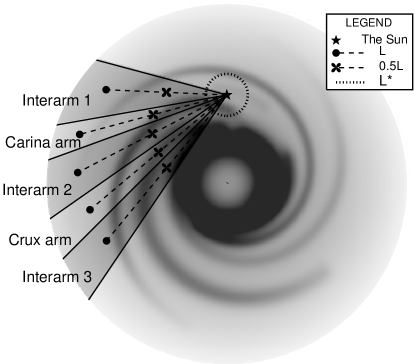
The SGPS data probe the inner Galaxy, which includes a number of spiral arms. Consequently, these data are well-suited to study differences in the structure in the ISM in spiral arms and in interarm regions. We constructed second-order structure functions of RM, , for different lines of sight in ’spiral arms’, i.e. lines of sight primarily through spiral arms, and ’interarm regions’, sight lines mostly through interarm regions, estimated from the spiral arm positions in Cordes & Lazio (2002). The lines of sight used to separate spiral arms and interarm regions are shown in Fig. 1. The error bars denote errors propagated from uncertainties in the RM values. For lines of sight at high longitudes close to the Galactic center it is not possible to distinguish between ‘spiral arm lines of sight’ and ’interarm lines of sight’, because spiral arms start running perpendicular to the line of sight. Therefore, we do not use data at in this analysis.
Figure 2 shows for spiral arms and interarm regions. The figure is similar to Fig. 1 in Haverkorn et al. (2006) except here we have used the finalized RM list in Brown et al. (2007), and discarded the 27 sources in Table 1. The spiral arm structure functions are flat, while in interarm regions the structure functions rise, and in two out of three cases show a turnover from a power law at small scales to flat at the larger scales. The location of the turnover is interpreted as the largest angular scale of structure in the interarm regions. Using the argument that the largest angular scales in RM are probably coming from nearby, assuming a distance of 2 kpc yields an outer scale at a spatial scale of about pc. For the spiral arms we can only say that the outer scale of structure, i.e. the smallest scale we probe, is smaller than about 10 pc (Haverkorn et al., 2006a).
The amount of sources used to estimate the structure functions are 50, 20 and 18 for the respective interarm regions, and 8 sources for each of the spiral arms. Given the low source density in the spiral arms, we assess the reliability of the results here. The bin size is somewhat restricted due to the paucity of sources, but bin sizes between 0.5∘ and 1∘ are reasonable and yield comparable results.
Figure 3 shows the structure functions of RMs towards the Carina and Crux arms without any binning of sources. The solid lines give linear fits of the data, confirming our statement that the structure function in the spiral arms is flat. In the Carina arm, the seven uppermost points (all at ) are the combination of one source with extreme RM and all other sources in the region. The presence of this extreme source makes clear why the two data points on the largest scales are lower than the other points: on these scales the extreme RM source does not contribute. Furthermore, this explains why the amplitude of the structure function is higher in the Carina arm than in the Crux arm: omitting this source yields comparable amplitudes for both arms.
However, we are hesitant to discard sources on the basis of extreme RM alone, as there is no reason per se why these sources would not be part of the spectrum. Therefore, we only omit sources visibly behind a discrete structure, as discussed above, and leave this extreme RM source in the dataset, while commenting on changes when this source is omitted.
We can estimate the outer scale from modeling of the amplitude and slope of the structure functions, or from the amount of depolarization of the point sources by the Galaxy. These two methods will be discussed in Sections 3 and 4, respectively.


3 Outer scale from rotation measure structure functions
The structure function slopes in Fig. 2 are , and for interarm regions 1, 2, and 3, respectively, much shallower than those expected from a Kolmogorov structure function, which has a slope . However, we argue in this section that on smaller scales the RM structure function has to turn over to a steeper slope to be consistent with observations of electron density fluctuations on smaller scales (e.g., Armstrong et al., 1995); additional arguments for a steeper RM power spectrum on smaller scales are given in Section 5.
Minter & Spangler (1996, hereafter MS96) developed a formalism to describe the structure function of RM assuming power spectra in magnetic field fluctuations and in electron density fluctuations which are zero-mean, isotropic, Gaussian, and independent. Assuming Kolmogorov turbulence the RM structure function, , can be described as:
| (1) | |||||
where is the mean electron density, is the mean magnetic field strength along the line of sight, the outer scale of the Kolmogorov turbulence, and the length of the line of sight. The coefficients and are defined in the description of the magnetic field and density fluctuations as power laws with the same outer scale and spectral index such that
| (2) |
where wave number and . A similar expression applies for . The spectral index of the power spectrum is for Kolmogorov turbulence, and is related to the slope of the structure function as for (Rickett, 1977). Equation 1 is only valid if , which is only true on scales smaller than what we observe. However, arguing that the slope turns over to Kolmogorov on smaller scales, we use a Kolmogorov dependence according to equation (1) on scales , which flattens to the shallow or flat observed spectra for .
Most of the input parameters in equation (1) are known, so that by joining this equation with RM structure functions in Figure 2 the outer scale of Kolmogorov turbulence can be computed. The amplitude of the electron density fluctuations is taken to be m-20/3 (Armstrong et al., 1995), and the magnetic field fluctuations can be derived from the observed value from MS96 as G2 m-2/3, where is the strength of the random component of in G and is in parsecs. Values for the mean electron density , mean magnetic field , random magnetic field , and distance to the emission will be derived in the following subsections.
3.1 Magnetic field
A number of estimates of the total magnetic field strength in the Galaxy, based on a number of observations, indicate that the total magnetic field strength is around G at the Solar radius. Heiles (1995) gives an extended discussion about the different ways to determine Galactic magnetic field strengths, i.e. using the synchrotron emissivity under the assumption of minimum energy or minimum pressure, or with the cosmic ray density measured in the solar neighborhood, and using Faraday rotation from pulsars. His estimates for the total magnetic field in the solar neighborhood range from 4 to G for different assumptions, while he estimates G at Galactocentric radius kpc. More recently, Strong et al. (2000) modeled cosmic ray evolution and propagation in the Milky Way, using constraints from synchrotron and -ray emission. Their results indicate a total magnetic field strength of 6.1 G at the solar circle, increasing exponentially towards the inner Galaxy with a scale length of 10 kpc. These measurements are in good agreement with each other, with results from synchrotron radiation (Beck et al., 1996) and from pulsars (Han et al., 2004).
We can estimate the relative strengths of the magnetic field in the spiral arms and interarm reasons from Fig. 7b in Beuermann et al. (1985), which shows that the mean volume emissivity in the spiral arms is twice as high as the mean volume emissivity in the interarm regions, i.e. , where the average volume emissivity is . Therefore, the total magnetic field strength in the spiral arms must be that in the interarm regions999We follow the argument put forth in Heiles (1995), although he uses . His approximation is reasonable in the outer Galaxy. However, the Beuermann et al. (1985) synchrotron maps indicate that is more appropriate in the inner Galaxy., where the exponent occurs because in the minimum energy approximation . We adopt the dependence of the magnetic field strength on Galactocentric radius in Strong et al. (2000), and correct for the relative strengths in the arms and interarm regions as given above, leading to the total field strengths given in Table 2. The regular magnetic field component is estimated by Han et al. (2006) from pulsar dispersion and rotation measures as G, increasing exponentially inwards with a scale length of 8.5 kpc. We adopt these values for the regular magnetic field strength, so that , independent of Galactocentric radius. The component of the regular magnetic field parallel to the line of sight in equation (1) is evaluated through , where is the angle between the line of sight and the regular magnetic field . A pitch angle of (Vallée, 2004) is assumed, but a pitch angle of 0∘ gives no significant changes.
3.2 Electron density
The average electron density used for each line of sight is derived from the NE2001 electron density model (Cordes & Lazio, 2002). The electron density was evaluated from the model for a particular line of sight centrally through each arm and each interarm region. The adopted average electron density is the average density over the adopted line of sight. Most of the structure in NE2001 is on such large scales that a change in direction of the line of sight of a degree or so does not influence the results significantly in any of the lines of sight. The adopted values for the mean electron density along each line of sight can be found in Table 2.
3.3 Distances
Two different distances for modeling are needed: , the total path length of the Faraday rotating material, and , the distance used to convert the outer scale of fluctuations from angular to spatial scales, both of which are shown in Fig. 1. The distance is chosen as the distance to the point for which 90% of the electron density is contained along the path, and is given in Table 2. Subsequently, the distance from the sun at which is computed for each sight line is .
If the statistical properties of the medium do not change along a given line of sight, the distance at which a certain angular scale is expected to correspond to the largest spatial scale is a small distance. Consequently, , which corresponds to the largest spatial scale , should be different from , and is estimated to be 2 kpc.
These distances are very rough estimates. However,we show in Section 3.5 that the sensitivity of our conclusions to the anticipated error in distances is low.
3.4 Results from RM structure functions

We extrapolate the observed slopes to smaller scales, with a steepening to a Kolmogorov spectrum at scale , which is the outer scale of the Kolmogorov part of the spectrum. The constraint of equal amplitudes between the Kolmogorov structure function on the small scales and the shallower structure function on the larger scales at turnover scale yields
| (3) |
where is the spectral index of the shallower structure function. In reality the structure function will not make a sharp break as described here and instead will show a gradual turnover over a range of scales (e.g., Haverkorn et al., 2004), but we use this parameterization as a good first approximation. Combining equations (1) and (3) for yields
| (4) | |||||
where , and are constants derived from the known variables in equation (1), and is the spectral index of the structure function. We fit equation (4) to the observed structure functions to obtain estimates for the outer scale of the Kolmogorov part of the power spectrum (SF), with results given in Table 2.
To compare our results with the Kolmogorov spectra found in electron density, we evaluate the structure function of RM caused by electron density fluctuations only (), shown as the dotted lines in Fig. 4 for the input parameters of the Carina and the Crux arm. This is a lower limit for the structure function of RM if the power spectrum of electron density on small scales is extrapolated to the large (parsec) scales discussed here. The spiral arm data, plotted as asterisks in Fig. 4, fall below the extrapolation of to large scales, indicating that has to turn over at smaller scales where the dotted and dashed lines in Fig. 4 meet. The same argument holds for the interarm data, which are not shown in the Figure for clarity. Although the input parameters are uncertain, this result is remarkably stable against variations of the input parameters (Section 3.5). For fluctuations in electron density only, this turnover scale is around 3 pc (1 pc) for the Carina (Crux) arm. If magnetic field fluctuations are present as well, the turn over scale is a little smaller, as noted in Table 2. Therefore, the Kolmogorov spectrum in electron density on small scales, if extrapolated towards larger scales, does not extend all the way up to scales of pc as previously assumed, but displays a break to a shallower slope (interarms) or a constant value (spiral arms). If it did, equation (4) demonstrates that at a scale pc, would be 2.3 orders of magnitude higher than the observed values.
3.5 Sensitivity of results to input parameters
Due to the non-straightforward dependence of on in equations (3) and (4), we tested numerically how sensitive the results are to variations in the input parameters , and . If the path length is increased or decreased by 30%, this will decrease or increase the resulting outer scale by a factor of 50% . The same effect is seen for an increase or decrease in or by a factor two. Although it makes sense to assume that the largest angular scales correspond to the largest spatial scales at some nearby position along the line of sight, as we have done, even if we assume that the largest spatial scales are at the midway distance along the line of sight, , the obtained outer scale pc for both arms and interarm regions. Also, if the amplitude of electron density were a factor 10 different in our data from the data in Armstrong et al. (1995), the outer scale would change by less than 50%. As the results are fairly robust against reasonable changes in the input parameters, we feel confident in asserting that the outer scale of Kolmogorov turbulence must be on the order of a few parsecs. We note, however, that due to the assumptions made and uncertainties in input parameters, a relatively large uncertainty in the determined outer scale has to be taken into account.
4 Outer scale from depolarization of point sources

An independent estimate of the outer scales of magneto-ionic structure can be made from depolarization of extragalactic point sources, if caused by structure in the foreground ISM on angular scales smaller than the size of the (unresolved) source. Intrinsic variations in polarization angle causing partial depolarization are expected to arise within any polarized extragalactic source. Indeed, no source in our sample exhibits the theoretical maximum degree of polarization of around 70% (Pacholczyk, 1970) but instead observed degrees of polarization lie typically below 10%. Depolarization by foreground components can be caused by beam depolarization due to magnetic field and/or electron density fluctuations on scales smaller than the source size (see e.g. Gaensler et al., 2005) or by bandwidth depolarization (see e.g. Stil & Taylor, 2007). Bandwidth depolarization is given by , where (Gardner & Whiteoak, 1966). However, significant bandwidth depolarization across our frequency band (8 MHz) can only be achieved by rad m-2, much higher than observed RMs. Therefore, any foreground depolarization in our data is caused by beam depolarization across the face of the source rather than bandwidth depolarization.
Figure 5 shows RMs in the upper panel and degree of polarization, , in the bottom panel. A clear anti-correlation between RM and is visible especially at the lower longitudes. As the scale of the structure in RM and is several degrees, this cannot be intrinsic to the sources but instead must be caused by the Galactic ISM. This agrees with the results of Gaensler et al. (2005) who found an anticorrelation between degree of polarization and H, which is correlated with RM. Due to the power law nature of RM as a function of scale, a high RM also indicates large fluctuations in RM. This is shown in Figure 6, which shows the standard deviation in RM as a function of fractional polarization, for all data together and for the spiral arms and interarm regions separately. As expected, the data in the spiral arms show a higher standard deviation in RM and a lower fractional polarization than in the interarm regions.
The Galactic component of depolarization can be estimated from the power law spectrum of RM fluctuations. The angular size of the outer scale of structure is much larger than the angular source size . In this approximation , the depolarization by a power spectrum of RM fluctuations is given by the degree of polarization , adapted from Tribble (1991) as:
| (5) |
where is the degree of polarization of the extragalactic source when its radiation arrives at the Milky Way, and is the size of the source. The RM standard deviation , structure function slope and outer scale are related via the structure function for .
A decrease in degree of polarization with increasing standard deviation in RM , as predicted by equation 5, is visible in Figure 6 for all data together and for the spiral arms and interarm regions separately. As expected, the data in the spiral arms show a higher standard deviation in RM and a lower fractional polarization than in the interarm regions. With an estimate of and , we can fit as a function of to the data points, and obtain a best-fit outer scale .
The amount of intrinsic depolarization resulting in polarization degree can be estimated from the extragalactic sources observed around the LMC (Gaensler et al. 2005) to be 10.4%, which we assume is the average degree of polarization of unresolved point sources at 1.4 GHz for which all depolarization is intrinsic. With these assumptions, the depolarization below 10.4% is then due to the variations in Galactic RM across the face of the source with a median size of 6 arcsec for this flux density range (Gaensler et al. 2005). Note that the percentage of intrinsic depolarization is higher than the actual average degree of polarization due to a selection of strong, highly-polarized sources over weak, weakly polarized ones, and due to selection of sources with linear behavior. However, since we are interested in the relative depolarization only, this selection effect does not influence our conclusions.
In the spiral arms it is straightforward to use equation (5) to determine the outer scale needed to obtain the observed depolarization. Assuming Kolmogorov turbulence (), we determine the value of the RM standard deviation from the structure function saturation level. For the interarm regions we observe a spectrum which is considerably shallower than a Kolmogorov spectrum. Assuming that this spectrum turns over to a steeper Kolmogorov spectrum towards small scales, the Kolmogorov slope on small scales will dominate the depolarization of the point sources. Therefore can be assumed to be the value of the structure function at the scale , which is the outer scale of the Kolmogorov turbulence, i.e. the scale at which the Kolmogorov slope turns over into a shallower slope.
The data are best represented by equation (5) for , and for all data, spiral arms and interarm regions, respectively (shown in Figure 6 as a solid line, with outer scales twice higher and lower indicated by dashed lines), so that the outer scales of Kolmogorov turbulence are approximately 8.7 pc in the spiral arms and 3.5 pc in the interarm regions. The data in the spiral arms are fairly sparse - confirming additional depolarization in the spiral arms - so that the standard deviations and the fit to the model are uncertain. However, in the interarm regions the depolarization model is a good fit to the data, and the probability that the standard deviations are constant with fractional polarization is .
The estimates of from depolarization are somewhat larger than from the structure function analysis. However, if we consider that the errors in the distances are large, in conjunction with assumptions such as the lack of correlation between magnetic field and electron density, the difference in estimates of from the two methods is not necessarily significant. Certainly both methods indicate that the outer scale of the Kolmogorov spectrum is likely a few parsecs, much smaller than the previously assumed value of pc.

5 Expected steep spectrum on small scales
As argued in the previous section, the RM structure function has to turn over to steeper slopes on smaller scales to be consistent with the electron density fluctuation data on smaller scales. There are two additional reasons why the RM structure functions cannot continue to have the same shallow or flat slope on smaller scales.
Firstly, a steep Kolmogorov-like magnetic field power spectrum is indicated by cosmic ray data. As cosmic rays are most effectively scattered by magnetic field fluctuations on the same scale as their ion gyro radius, cosmic ray losses as a function of energy are closely related to the magnetic field power spectrum. The cosmic ray distribution as calculated from a leaky box model can explain cosmic ray observational data if the Galactic magnetic field has a power spectrum with a Kolmogorov spectral index (Jokipii, 1988). Furthermore, the cosmic ray power spectrum is remarkably smooth101010The steepening of the spectrum around eV (the “knee”) and flattening around eV (the “ankle”) are very slight and not relevant for this argument. on scales of to eV, corresponding to gyro radii of to cm. Therefore, the magnetic field power spectrum is also expected to be smooth on these scales.
However, recent numerical simulations show that the magnetic field power spectrum does not necessarily follow the electron density spectrum. In fact, magnetohydrodynamic simulations in the limit of a weak homogeneous magnetic field show that the magnetic field fluctuations are all concentrated on scales much smaller than those under discussion here (Schekochihin et al., 2002). This would indicate a flat structure function of magnetic field on larger scales. At first sight, this theory agrees with the observations shown in Fig. 2, where the weak-mean-field approximation could be applicable to the spiral arms, and structure functions would be expected to be flat. However, this would indicate that magnetic field fluctuations of a few microgauss would be present on scales as small as a fraction of a parsec. In this case the degree of polarization, , as a function of the intrinsic degree of polarization, , is given by
| (6) |
(Burn, 1966; Sokoloff et al., 1998) in the approximation that the scale of the fluctuations is much smaller than the telescope beam. The standard deviation of RM, , is derived from the flat structure functions in the spiral arms. Therefore, magnetic field fluctuations on these scales would completely depolarize the synchrotron radiation in the Galaxy at 1.4 GHz. Since we observe polarized radiation at this frequency coming from all over the Galactic plane (e.g. Taylor et al., 2003; Haverkorn et al., 2006), magnetic field fluctuations cannot remain at this magnitude towards smaller scales. Instead, we showed in Section 4 that the observed amount of depolarization is consistent with a RM structure function with a Kolmogorov slope and an outer scale of a few parsecs or smaller.
| region | longitude | (SF) | (depol) | ||||
| [ | [G] | [cm-3] | [kpc] | [kpc] | [pc] | [pc] | |
| Interarm 1 | 255 - 280 | 4.5 | 0.03 | 11.5 | 2 | 2.3 | 3.5 |
| Interarm 2 | 290 - 305 | 4.6 | 0.045 | 16 | 2 | 0.8 | 8.7 |
| Interarm 3 | 315 - 326 | 5.2 | 0.075 | 18 | 2 | 0.3 | 3.5 |
| Carina arm | 280 - 290 | 8.3 | 0.06 | 14.5 | 2 | 2.4∗ | 8.7 |
| Crux arm | 305 - 315 | 9.0 | 0.07 | 17 | 2 | 1.0 | 3.5 |
| ∗ This value is 0.65 pc if the extreme RM source discussed in Section 2 is omitted. | |||||||
6 Discussion
The conclusion that the outer scale of turbulence in the spiral arms is observed to be on the order of a few parsecs is not expected or straightforward. Based on evidence discussed in the introduction, outer scales of turbulence are expected to be on the order of 100 pc, which is one or two orders of magnitude higher than those observed here. Earlier work noted the small outer scale of fluctuations in the spiral arms, but attributed that outer scale likely to H II regions along the line of sight (Haverkorn et al., 2006a). H II regions are ubiquitous enough in the spiral arms to dominate fluctuations in RM, and this solution would reconcile a larger outer scale of turbulence with a smaller observed outer scale of RM fluctuations. However, if this were the case, the amplitude of the RM structure functions would lie above the amplitude of the turbulence structure function. Our estimate of the amplitude of the RM structure functions indicates that the observed structure functions lie far below the lower limit for the RM structure function if extrapolated from electron density fluctuations on small scales. If the fluctuations in RM associated with Kolmogorov turbulence were to continue up to scales of a hundred parsecs, the observed amplitude of the structure function of RM would be much higher than that observed.
In the interarm regions, a plausible option is multiple scales of energy input: for supernova-driven turbulence, the outer scale is believed to be about 100 pc (as observed). However, if energy sources such as stellar winds or outflows, interstellar shocks or H ii regions input a significant amount of energy into the interstellar turbulence on smaller scales (typically parsecs, Mac Low & Klessen (2004)), this may flatten the structure function on scales of pc to scales of pc, consistent with our observations.
This does not contradict earlier studies that reported outer scales of the order of 100 pc. Simonetti & Cordes (1986) found larger outer scales, but their data included large parts of the sky, most or all of which were located at higher latitudes. Clegg et al. (1992) present some data in the Galactic plane, but the outer scale of fluctuations in those data is not well determined due to the paucity of data and the included geometrical component of the magnetic field. Leahy’s (1987) structure functions of RMs of sources in the Galactic plane are consistent with an outer scale of a parsec, as is the analysis of DM variations of close pulsar pairs in globular clusters (Smirnova & Shishov, 2002; Ransom, 2007).
So the picture arises of a smaller energy input scale of turbulence or fluctuations in the magneto-ionized ISM in the Galactic plane, while larger-scale structure exists in the Galactic thick disk or halo. Indications of increasing correlation lengths of the magnetic field with height above the galaxy case have been found in a number of external galaxies (Dumke et al., 1995).
7 Summary and conclusions
Faraday rotation measurements of polarized extragalactic sources behind the inner Galactic plane have been used to study the characteristics of the magnetized, ionized interstellar medium in the plane, in particular in the spiral arms and in interarm regions. Rotation measure structure functions show a shallow slope in the interarm regions and saturation on a scale of pc, i.e. there are no fluctuations on scales larger than the saturation scale. Flat structure functions in the spiral arms indicate that the outer scale of RM fluctuations in the spiral arms is smaller than pc, the smallest scale observed. These shallow and flat structure functions must turn over to steeper slopes towards smaller scales for three reasons: (1) to match up with the electron density power spectrum on subparsec scales, assuming the large and small scale datasets are part of the same power spectrum; (2) a shallow RM structure function on smaller scales would give more depolarization than observed; and (3) cosmic ray distribution data and the smooth cosmic ray power spectrum indicate a smooth magnetic field power spectrum with a slope similar to the Kolmogorov slope. The scale of the break in the structure function is the outer scale of the Kolmogorov power spectrum , and is estimated using two independent methods: the analysis of RM structure functions, and by modeling the depolarization of the extragalactic sources. Given the large uncertainties in input parameters, both methods agree reasonably well and imply an outer scale of the Kolmogorov slope of a few parsecs. This estimate is almost two orders of magnitude smaller than the generally assumed outer scale of ISM turbulence of pc. However, extrapolating the observed electron density fluctuations on small scales to parsec scales shows that the amplitude of the structure function would be orders of magnitude higher if the Kolmogorov spectrum did in fact extend out to 100 pc. Instead, the outer scale of Kolmogorov turbulence that we obtained from our observations indicates that energy in ISM turbulence is injected on scales of a parsec rather than 100 pc. This is the main energy injection scale in the spiral arms, which show flat structure functions on scales larger than that. In the interarm regions, the structure functions keep rising although not as steep as Kolmogorov turbulence, indicating an additional source of structure. We propose that in the spiral arms stellar energy sources such as stellar winds and protostellar outflows are the predominant sources of turbulence, whereas in the interarm regions there is evidence of energy injection on larger scales, most likely caused by supernova remnant and superbubble expansion.
References
- Armstrong et al. (1995) Armstrong, J. W., Rickett, B. J., & Spangler, S. R. 1995, ApJ, 443, 209
- Balbus & Hawley (1991) Balbus, S. A., & Hawley, J. F. 1991, ApJ, 376, 214
- Beck et al. (1996) Beck, R., Brandenburg, A., Moss, D., et al. 1996, ARA&A, 34, 155
- Beuermann et al. (1985) Beuermann, K., Kanbach, G., & Berkhuijsen, E. M. 1985, A&A, 153, 17
- Brown et al. (2007) Brown, J. C., Haverkorn, M., Gaensler, B. M., Taylor, A. R., Bizunok, N. S., McClure-Griffiths, N. M., Dickey, J. M., & Green, A. J. 2007, ApJ, 663, 258
- Burn (1966) Burn, B. J. 1966, MNRAS, 133, 67
- Clegg et al. (1992) Clegg, A. W., Cordes, J. M., Simonetti, J. M., & Kulkarni, S. R. 1992, ApJ, 386, 143
- Cordes & Lazio (2002) Cordes, J. M., & Lazio, T. J. W. 2002, preprint (astro-ph/0207156)
- Dumke et al. (1995) Dumke, M., Krause, M., Wielebinski, R., & Klein, U. 1995, A&A, 302, 691
- Elmegreen et al. (2003) Elmegreen, B. G., Elmegreen, D. M., & Leitner, S. N. 2003, ApJ, 590, 271
- Elmegreen et al. (2001) Elmegreen, B. G., Kim, S., & Staveley-Smith, L. 2001, ApJ, 548, 749
- Finkbeiner (2003) Finkbeiner, D. P. 2003, ApJS, 146, 407
- Gaensler et al. (2005) Gaensler, B. M., Haverkorn, M., Staveley-Smith, L., Dickey, J. M., McClure-Griffiths, N. M., Dickel, J. R., Wolleben, M., 2005, Science, 307, 1610
- Gardner & Whiteoak (1966) Gardner, F. F., & Whiteoak, J. B. 1966, ARAA, 4, 245
- Han et al. (2006) Han, J. L., Manchester, R. N., Lyne, A. G., Qiao, G. J., & Van Straten, W. 2006, ApJ, 642, 868
- Han et al. (2004) Han, J. L., Ferrière, K., & Manchester, R. N. 2004, ApJ, 610, 820
- Haverkorn et al. (2006a) Haverkorn, M., Gaensler, B. M., Brown, J. C., Bizunok, N. S., McClure-Griffiths, N. M., Dickey, J. M., & Green, A. J. 2006a, ApJL, 637, 33
- Haverkorn et al. (2006) Haverkorn, M., Gaensler, B. M., McClure-Griffiths, N. M., Dickey, J. M., & Green, A. J. 2006b, ApJS, 167, 230
- Haverkorn et al. (2004) Haverkorn, M., Gaensler, B. M., McClure-Griffiths, N. M., Dickey, J. M., & Green, A. J. 2004, ApJ, 609, 776
- Haverkorn et al. (2003) Haverkorn, M., Katgert, P., de Bruyn, A. G. 2003, A&A, 403, 1045
- Hawley & Balbus (1991) Hawley, J. F., & Balbus, S. A. 1991, ApJ, 376, 223
- Heiles (1995) Heiles, C. 1995, in The Physics of the Interstellar Medium and Intergalactic Medium, ed. by A. Ferrara, C. F. McKee, C. Heiles, & P. R. Shapiro, p. 507
- Jokipii (1988) Jokipii, J. R. 1988, in proceedings of the AIP Conference Radio wave scattering in the interstellar medium, ed. J. M. Cordes, B. J. Rickett & D. G. Backer, p. 48
- Kolmogorov (1941) Kolmogorov, A. N., 1941, Dokl. Akad. Nauk SSSR, 30, 301
- Landecker et al. (2006) Landecker, T. L., Reid, R. I., Wolleben, M., Reich, W., Kothes, R., Del Rizzo, D., Uyanıker, B., Gray, A. D., & Taylor, A. R. 2006, AAS, 208, 4909
- Lazaryan & Shutenkov (1990) Lazaryan, A. L., & Shutenkov, V. P. 1990, SvAL, 16, 297L
- Leahy (1987) Leahy, J. P. 1987, MNRAS, 226, 433
- Löhmer et al. (2001) Löhmer, O., Kramer, M., Mitra, D., Lorimer, D. R., & Lyne, A. G. 2001, ApJ, 562, L157
- Mac Low & Klessen (2004) Mac Low, M.-M., & Klessen, R. S. 2004, Rev. Mod. Phys., 76, 1, 125
- McClure-Griffiths et al. (2005) McClure-Griffiths, N. M., Dickey, J. M., Gaensler, B. M., Green, A. J., Haverkorn, M., Strasser, S. 2005, ApJS, 158, 178
- Minter & Spangler (1996) Minter, A. H., & Spangler, S. R. 1996, ApJ, 458, 194
- Mitra et al. (2003) Mitra, D., Wielebinski, R., Kramer, M., & Jessner, A. 2003, A&A, 398, 993
- Norman & Ferrara (1996) Norman, C. A., & Ferrara, A. 1996, ApJ, 467, 280
- Pacholczyk (1970) Pacholczyk, A. B. 1970, “Radio Astrophysics”, W. H. Freeman and Co.
- Ransom (2007) Ransom, S. M. 2007, in SINS - Small Ionized and Neutral Structures in the Diffuse Interstellar Medium, eds. M. Haverkorn and W. M. Goss, San Francisco: Astronomical Society of the Pacific, p. 265
- Rickett (1977) Rickett, B. J. 1977, ARA&A, 15, 479
- Schekochihin et al. (2002) Schekochihin, A., Cowley, S., Maron, J., & Malyshkin, L. 2002, PhRvE, 65, 016305
- Selwood & Balbus (1999) Sellwood, J. A., & Balbus, S. A. 1999, ApJ, 511, 660
- Shishov et al. (2003) Shishov, V. I., Smirnova, T. V., Sieber, W., Malofeev, V. M., Potapov, V. A., Stinebring, D., Kramer, M., Jessner, A., & Wielebinski, R. 2003, A&A, 404, 557
- Simonetti & Cordes (1986) Simonetti, J. H., & Cordes, J. M. 1986, ApJ, 310, 160
- Smirnova & Shishov (2002) Smirnova, T. V., & Shishov, V. I. 2002, Astron. Astrophys. Transac., 21, 45
- Sokoloff et al. (1998) Sokoloff, D. D., Bykov, A. A., Shukurov, A., Berkhuijsen, E. M., Beck, R., & Poezd, A. D. 1998, MNRAS, 299, 189
- Spangler & Gwinn (1990) Spangler, S. R., & Gwinn, C. R. 1990, ApJ, 353L, 29
- Stanimirović et al. (1999) Stanimirović, S., Staveley-Smith, L., Dickey, J. M., Sault, R. J., Snowden, S. L. 1999, MNRAS, 302, 417
- Stil & Taylor (2007) Stil, J. M., & Taylor, A. R., 2007, ApJL, 663, 21
- Stinebring et al. (2000) Stinebring, D. R., Smirnova, T. V., Hankins, T. H., Hovis, J. S., Kaspi, V. M., Kempner, J. C., Myers, E., & Nice, D. J. 2000, ApJ, 539, 300
- Strong et al. (2000) Strong, A. W., Moskalenko, I. V., & Reimer, O. 2000, ApJ, 537, 763
- Sun & Han (2004) Sun, X. H, & Han, J. L. 2004, in The Magnetized Interstellar Medium, ed. B. Uyanıker, W. Reich, R. Wielebinski (Katlenburg-Lindau: Copernicus GmbH), 25
- Taylor et al. (2003) Taylor, A. R., Gibson, S. J., Peracaula, M., Martin, P. G., Landecker, T. L., Brunt, C. M., Dewdney, P. E., Dougherty, S. M., Gray, A. D., Higgs, L. A., Kerton, C. R., Knee, L. B. G., Kothes, R., Purton, C. R., Uyanıker, B., Wallace, B. J., Willis, A. G., & Durand, D. 2003, AJ, 125, 3145
- Tribble (1991) Tribble, P. C. 1991, MNRAS, 250, 726
- Vallée (2004) Vallée, J. P. 2004, NewAR, 48, 763
- Wang et al. (2005) Wang, N., Manchester, R. N., Johnston, S., Rickett, B., Zhang, J., Yusup, A., & Chen, M. 2005, MNRAS, 358, 270
- Westpfahl et al. (1999) Westpfahl, D. J., Coleman, P. H., Alexander, J., & Tongue, T. 1999, AJ, 117, 868
- Wolleben et al. (2006) Wolleben, M., Landecker, T. L., Reich, W., & Wielebinski, R. 2006, A&A, 448, 411
- You et al. (2007) You, X. P., Hobbs, G. B., Coles, W. A., Manchester, R. N., & Han, J. L. 2007, astro-ph/0709.0135