1\Yearpublication\Yearsubmission\Month\Volume\Issue
The Brightness of the Galactic Radio Loops
at 1420 MHz:
Some Indications for the Existence of Loops V and VI
Abstract
In this article we use 1420 MHz data to demonstrate the likely reality of Galactic radio Loops V and VI. We further estimate distances and spectral indices for both these and the four main radio loops. In the cases of Loops I - IV, radio spectral indices are calculated from the mean brightnesses at 1420 and 820/404 MHz. The spectral indices of Loops V and VI are obtained from plots between 1420 and 408 MHz. Using the supernova remnant (SNR) hypothesis for the origin of radio loops, distances are calculated from the surface brightnesses and the angular diameters at 1420 MHz. We also study how results for brightnesses and distances of radio loops agree with current theories of SNR evolution. For this purpose, the ambient density and initial explosion energy of the loops are discussed. We also discuss applications of different relations. The results obtained confirm a non-thermal origin and nearby locations for the Galactic radio loops. Therefore, we have indications that they are very old SNRs that evolve in low ambient densities, with high initial explosion energies.
keywords:
surveys – radio continuum: general – ISM: supernova remnants – radiation mechanisms: non-thermal1 Introduction
It is well known that some spurs seen in the radio continuum background distribution can be associated such as to trace small circles. The set of spurs which form a particular small circle is called a loop. Four major loops had been recognized by the early seventies, these being discovered and studied in the following order: Loop I (Large, Quigley & Haslam 1962; Haslam, Large & Quigley 1964; Large, Quigley & Haslam 1966; Salter 1970), Loop II (Large et al. 1962; Quigley & Haslam 1965; Salter 1970), Loop III (Quigley & Haslam 1965, Salter 1970) and Loop IV (Large et al. 1966; Salter 1970; Reich & Steffen 1981). The most precise determination of parameters for these circles was made by Salter (1970) and published by Berkhuijsen, Haslam & Salter (1971). Salter used the then best data available at 408, 404, 240 and 178 MHz. A detailed review of the subject was published by Salter (1983). It was noticed by Milogradov-Turin (1970, 1972, 1982) and Milogradov-Turin & Urošević (1997) that some other spurs could be connected into loops. They proposed Loop V, formed by negative latitude spurs in Taurus, Pisces and Pegasus, and Loop VI, corresponding to weak positive latitude spurs in Leo and Cancer. Loop V has well defined "end" spurs and weak "bridges" between them, while Loop VI is practically equivalent to the high brightness temperature region between cold holes near the North Galactic Pole. They further computed parameters for the proposed loops using the survey at 38 MHz by Milogradov-Turin & Smith (1973).
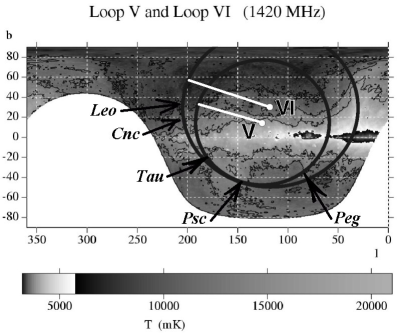
The radio surveys at 1420 MHz (Reich & Reich 1986) and at 408 MHz (Haslam et al. 1982) are used as the basic source of data in the present paper. The northern-sky map of the radio continuum brightness at 1420 MHz (data are taken from Reich & Reich 1986) is presented in Figure 1. The paths of Loops V and VI are marked in order to show the approximate positions and dimensions of these loops. The small circles represent data from Table 1 of Milogradov-Turin & Urošević (1997) which contains approximate parameters for the best-fit circles. Although other theories have been suggested for the origins of the radio loops, (for example, Sofue 1994, 2000 suggested that the radio loops and the diffuse X-ray emission around the Galactic center can be explained by a giant explosion in the Galactic center region), we present results which suggest that radio Loops V and VI may represent supernova remnants (SNRs).
Recent (surface brightness – diameter) relations (Urošević 2002; Arbutina et al. 2004) have been used in this paper to estimate distances for the Galactic radio loops.
2 The Data
The survey at 1420 MHz (Reich & Reich 1986) provided a basis for the recomputing of small circles for the major loops and Loops V and VI. The observational data were obtained with the Stockert 25 m telescope. The effective sensitivity is about 50 mK in Tb (where Tb is for an average brightness temperature), and the angular resolution is 35′. The survey at 408 MHz (Haslam et al. 1982) is an all-sky survey obtained by combining surveys from four telescopes, the Jodrell Bank Marks 1 and 1A, Effelsberg and Parkes, with effective sensitivity of about 1.0 K in Tb and an angular resolution of 51′. These data are available from the MPIfR Survey Sampler ("Max-Planck-Institut für Radioastronomie", Bonn), which is available on-line at: http:// www.mpifr-bonn.mpg.de/survey.html and allows users to pick a region of the sky and obtain images at a number of wavelengths.
3 Analysis
One way of understanding SNR evolution is by studying the relation between the surface brightnesses and diameters of SNRs, the so-called relation. Shklovskii (1960) developed the first theoretical relation, which is assumed to be of the form:
| (1) |
where is the diameter of the object, and is a coefficient which does not depend on , but does depend on the initial energy that the supernova provided to the remnant and on the density of unperturbed matter through which the remnant is expanding. is a function of , the flux density spectral index .
The first empirical relation was derived by Milne (1970), while Berkhuijsen (1973) was the first person to include the Origem Loop and Loop I in the relation. All the main radio loops (Loops I, II, III and IV) were included in the study of the relation of SNR at known distances by Berkhuijsen (1986).
Brightness temperatures over the areas of the loops, as required for our plots, were obtained from the continuum survey data of Reich & Reich (1986; at 1420 MHz) and Haslam et al. (1982; at 408 MHz). Each loop area was divided into different sections (corresponding to spurs) and estimates for these sections were combined. The areas used for the individual loops were not defined with respect to their best-fit circles, but were obtained from the radio continuum maps. Assuming that Loops I-VI are old SNRs, probably in their isothermal (radiative) phase, only the data from the relevant spurs of the loops were used for deriving brightness temperatures. The surface brightnesses of the SNRs must be above the sensitivity limit of the observations and must be clearly distinguishable from the Galactic background emission (Green 1991). Therefore, the data from the fainter parts of the loop (which have very low surface brightness) are not taken into account because it is very difficult to resolve them from the background. On the other hand, this would significantly reduce the brightnesses of entire loops and there is a general trend that fainter SNRs tend to be larger (Green 2005). Consequently, the relations that were applied could give overestimated values for the diameters. For the estimation of brightness temperatures over the spurs we had to take into account background radiation (Webster 1974). Borders enclosing the spurs are defined such as to clearly delineate a spur and its background. For the method of calculation see Borka (2007).
The loops are believed to be SNRs whose material is expanding inside of bubbles of low density, created either by earlier SNR explosions or by strong stellar winds (Salter 1983; McKee & Ostriker 1977 and references therein).
The locations of the Galactic radio loops (and their spurs) in the sky, and the values of their average brightness temperatures and surface brightnesses, can be found in Borka (2007; Tables 1 and 2 therein).
The temperatures at 1 GHz were calculated using the temperatures at 1420 MHz given by Borka (2007) and the spectral indices of Berkhuijsen (1973) for Loops I-IV, plus those calculated here for Loops V and VI. We calculated the surface brightness by applying the following relations:
| (2) |
| (3) |
where is the temperature spectral index.
In order to determine distances for the Galactic radio loops I-VI, we applied the surface brightnesses from Borka (2007) to the recent relations of Urošević (2002) and Arbutina et al. (2004). In addition, the values of the spectral indices of the main Galactic Loops I-IV were obtained directly from spectra of temperature versus frequency. To produce these spectra, with the 1420 MHz data from Borka (2007) (map of Reich & Reich 1986) we used data from Berkhuijsen (1973) at 820 MHz for Loops I-III, and at 404 MHz for Loop IV. The survey at 820 MHz is by Berkhuijsen (1972) and that at 404 MHz by Seeger et al. (1965). The method was used for the determination of spectral indices of Loops V and VI.
Diameters were calculated using the relations (Urošević 2002; Arbutina et al. 2004):
| (4) |
| (5) |
( in W m-2 Hz-1 Sr-1 and in pc) and from these the distances to the centers of the shells were calculated using the relation:
| (6) |
with angular radii ( taken from Milogradov-Turin & Urošević (1997). In Urošević (2002) the Galactic loops are added to the set of 157 calibrators, and relation (4) was derived. In Arbutina et al. (2004) a good relation (5) was derived for the M82 starburst galaxy and they suggest that a similar relation might exist for Galactic SNRs associated with giant molecular clouds.
In addition, we have the relation:
| (7) |
where is the spectral index and is a constant. Knowing the values of brightness temperature at two frequencies, we were able to calculate spectral indices.
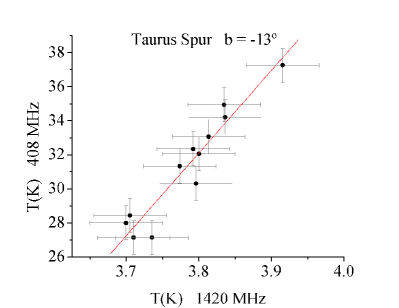
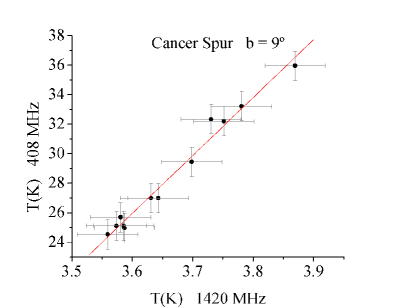
For Loops V and VI, spectral indices were calculated using plots. These were made between temperatures at 1420 MHz (Reich & Reich 1986) and 408 MHz (Haslam et al. 1982).
By the relation:
| (8) |
we can determine the temperature spectral index, , from the slope of straight-line fitted to a plot. Using the above relations, diameters and distances were calculated for Loops V and VI.
| Loop | derived from (4) | derived from (5) | ||
|---|---|---|---|---|
| (pc) | (pc) | (pc) | (pc) | |
| I | 169 38 | 99 25 | 119 17 | 70 12 |
| II | 187 42 | 129 33 | 127 18 | 88 16 |
| III | 167 37 | 150 42 | 118 17 | 106 21 |
| IV | 310 69 | 462 103 | 172 24 | 257 50 |
| Loop | |
|---|---|
| I | 2.69 0.05 |
| II | 2.91 0.05 |
| III | 2.59 0.04 |
| IV | 2.65 0.09 |
| Loop | derived from (4) | derived from (5) | ||
|---|---|---|---|---|
| (pc) | (pc) | (pc) | (pc) | |
| V | 235 36 | 124 22 | 146 22 | 77 14 |
| VI | 255 39 | 134 23 | 153 23 | 80 14 |
| Loop | Spur | ||
|---|---|---|---|
| V | Taurus | 2.89 0.10 | |
| Pisces | 2.63 0.12 | ||
| Pegasus | 3.12 0.09 | ||
| VI | Leo | 2.91 0.13 | |
| Cancer | 2.71 0.12 |
4 Results
The results for the four main loops are presented in Tables 1 and 2. The diameters and distances to the radio loops derived from the relations given by Urošević (2002) and Arbutina et al. (2004) are shown in Table 1. The spectral indices for the four main radio loops, calculated as described above, are shown in Table 2. Spectra were generated using mean temperatures at two different frequencies as needed for making the simplest linear fits. The two frequencies are 820 and 1420 MHz for Loops I-III, and 404 and 1420 MHz for Loop IV. All earlier determinations of the radio loop spectral indices, except for this paper and Borka (2007), were based on methods. Besides, the values obtained (all greater than 2.2) confirm a non-thermal origin for the emission from the radio loops. The values for the brightness temperature spectral indices of the loops are rather steep (about ). This is at the high end of the spectral index distribution for SNRs (Clark & Caswell 1976).
The diameters of, and distances to, Loops V and VI derived using the relations given by Urošević (2002) and Arbutina et al. (2004) are presented in Table 3. Representative plots between 1420 and 408 MHz are given in Figures 2 and 3, with one plot for each loop. Using similar plots, we determined spectral indices for all spurs which create Loops V and VI. The spectral indices of Loops V and VI are shown in Table 4. The values of spectral index derived from plots for these two loops are obtained independently of the values for the indices derived from the mean brightness temperatures in Borka (2007).
We note that the values of the spectral indices in Tables 2 and 4 are slightly different to those derived by Borka (2007). However, the results agree within the absolute error limits.
5 Discussion
We will assume below that all the radio loops discussed here are
SNRs (Berkhuijsen, Haslam & Salter 1970; Berkhuijsen 1971;
Shklovskii & Sheffer 1971; Salter 1983). The geometries of Loops V
and VI are presented in Figure 1. It is seen that Loop V
is projected entirely within Loop VI indicating a possible close
connection between these loops. Here, we will consider three
possibilities for such a connection:
(i) Milogradov-Turin & Urošević (1997) considered the
possibility that all the spurs of Loops V and VI define a unique
small circle corresponding to a single feature – Loop V+VI.
However, their geometric fit did not provide reliable evidence for
this hypothesis.
(ii) a second possibility is that Loop V represents a "wrinkle" on
the shell of Loop VI, tracing part of a small circle on that shell.
If so, this small circle is oriented such that at one point (i.e. , ) it meets the (different) small
circle representing the locus of tangential points from the Sun to
the Loop VI shell. Borka (2007) performed the first spectral
investigation of Loops V and VI using the mean brightness
temperatures at three frequencies (1420, 820 and 408 MHz) to form
the linear spectra for these loops. As shown in Table 1 of Borka
(2007), spurs of these loops belong to different and not overlapping
temperature intervals at all three frequencies. This suggests that
these spurs form two independent features, namely Loops V and VI.
(iii) a similar situation to that detailed in (i) and (ii) but
concerning Loops I and IV, was considered earlier by a number of
authors (Large et al. 1962; Davies 1964; Guidice 1971). However,
Borken and Iwan (1977) and Iwan (1980) proposed that the Loop I SNR
is very old, well into its radiative phase, and is being reheated by
the intersecting shock of Loop IV. They concluded that Loop IV has a
low density shell, is not yet in the radiative cooling phase, and
has not lost much energy before reheating the Loop I cavity. By
analogy, and given the similar distances and diameters derived for
these two loops (Table 3), we assume that the Loop V SNR
exploded within the previous (low density) cavity left by the Loop
VI SNR. In view of the similarity of the paths of the Loops V and
VI, one possible scenario is suggested by the recent paper by
Wolleben (2007). This author proposes that the emission of two
independent synchrotron-emitting shells make up the feature known as
Loop I (the North Polar Spur). While the presence of more than one
supernova remnant has been invoked previously to explain some of the
features of Loop I, (and especially its strong X-ray emission),
Wolleben’s model invokes the presence of a second, very old remnant
to explain certain features he finds in the large-scale distribution
of polarized continuum intensity.
We have used recent relations to determine the distances of the various loops. Our results demonstrate that the distances from Arbutina et al. (2004) do not agree with those derived independently by Berkhuijsen (1986). This is probably because relation (5) is not applicable to the Loops, as these are thought to be situated in a low density environment. An analysis as to how the relation depends on the density of the interstellar medium is given in Arbutina & Urošević (2005). Therefore, we conclude that the radio loops are evolving in a low density environment. However, we emphasize once again our assumption of the SNR explanation for the radio loops. The distances and diameters obtained using the relation of Urošević (2002) show good agreement when compared with those in Borka (2007), which were calculated from the relation derived by Case & Bhattacharya (1998). However, the relation of Urošević is preferred to that of Case & Bhattacharya because it adds the Galactic loops to the set of 157 calibrators. Also, the relation of Case & Bhattacharya shows better agreement with the diameters of SNRs at known distances (Berkhuijsen 1986) than does that of Arbutina et al. (2004).
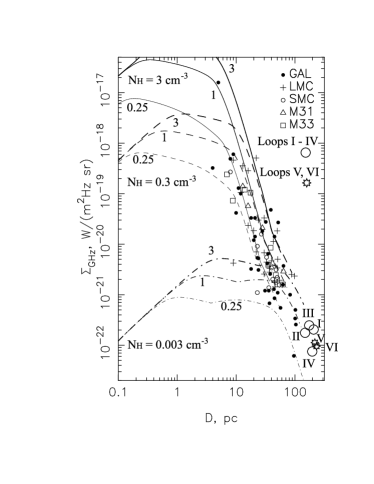
Adopting diameters for the main loops from Berkhuijsen (1986) and the diameters for Loops V and VI as estimated in this paper from relation (4), we can use the diagram of Berezhko & Völk (2004) to determine the initial explosion energy that would correspond to these loops, plus the density of the ambient interstellar medium in their neighborhood. The diagram at 1 GHz taken from Berezhko & Völk (2004) with the derived values for the six loops superposed, is shown in Figure 4. We identify Loops I-IV by circles and Loops V and VI by stars. For Loops V and VI, this is a preliminary illustration. For additional evidence of their SNR origin it would be necessary to calculate distances (diameters) independently of the relation. Then, from this diagram, it would be possible to investigate the compatibility of the properties of Loops V and VI with their being old SNRs. From Figure 4, it can be concluded that the surrounding density of the radio loops is low and that the explosion energy is high. Further, the locations of the Loops on this diagram agree with the general distribution and this strengthens the idea that they are old SNRs.
The main unsolved problems for the SNR hypothesis of the radio loops are: (i) the high X-ray flux from the interior of Loop I, and (ii) the high degree of spherical symmetry of all the loops. Both issues are related to the evolutionary status of radio loops. If the loops are SNRs, they are old and dimensionally immense (see Tables 1 and 3). High X-ray emission and spherical symmetry are not expected from such SNRs.
The X-ray contours follow the North Polar Spur (NPS), but they are located in the interior region of Loop I (Sofue 2000). We believe that Loop I was in a late adiabatic phase, not so long ago, and in that phase X-rays could be generated. At present, the NPS is probably in an early radiative phase of expansion in which a thick low temperature shell is generated (Chevalier 1974). The X-ray gas is thermodynamically stable (the hot phase of the ISM) and can exist for a million years, implying that X-rays can be observed from the interior of Loop I. In a thicker uniform medium, a slow shock can conserve its own approximately spherical form, but only for a very short time interval. Due to the formation of a thick shell during expansion in the radiative phase (Cox & Reynolds 1987), the velocity of the shock wave rapidly declines and the shell loses its own identity. Generally, the radiative phase of evolution is short in comparison to the adiabatic phase (e.g. McKee & Ostriker 1977).
If a SNR is expanding in a hot bubble made by strong winds or earlier supernova explosions, it has a chance to conserve an approximately spherical form because of the uniformly distributed matter formed by the evaporation of denser clouds (McKee & Ostriker 1977). Hanayama & Tomisaka (2006) concluded that a spherically symmetric shape can be conserved if an old SNR evolves in an environment with a weak magnetic field. In this case, the evolution is similar to that of a non-magnetized SNR. In the pressure-driven expansion stage, a SNR evolving in a medium with a magnetic field of 1 G keeps its spherically symmetric shape (Hanayama & Tomisaka 2006).
The above discussion suggests that the radio loops may have a SNR origin, but a definite answer needs much additional work.
6 Summary
The main results of this paper may be summarized as follows:
(i) We have estimated the distances of the main Galactic radio loops
and Loops V and VI from the northern-sky radio continuum survey at
1420 MHz (Reich & Reich 1986) using two different
relations.
(ii) The estimated distances of the main radio loops derived using
the 1420 MHz data are in good agreement with the earlier results
(e.g. Berkhuijsen 1986).
(iii) From the spectral index analysis we can confirm that the
emission from the radio loops is non-thermal in origin.
(iv) We have demonstrated the probable existence of Loops V and VI.
The distances and spectral indices of Loop V and Loop VI are
estimated. In general, they display shell structure and have
non-thermal spectra, similar to the main loops I-IV which are
usually assumed to be SNRs.
Acknowledgements.
The authors are grateful to the referee for very useful remarks and suggestions which helped us improve the paper.References
- [Arbutina et al. 2004] Arbutina, B., Urošević, D., Stanković, M., Tešić, Lj.:2004, MNRAS 350, 346
- [Arbutina & Urošević 2005] Arbutina, B., Urošević, D.: 2005, MNRAS 360, 76
- [Berezhko & Völk 2004] Berezhko, E. G., Völk, H. J.: 2004, A&A 427, 525
- [Berkhuijsen 1971] Berkhuijsen, E. M.: 1971, A&A 14, 359
- [Berkhuijsen 1972] Berkhuijsen, E. M.: 1972, A&AS 5, 263
- [Berkhuijsen 1973] Berkhuijsen, E. M.: 1973, A&A 24, 143
- [Berkhuijsen 1986] Berkhuijsen, E. M.: 1986, A&A 166, 257
- [Berkhuijsen, Haslam & Salter 1970] Berkhuijsen, E. M., Haslam, C. G. T., Salter, C. J.: 1970, Nature 225, 364
- [Berkhuijsen, Haslam & Salter 1971] Berkhuijsen, E. M., Haslam, C. G. T., Salter, C. J.: 1971, A&A 14, 252
- [Borka 2007] Borka, V.: 2007, MNRAS 376, 634
- [Borken & Iwan 1977] Borken, R. J., Iwan, D. C.: 1977, ApJ 218, 511
- [Case & Bhattacharya 1998] Case, G. L., Bhattacharya, D.: 1998, ApJ 504, 761
- [Chevalier 1974] Chevalier, R. A.: 1974, ApJ 188, 501
- [Clark & Caswell 1976] Clark, D. H., Caswell, J. L.: 1976, MNRAS 174, 267
- [Cox & Reynolds 1987] Cox, D. P., Reynolds, R. J.: 1987, ARA&A 25, 303
- [Davies 1964] Davies, R. D.: 1964, MNRAS 128, 173
- [Green 1991] Green, D. A.: 1991, PASP 103, 209
- [Green 2005] Green, D. A.: 2005, MemSAI 76, 534
- [Guidice 1971] Guidice, D. A.: 1971, AFCRL 71-0170, Enviromental Research Paper 349
- [Hanayama & Tomisaka 2006] Hanayama H., Tomisaka, K.: 2006, ApJ 643, 905
- [Haslam, Large & Quigley 1964] Haslam, C. G. T., Large, M. I., Quigley, M. J. S.: 1964, MNRAS 127, 273
- [Haslam et al. 1982] Haslam, C. G. T., Salter, C. J., Stoffel, H., Wilson, W. E.: 1982, A&AS 47, 1
- [Iwan 1980] Iwan, D. C.: 1980, ApJ 239, 316
- [Large, Quigley & Haslam 1962] Large, M. J., Quigley, M. J. S., Haslam, C. G. T.: 1962, MNRAS 124, 405
- [Large, Quigley & Haslam 1966] Large, M. I., Quigley, M. J. S., Haslam, C. G. T.: 1966, MNRAS 131, 335
- [McKee & Ostriker 1977] McKee, C. F., Ostriker, J. P.: 1977, ApJ 218, 148
- [Milne 1970] Milne, D. K.: 1970, Australian J. Phys. 23, 425
- [Milogradov-Turin 1970] Milogradov-Turin, J.: 1970, Publ. Dept. Astron. Univ. Belgrade 2, 5
- [Milogradov-Turin 1972] Milogradov-Turin, J.: 1972, M. Sc. Thesis, Univ. of Manchester
- [Milogradov-Turin 1982] Milogradov-Turin, J.: 1982, Ph. D. Thesis, Univ. of Belgrade
- [Milogradov-Turin & Smith 1973] Milogradov-Turin, J., Smith, F. G.: 1973, MNRAS 161, 269
- [Milogradov-Turin & Urošević 1997] Milogradov-Turin, J., Urošević D.: 1997, BA Belgrade 155, 41
- [Quigley & Haslam 1965] Quigley, M. J. S., Haslam, C. G. T.: 1965, Nature 208, 741
- [Reich & Steffen 1981] Reich, W., Steffen, P.: 1981, A&A 93, 27
- [Reich & Reich 1986] Reich, P., Reich, W.: 1986, A&AS 63, 205
- [Salter 1970] Salter, C. J.: 1970, Ph. D. Thesis, Univ. of Manchester
- [Salter 1983] Salter, C. J.: 1983, BASI 11, 1
- [Seeger et al. 1965] Seeger, C. L., Westerhout, G., Conway, R. G., Hoekema, T.: 1965, BAN 18, 11
- [Shklovskii 1960] Shklovskii, I. S.: 1960, Soviet Astronomy - AJ 4, 243
- [Shklovskii & Sheffer 1971] Shklovskii, I. S, Sheffer, E. K.: 1971, Nature 231, 173
- [Sofue 1994] Sofue, Y.: 1994, ApJ 431, L91
- [Sofue 2000] Sofue, Y.: 2000, ApJ 540, 224
- [Urošević 2002] Urošević, D.: 2002, Serb. Astron. J. 165, 27
- [Webster 1974] Webster, A. S.: 1974, MNRAS 166, 355
- [Wolleben 2007] Wolleben, M.: 2007, ApJ 664, 349