Numerical simulations of
type III planetary migration:
III. Outward migration of massive planets
Abstract
We present a numerical study of rapid, so called type III migration for Jupiter-sized planets embedded in a protoplanetary disc. We limit ourselves to the case of outward migration, and study in detail its evolution and physics, concentrating on the structure of the co-rotation and circumplanetary regions, and processes for stopping migration. We also consider the dependence of the migration behaviour on several key parameters. We perform this study using global, two-dimensional hydrodynamical simulations with adaptive mesh refinement. We find that the outward directed type III migration can be started if the initial conditions support , that corresponds to initial value . Unlike the inward directed migration, in the outward migration the migration rate increases due to the growing of the volume of the co-orbital region. We find the migration to be strongly dependent on the rate of the mass accumulation in the circumplanetary disc, leading to two possible regimes of migration, fast and slow. The structure of the co-orbital region and the stopping mechanism differ between these two regimes.
keywords:
accretion, accretion discs – hydrodynamics – methods: numerical – planets and satellites: formation1 Introduction
The discovery of extra-solar planetary systems (Mayor & Queloz 1995, Marcy et al. 2000, Vogt et al. 2002) has invoked a strong interest in the theories of planetary system formation. The occurrence of so-called ‘hot Jupiters’ (objects with minimum masses and semi-major axes AU) has shown that planets can be found on orbits very different from the formation sites of planetary cores. Since the in situ formation of these objects is difficult both in the core accretion scenario (Pollack et al., 1996) and through direct gravitational instability (Boss, 2001), the global migration of planetary cores has become the subject of a large number of studies. The inward migration of the planets due to planet-disc gravitational interaction was first described by Goldreich & Tremaine (1979, 1980), prior to the discovery of extra-solar planetary systems. Later on it was worked out in a large number of investigations summarised in the reviews by Lin & Papaloizou (1993), Lin et al. (2000) and Papaloizou et al. (2007).
In the standard picture the planet exchanges angular momentum with the disc through the excitation of spiral density waves at the Lindblad resonances and through the interaction at the corotation resonance. However until recently, the second mechanism was assumed to be inefficient and was therefore neglected. The non-axisymmetric pattern of the waves excited at Lindblad resonances acts back the planet providing the torque driving its orbital migration. This leads to two possible regimes of the migration: type I for planets embedded in the disc and type II for planets opening the gap. In both cases the direction of migration usually is inward. Note that type II is however capable of moving the planet outward provided the disk has local density gradients supporting outward viscous spreading (Lin & Papaloizou, 1993; Ward, 2003; Crida & Morbidelli, 2007).
Recently the corotation resonance have been found to be important and capable of slowing down and even reverting the direction of migration in type I regime (Masset et al. 2006, Paardekooper & Mellema 2006). However, it can also lead to a new and very fast migration mode (called type III) that is not truly resonant, but depends strongly on the gas flow in the planet vicinity and does not have a predetermined direction (Masset & Papaloizou 2003; Artymowicz 2004, Papaloizou et al. 2007). This type of migration was studied numerically by Masset & Papaloizou (2003) who performed global two-dimensional simulations of an inward and outward directed migration. The inward directed migration was studied by D’Angelo et al. (2005). Papaloizou (2005) considered local shearing box simulations in 2-D, and Artymowicz & de Val Borro (2008) in 3-D.
This paper is the third in a series devoted to a numerical investigation of type III migration for the high-mass planets. In Peplinski et al. (2008a) (henceforth Paper I) we showed how the applied disc model critically influences the outcome of the simulations. We found two physically motivated corrections to the standard disc model, both necessary to remove non-physical effects from the simulations. The first one is a correction of the gas acceleration (due to self-gravity) which ensures that the circumplanetary disc moves together with the planet. The second is a modification of local-isothermal approximation, which allows an increase of the temperature inside the planet’s Roche sphere and thus decreases the amount of gas accumulated in the planet’s vicinity. Paper I contains the detailed description of the disc model, the code and the convergence tests.
This method was applied to the study of inward directed type III migration in Peplinski et al. (2008b) (henceforth Paper II). There we focussed on the physical aspects of type III migration and described in detail the mechanisms driving rapid migration. We also discussed the mechanisms for stopping type III migration (or rather transforming it to the very much slower type II regime).
In the present paper we focus on outward directed type III migration. Although the driving mechanism is the same for both the inward and outward directed migration, the existence of the differential Lindblad torque breaks the symmetry between both cases as shown in Artymowicz & Peplinski (2008). The analytical theory in Artymowicz & Peplinski (2008) also shows that unlike inward migration, outward migration only is allowed for a co-orbital mass deficit larger than one. Paper II showed that inward migration will always slow down due to the shrinking of the size of the co-orbital region. For outward migration one would expect the reverse, i.e. a speed up of migration, allowing the planet to travel long distances in the disc.
The layout of the paper is as follows. Section 2 gives the numerical setup of the disc model. In Sections 3 and 4 we describe the results of simulations of outward migrating protoplanets and the dependency of the migration on the various parameters. In Sections 5 and 6 we analyse the stopping of type III migration and eccentricity evolution. Finally in Section 7 we discuss their implications for extrasolar planetary configurations.
2 Overview of the numerical setup
The full description of the adopted disc model, the numerical method and the boundary conditions was given in Paper I. In this chapter we will give only a short description of the adopted units and initial conditions.
For our simulations we use the Flash hydro code version 2.3 written by the FLASH Code Group from the Centre for Astrophysical Thermonuclear Flashes at the University of Chicago111http://www.flash.uchicago.edu in 1997. Flash is a modular, adaptive-mesh, parallel simulation code capable of handling general compressible flow problems. It is designed to allow users to configure initial and boundary conditions, change algorithms, and add new physics modules. We use the code in the pure hydrodynamical mode in two dimensions, and the adaptive mesh is used to achieve high resolution around the planet (4 levels of refinement). The simulations are performed on the Cartesian grid in the inertial reference frame.
In the simulations we adopt non-dimensional units, where the sum of star and planet mass represents the unit of mass. The time unit and the length unit are chosen to make the gravitational constant . This makes the orbital period of Keplerian rotation at a radius around a unit mass body equal to . However, when it is necessary to convert quantities into physical units, we use a Solar-mass protostar , a Jupiter-mass protoplanet , and a length unit of . This makes the time unit equal to years.
In all simulations the grid extends from to in both directions around the star and planet mass centre. This corresponds to a disc region with a physical size of AU.
The initial surface density profile is given by a modified power law:
| (1) |
where is the distance to the mass centre of the planet-star system, is a unit distance, and is a function that allows introducing a sharp edges in the disc. To start the outward directed migration we introduce a density jump at the initial planet position (see Paper I Fig. 2). The disc mass is characterised by the disc to the primary mass ratio
| (2) |
We investigate different density profiles by changing from to , and from to . For the Minimum Mass Solar Nebula (MMSN) and .
To enforce rapid migration the planet is introduced instantaneously on a circular orbit of semi-major axis equal . We performed the simulations with equal , (i.e. one Jupiter mass, , for a one-solar-mass star) and .
The aspect ratio for the disc with respect to the star is fixed at , whereas the circumplanetary disc aspect ratio can range form to .
The smoothing length of the stellar potential, , is taken to be . For the planet this parameter was chosen be a fraction of the planet’s Hill radius , and was set to . The corresponding size of the envelope was set to .
Flash has the ability to track multiple fluids. We use this feature to investigate the evolution of the fluid in corotation region. In our simulations we introduce a tracer fluid that has a value of 1 in the (initial) corotation region , and zero outside it. This allows us to distinguish between the fluid captured by the planet in the horseshoe region and the fluid flowing through the corotation region.
3 Outward migration - standard cases
Although the driving mechanism for inward and outward type III migration is similar, we find that the initial conditions for each have to differ significantly. As found in Paper II, a relatively low mass disc (about twice the MMSN) is sufficient to start the inward migration of a Jupiter mass planet with an initial semi-major axis . To start outward migration for such a planet initially placed at , we need a three times more massive disc (with a sharp inner edge). Another difference is that for outward migration the planet accumulates a much larger amount of gas as it moves through the disk. This rapid increase of the effective planet mass significantly modifies the planet’s orbital evolution. However, the evolution of depends strongly on the chosen parameters such as , the scale height of the circumplanetary disc. Thicker (warmer) circumplanetary discs accumulate less material, and thus results in a different orbital evolution. They also represent two different mechanisms of stopping type III migration.
To be able to compare the cases of high and low mass accumulation, we will here keep constant at 0.4, but instead in one case allow the effective planet mass to grow, by adding the mass content within the smoothing length (, model M1) and in the other keep the effective planet mass constant at the initial value (, model M2). For both models the initial surface density profile has and , with an inner edge placed at . At this edge the surface density drops by a factor of (see Paper I, Fig 2).
Note that these models were used in Paper I, Sect. 5.2.2 in the discussion of the dependency of the planet’s orbital evolution on the mass accumulation in the circumplanetary disc. Here we discuss them in more detail.222Notice the difference between Fig. 14 in Paper I and Fig. 2 in the present paper. All plots in Paper I and most of the ones in this paper present data averaged over 5 orbital periods, however in the case of model M2 the torque and the migration rate oscillate strongly in time and we instead averaged over 10 orbits.
3.1 Orbital evolution
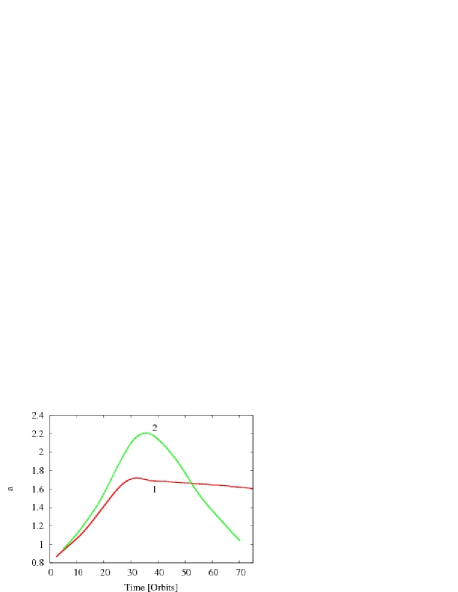
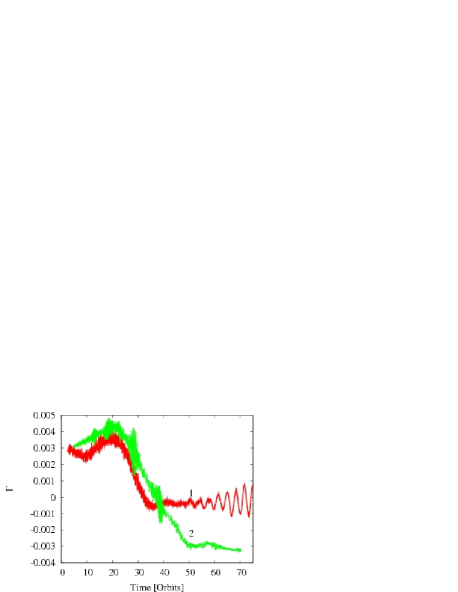
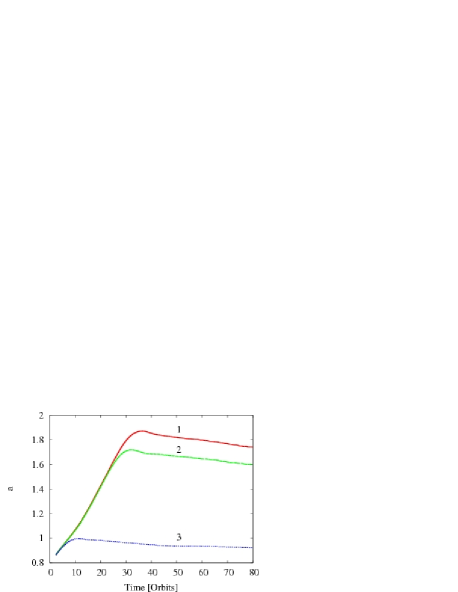
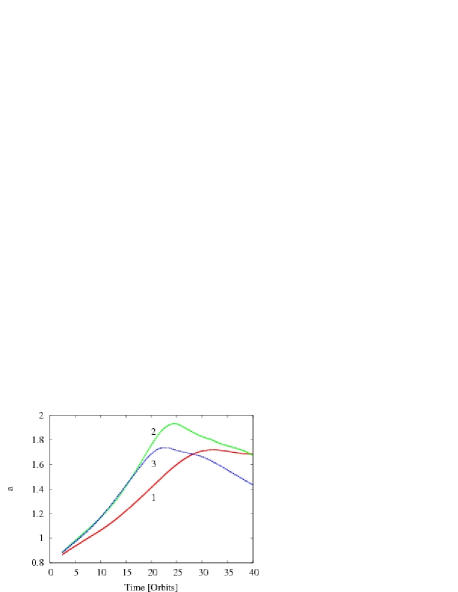
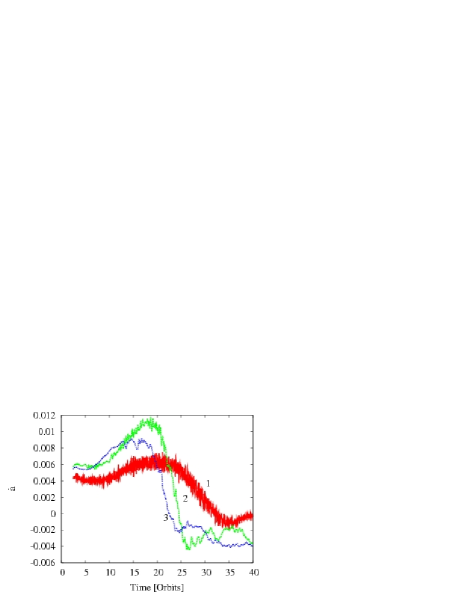
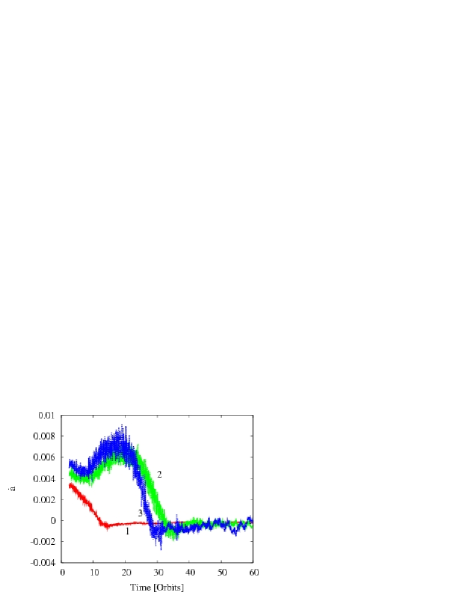
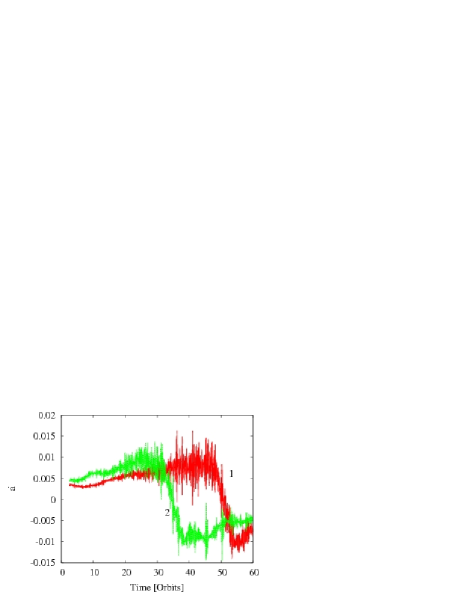
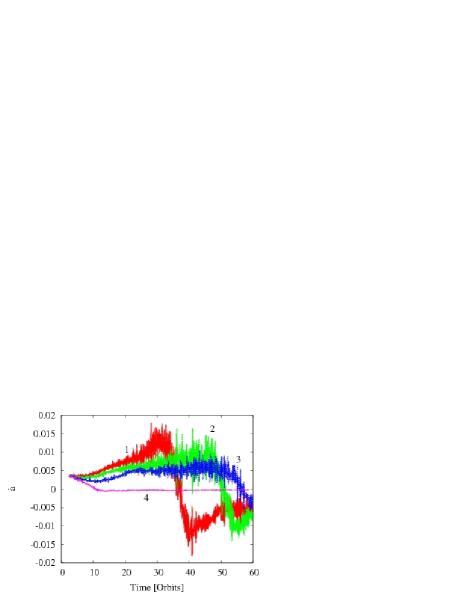
Figure 1 shows the evolution of several key quantities for models M1 and M2 (curve 1 and 2 respectively). The upper left panel displays the evolution of the planet’s semi-major axis. Both models show two phases of migration. The first phase is one of rapid, outward directed migration, lasting for about and orbits in M1 and M2 respectively. It is followed by a phase of inward migration, which is slower for M1 than for M2. In M1 the effective planet mass grows rapidly during the first phase of migration, and the planet, after reaching , becomes locked in the disc in a type II like migration. In M2 this growth is artificially inhibited, and the planet migrates further, reaching a maximum semi-major axis at . At this position the planet starts an inward-directed rapid migration phase.
In our investigation we concentrate on the first, rapid outward directed migration phase and on the reversal of the migration direction. We will not describe in detail the second, inward migration phase, which corresponds to the transition between type III and type II migration regime in M1, and to the rapid inward migration in M2.
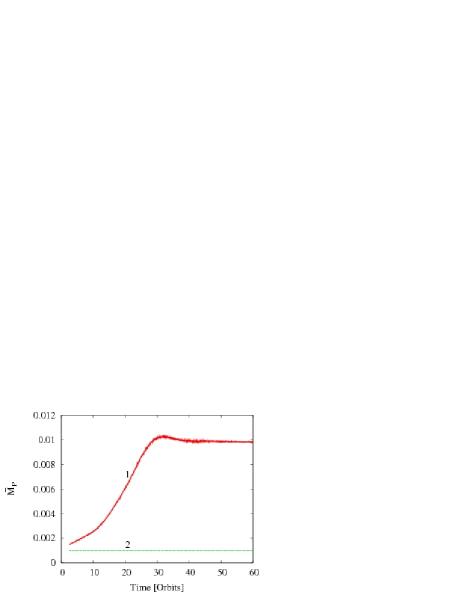
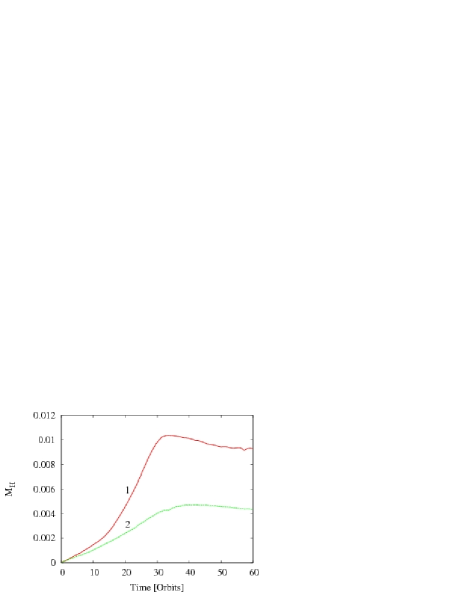
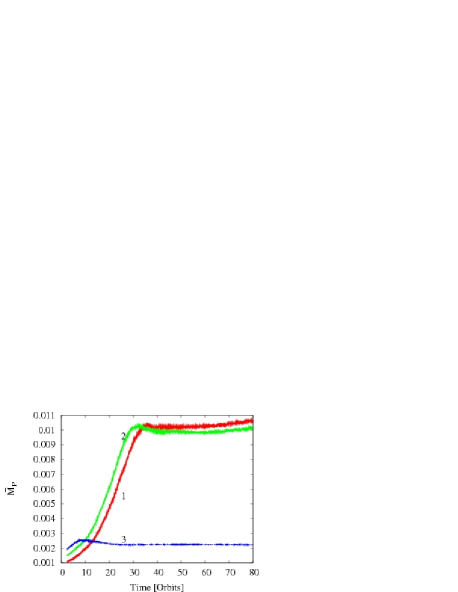
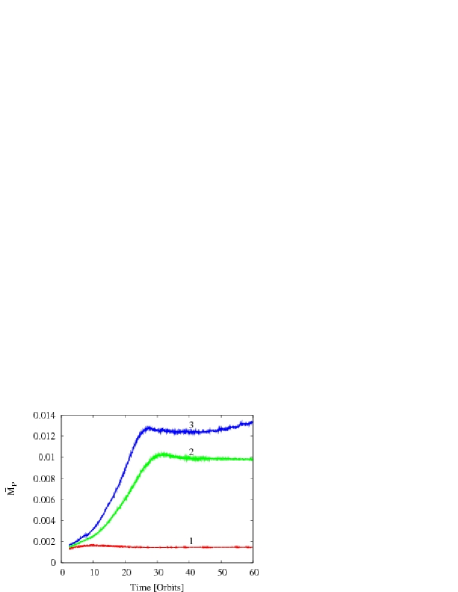
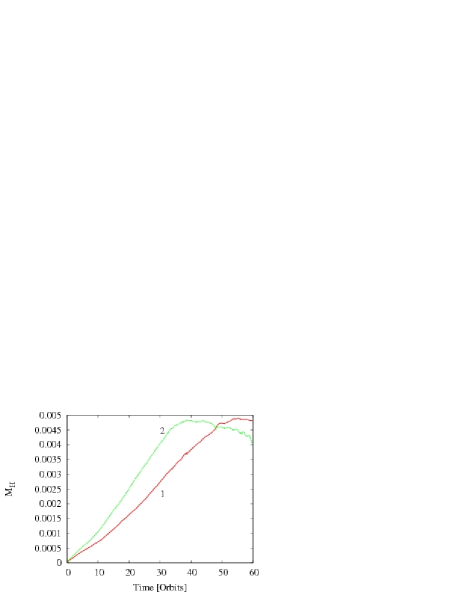
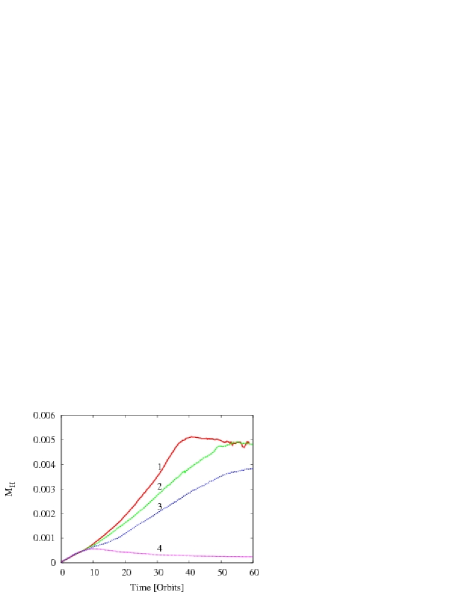
The time evolution of the effective planet mass and the mass of the gas inside the Hill sphere are shown in Fig. 2 (see also Paper I, Fig. 14, but notice the change of the labels). In both models the planet accumulates gas during the outward migration phase. In M1 grows faster than in M2, and reaches at orbits. This is a considerable fraction of the original mass of the protoplanetary disc, which contained within . In the slow inward migration phase the planet’s mass is almost constant and . Comparing and we can see that most of the mass is actually accumulated inside the planet’s gravitational smoothing length. In M2 a smaller amount of gas enters the Hill sphere and a maximum of is reached at orbits.
This growth of is possible due to the use of a locally isothermal equation of state with a constant circumplanetary disc aspect ratio . We study the effects of varying below in Sect. 4.2. Note that in M1 there is no mass outflow from the Roche lobe during the slow migration phase, such as was seen in the inward migration case described in Paper II, Sect. 4.3. In this respect, M1 is more similar to the inward migration simulation with a lower (see Paper I, Sect. 5.1.2).
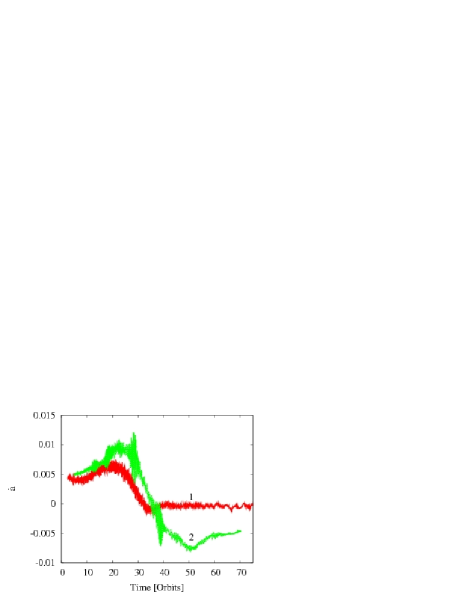
The evolution of the migration rate is presented in middle left panel of Fig. 1. Initially grows with the planet’s semi-major axis for both models and has a maximum at orbits () and orbits () for M1 and M2 respectively. In M1 has a lower value due to the increase of the planet’s inertia. Later drops in a similar way for both models, however in M2 the planet goes through a short period of strong oscillations of the migration rate around orbits. The physical mechanisms behind the drop in migration rates are addressed in Sects. 3.2 and 5.
During the slow inward migration phase of model M1 oscillates around . The oscillations are slightly more visible after about orbits after the planet’s eccentricity has increased. As we saw before, in M2 the planet enters a rapid inward migration phase.
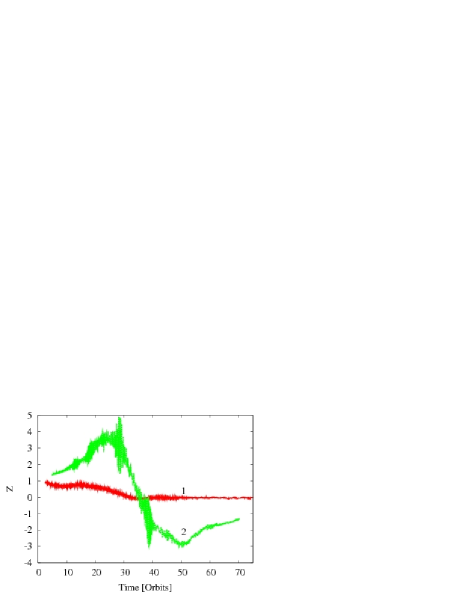
The plot of the non-dimensional migration rate presented in middle right panel helps us understand the difference between the two simulations. As explained in Paper II, the non-dimensional migration rate is defined as a ratio of the planet’s migration rate and the so-called fast migration speed , which is given by the ratio of the half width of the horseshoe region and the libration timescale (Artymowicz & Peplinski, 2008). It is equivalent to , where is the migration time-scale. Using we can divide type III migration into a fast and a slow migration regime. Note that this division is not identical to that between type III and type II migration. Type II like migration corresponds to the phase of nearly constant .
The initial value of is close to for both M1 and M2. However, due to the increase in and the fact that , never exceeds for model M1, and the planet migrates in the slow migration regime during the entire simulation. During the outward migration phase oscillates around , although both and grow during the first orbits. Later decreases reaching its final value in the slow inward migration phase. For M2, during essentially the entire simulation, so in the outward as well as in the inward migration phase the planet migrates in the fast migration regime.
As shown in Paper II and below in Sect. 3.2, the value of correlates with the asymmetry of the co-rotation region, and gap opening occurs for . Model M1 thus experiences gap opening, and a smooth transition to inward migration, whereas model M2 maintains a strong asymmetry in the co-orbital region, without any gap opening.
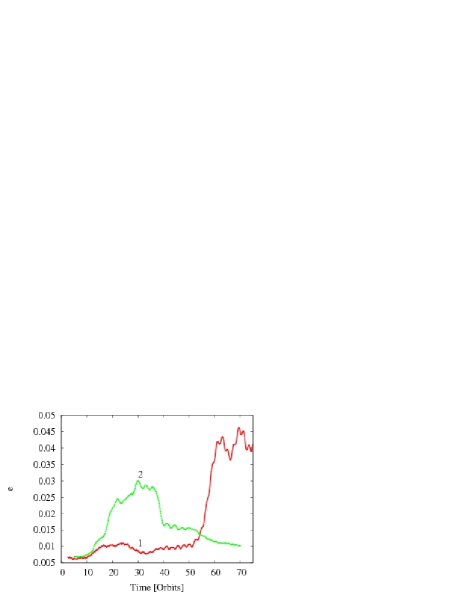
The upper right panel in Fig. 1 shows the changes of the eccentricity . In M1 is approximately constant during the initial outward migration phase and does not exceed 1%. At orbits, the eccentricity starts to rapidly increase. This coincides with an increase of the eccentricity of the outer circumstellar disc (outer with respect to the planet’s orbit). At about orbits the outer disc becomes eccentric (lower left panel in Fig. 5) and the torque starts to oscillate (lower left panel in Fig. 1). Note that the oscillations of are driven by the gas placed outside the Hill sphere. The oscillations of the torque generated by the gas from within the Hill sphere are order of magnitude smaller and start to be visible after about orbits. In the later stages oscillates around . In M2 the eccentricity grows during the outward migration phase reaching and decreases in the inward migration phase.
The lower left panel in Fig. 1 presents the time evolution of the total torque exerted by the gas on the planet. grows during the rapid outward migration phase in both models, however in M1 there is a short ( orbits) period of decreasing torque. The torque has a maximum at about 20 orbits and its value, unlike the maximum value of the migration rate, is similar for both models. Later on decreases rapidly and the planets enter the inward migration phase. There is visible a short period of strong oscillations of at about 28 orbits in M2. As noted above, starts to oscillate in M1 at 48 orbits, when the eccentricity of the outer disc starts to grow. M2 also experiences a short period of torque oscillations around orbits.
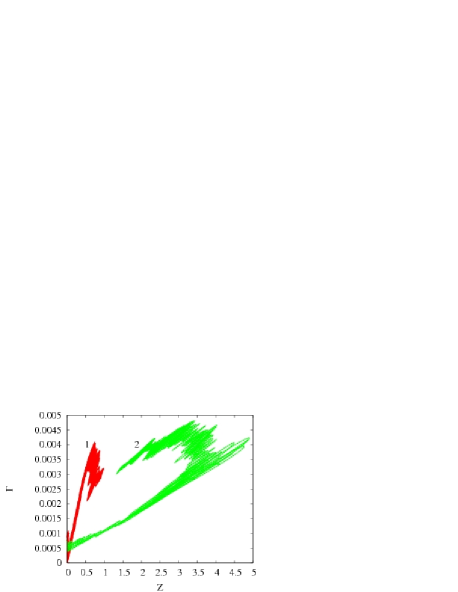
In Paper II Sect. 4.1 we described the relation between the averaged torque and the non-dimensional migration rate for the inward migration case. was shown to grow linearly with in the slow migration regime, and to decrease slowly in the fast migration regime. The trend for the outward directed migration is similar, however there are also some differences. As we saw above, models M1 and M2 show very different values for , and it we can study the relation between and in slow () migration regime by looking at M1, and in the fast () migration regime using M2. We show this relation in the lower right panel in Fig. 1. In the slow migration regime (M1) the torque evolution is strongly influenced by the mass accumulation in the circumplanetary disc and shows two different stages. In the first one (starting at ) grows reaching the maximum at . The second stage with corresponds to a slowing down of migration and agrees with the results for the inward directed migration. Model M2 (always in the fast migration regime) shows two stages too. The first one qualitatively agrees with the results for the inward directed migration with oscillating between and , and being less dependent on . In the second stage the planet reverts rapidly its direction of migration and decays quickly with .


3.2 Flow structure in the co-orbital region
In Paper II we discussed the relation between the time-averaged torque and the asymmetry of the horse shoe region for the inward migration case. We have found the shape of the horseshoe region to be dependent on the relation between the migration time scale and the libration timescale , as expressed by the non-dimensional migration rate . In the slow migration regime the horse shoe region extends almost the entire angle of the co-rotation region, and is fairly symmetric. The co-orbital flow is limited to a small region near to the planet. In the fast migration regime the horseshoe region shrinks to a single tadpole-like region of limited azimuthal extent, disconnecting from the planet on one side and the co-orbital flow takes place over a wide azimuthal range.
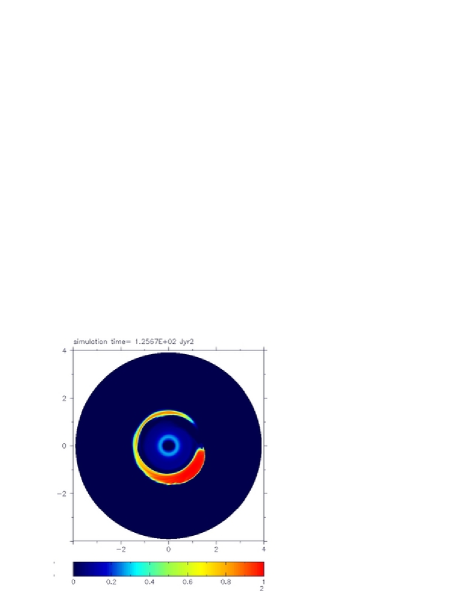
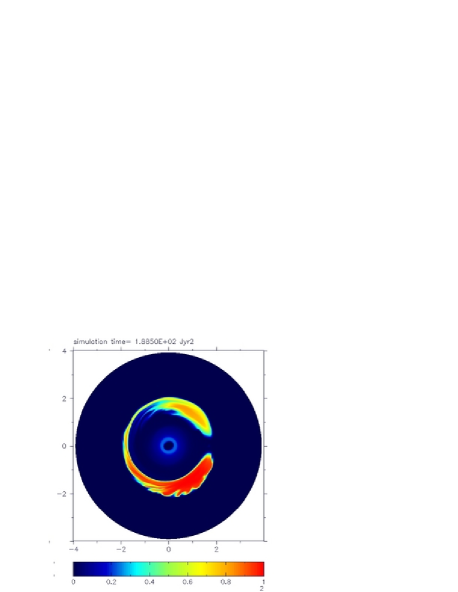
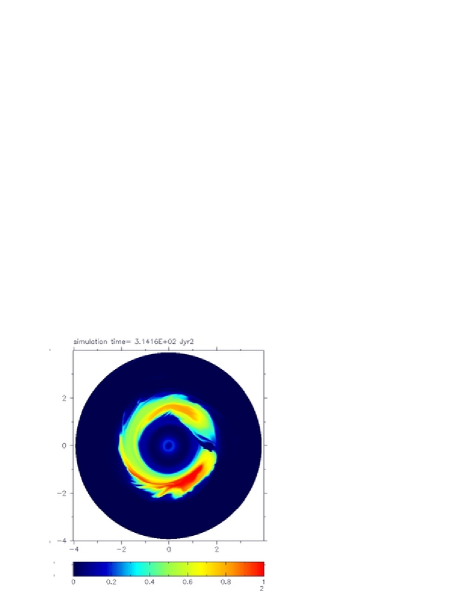
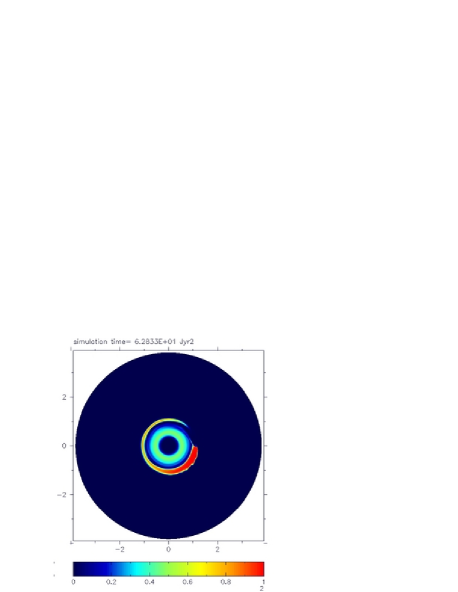
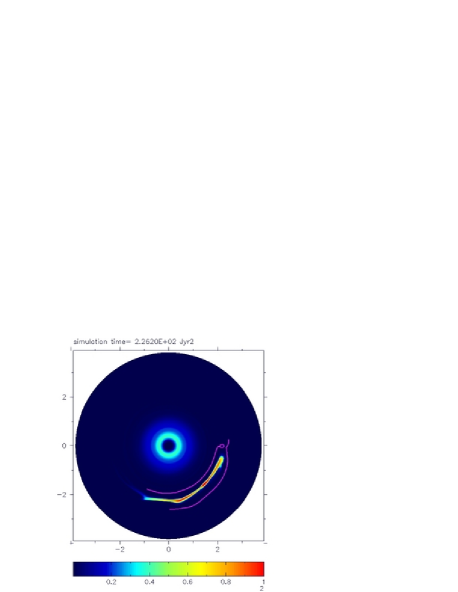
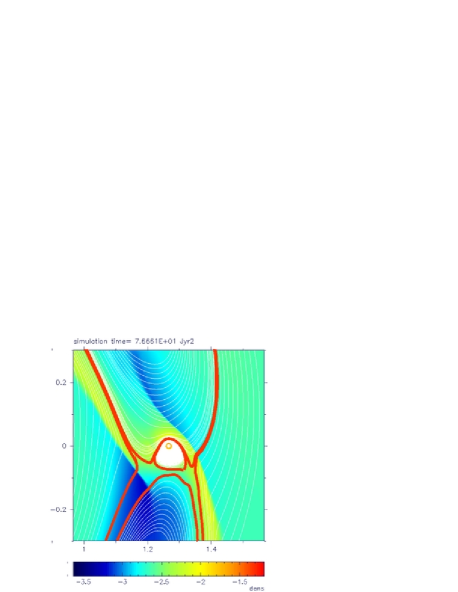
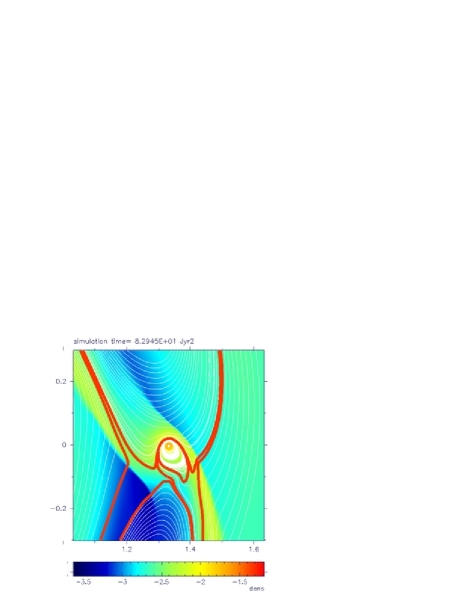
A similar dependency is observed for the outward migration case. However, the fact that the volume (and mass) of the co-orbital region grows with during outward migration produces important differences. The relation between the shape of the horseshoe region and the non-dimensional migration rate for the outward migration in the slow and the fast migration regimes is illustrated by models M1 and M2, respectively. The results are presented in Figs. 3 and 4. The plots show the mass fraction of the gas that initially was placed in the corotational region , where is here the distance to the star and is the initial planet’s semi-major axis. The mass fraction goes from (dark blue; region occupied by the gas from the inner or outer disc only) up to (red; region occupied by the gas from corotation only).
We first consider the slow migration regime (M1, Fig. 3). In this case, unlike the inward directed migration, most of the gas placed initially in the co-orbital region is captured by the planet in the tadpole-shaped horseshoe region around the generalised libration point G5333In Paper II we introduced the concept of the generalised Lagrangian points G4 and G5, which for a slowly migrating planet correspond to L4 and L5 libration points. This distinction is necessary, since for a rapidly migrating planet these libration points move in a direction of a planet. and migrates together with the planet. The top left and a top right panels present the outward migration phase for ( orbits) and ( orbits) respectively. In the first panel the horseshoe region is visibly asymmetric, with only one tadpole being present. The azimuthal extent of the horseshoe region is about and the co-orbital flow is a relatively broad stream, giving a large positive value for the torque . In the second panel both tadpoles are present and the asymmetry of the horseshoe region is starting to disappear. As the azimuthal extent of the horse shoe region grows, that of the co-orbital flow shrinks. This reduces the co-orbital torque (and the total torque which is dominated by the co-orbital torque) considerably. The co-orbital flow keeps decreasing with decreasing and disappears in the subsequent inward slow migration phase, when the horseshoe region covers the entire azimuthal range (lower left panel). For the planet’s radial motion is slow and a gap has started to be cleared as the planet makes the transition to type II migration. The last panel displays the mass fraction at after the planet has almost opened a gap in the strongly eccentric circumstellar disc.
During the outward migration phase with (upper left panel) the gas captured in the horseshoe region does not mix with the co-orbital flow. The situation changes for the slower migration. The horseshoe region increases its volume with decreasing and the planet captures part of the gas from the co-orbital flow starting a strong mixing of the gas.
This behaviour of model M1 is similar to the scenario described in Paper II, where we also found a smooth transition between the fast and slow migration regimes corresponding to an increase in the extent and symmetry of the horse shoe region, and a shrinking of the co-orbital flow. Note however that the reasons are different: decrease of the co-orbital mass for the inward migration case and increase of for M1.
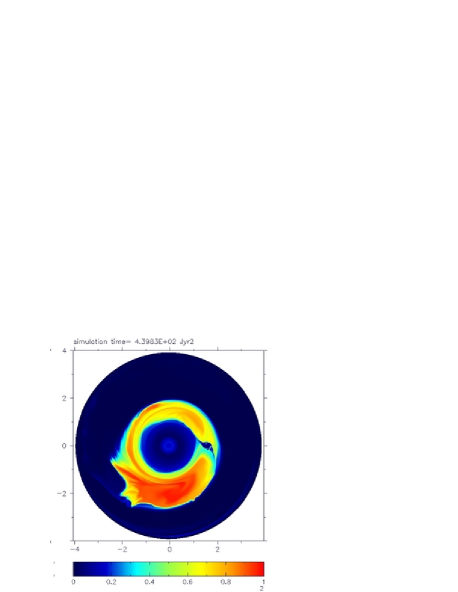
Model M2 shows a different evolution, see Fig. 4. As in M1 most of the gas initially placed in the co-orbital region is captured by the planet in the tadpole-shaped horseshoe region around the G5 libration point and migrates together with the planet. The top left and a top right panels present the migrating planet during the phase of increasing , with ( orbits) and ( orbits). At both times the horseshoe region is a single tadpole-like region, and the co-orbital flow has a wide azimuthal range. The azimuthal extent of the horseshoe region clearly decreases with and is about and for and respectively. On the other hand the radial extent of this region increases, since , and the amount of mass in the co-orbital region grows during the migration making outward migration potentially a self-accelerating, run-away process. In M1 the run-away character is suppressed due to the rapid grow of the planet’s inertia. But even in M2, where the planet mass is constant, we do not find run-away migration. The reason is that for the given disc structure there is a critical value of , for which the horseshoe region disconnects from the planet, leading to a decrease of the co-orbital torque. This process is shown in the lower left and lower right panels. Here the planet is slowing down its migration at () and () orbits respectively. The pink lines are the flow lines at the border of the horseshoe region and show that the gas marked by the red colour does not fill the whole horseshoe region. After the initial horseshoe region disconnects from the planet causing a drop in , the azimuthal extent of the horseshoe region grows rapidly as the migration rate drops. As a result a large amount of gas from the co-orbital flow is captured by the planet in the new horseshoe region, stopping the mass transfer between outer and inner disc which was responsible for the rapid migration. We find the stream-lines in the co-orbital region to change rapidly and no smooth transition from outward to inward migration occurs. This behaviour is similar to the stopping of inward migration at a disc edge (Paper II, Sect. 6). We will discuss this in more detail in Sect. 5. However we will encounter these two stopping mechanisms below in other simulations. We will refer to them as stopping mechanism M1 (for stopping due to mass accumulation), and M2 (for loss of the horseshoe region).
Model M2 does not show not much mixing between the gas originally captured in the horseshoe region and the co-orbital flow. Note that during the entire phase of fast migration a small amount of the gas is leaving the horseshoe region, flowing along the bow shock in the inner disc. This is visible in the plots as a light blue spiral.
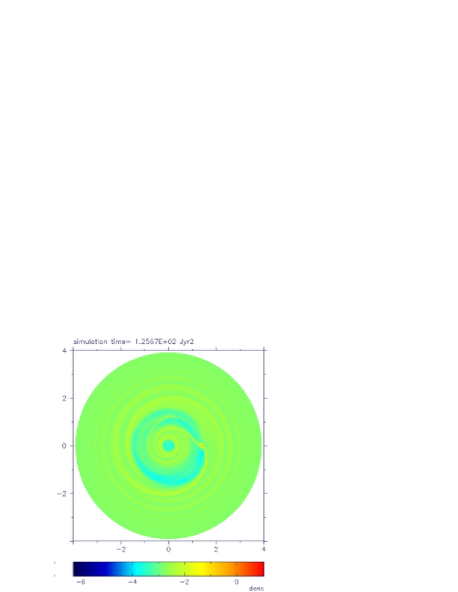
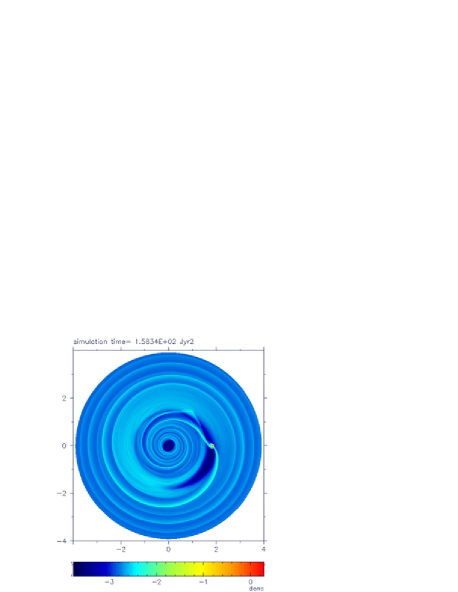


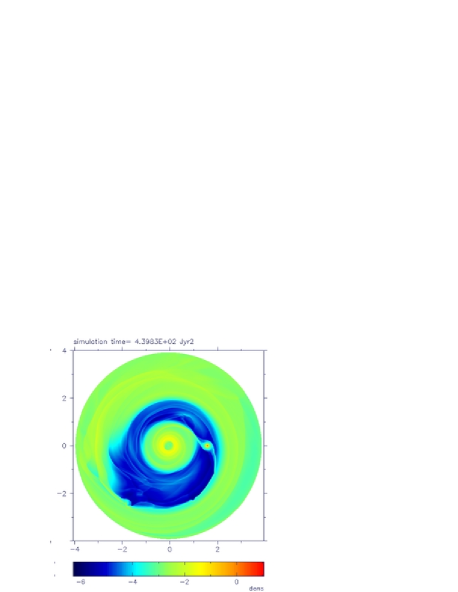

3.3 Surface density
The global surface density distribution is presented in Fig. 5. The left column shows the surface density profiles for model M1 at (upper), (middle) and (lower) orbits. These correspond to upper left, upper right and lower right panels in Fig. 3. The first plot shows the planet migrating outward with . The shape of the low density region in the co-orbital region agrees mostly with the shape of the horseshoe region, but fills the whole azimuthal range and the first signs of gap creation are visible. This is more prominent at orbits (), when the horseshoe region fills the whole corotation region and captures gas from the co-orbital flow. There is a small asymmetry between the Lagrangian points L4 and L5, which does not grow until the planet’s eccentricity increases rapidly. After about orbits both the planet’s and the outer disc eccentricity quickly grow and the interaction of the disc with the outer boundary starts to be important. After orbits about () of the disc mass leaves the computational domain through the outer boundary. The surface density for the eccentric outer disc is presented in the last plot.
The right column presents the surface density for model M2 at times (upper), (middle) and (lower) orbits, corresponding to the upper left, upper right and lower right panels in Fig. 4. There is a visible asymmetry in the co-orbital region in all the plots, but only in the first and second plot is this related to the co-orbital flow. These two plots show the planet migrating in the fast migration regime with (first plot) and (second plot). The first one corresponds to the maximum value of (and ) and shows the smallest extent of the horseshoe region during the entire simulation. The low density region represents the gas that was initially captured by the planet and covers the whole horseshoe region. The strong co-orbital flow is visible. The second plot represents the phase when the planet has reduced its migration rate. Here the horseshoe region has grown and captured gas from the co-orbital flow. The low density region does not cover the whole horseshoe region and only represents the position of the gas that was initially captured by the planet. It has sharp edges as no mixing has happened. The last plot shows the planet reversing its direction of migration with . There is a visible asymmetry in the corotation, even though the co-orbital flow is very weak here. This is caused by the fact that the transition between the outward and inward migration takes place rapidly, and the gas does not have time to adjust to the new configuration. For the same reason the planet does not open a gap, even though it temporarily migrates in the slow migration regime. At this stage the low density region starts to disappear, and it is completely gone during the inward migration phase.
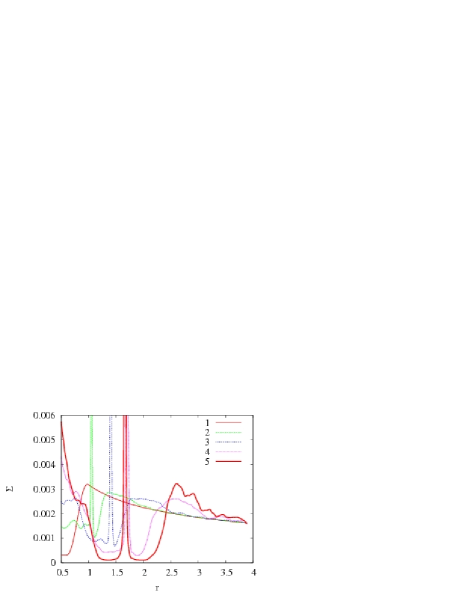
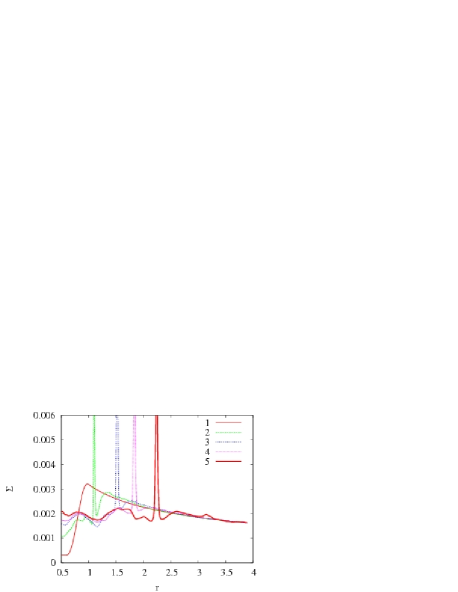
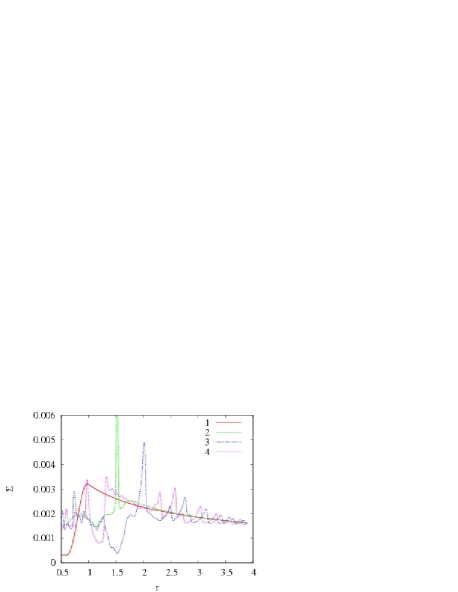
These processes are further illustrated in the upper row in Fig. 6. The upper left panel presents the azimuthal average of the surface density over for model M1 at times , , , and orbits (curves 1, 2, 3, 4 and 5). The first curve shows the initial conditions, and curves 2, 3 and 4 present the outward migration phase. Curve 5 corresponds to the inward migrating planet inside a gap. The planet in fact starts to clear a gap shortly after the migration starts, however the co-orbital flow is strong enough to fill the inner region of the disc, increasing the density there considerably. The upper right panel presents the azimuthal average of the surface density for model M2. Curve 1 shows the initial conditions, and the curves 2, 3 and 4 correspond to the outward migrating planet. Curve 5 shows the average density profile for the planet at the transition between outward and inward directed migration . During the whole simulation the planet is unable to open a gap, even during the time when . Like in model M1 the co-orbital flow is strong enough to fill the inner disc and the final disc density profile is relatively constant.
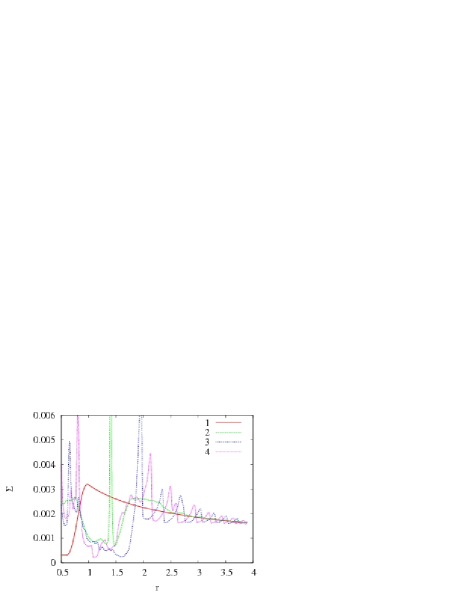
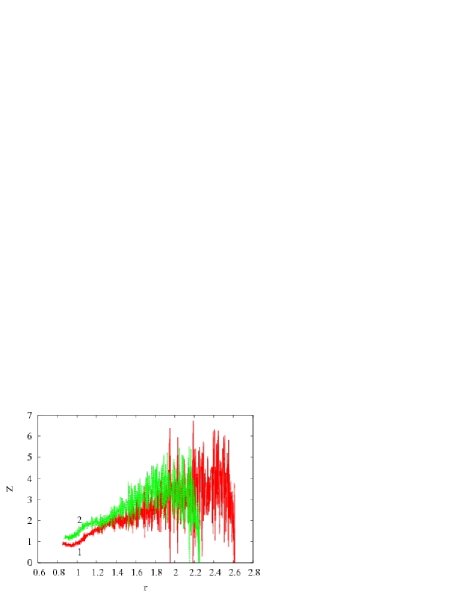
The lowest row in Fig. 6 illustrates the density asymmetry in the co-orbital region. It shows the initial density profile (curve 1), the azimuthal average of the surface density (curve 2) and the surface density cuts through the libration points L5 (curve 3) an L4 (curve 4). The cut through L5 gives the approximate width of the co-orbital region and the density inside the horseshoe region. Similarly the cut through L4 gives the approximate value of the density of the gas crossing the co-orbital region . As explained in Paper II, the difference between and is the main reason for type III migration.

The lower left panel presents M1 at orbits during the outward migration phase (). Since the planet is in the slow migration regime and gap opening has already started, the asymmetry between L4 and L5 is limited to the outer edge of the co-orbital region. In contrast, model M2 (lower right panel) has the planet migrating in the fast migration regime and the asymmetry covers the whole co-orbital region. In this case the planet carries along the low density horseshoe region with well defined sharp edges and an almost static value of the surface density . The value for is close to the initial density profile at the current planet’s position.
4 Dependence on the simulation parameters
After having described the two standard cases of outward migration, we now discuss the dependence of the migration process on various simulation parameters.
4.1 Planet’s mass
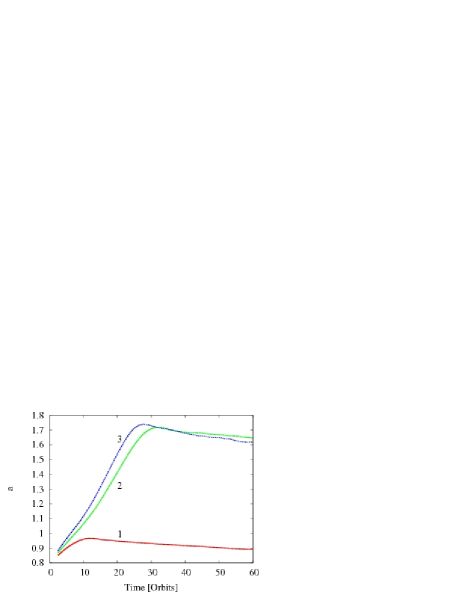
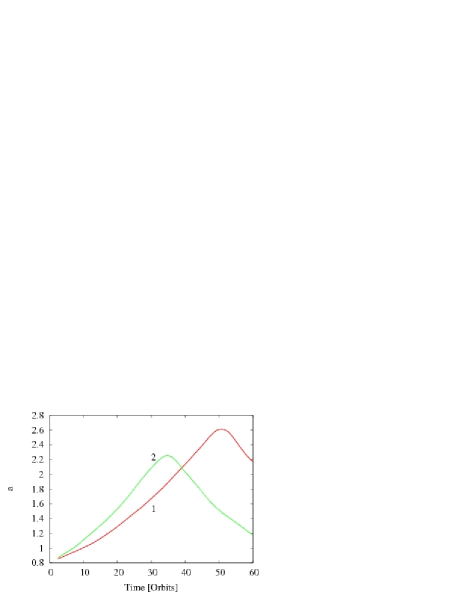
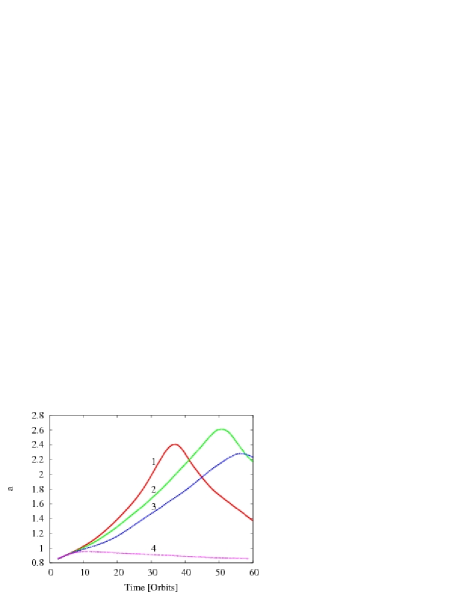
The first important parameter is the planet mass. In our investigation we concentrate on the orbital evolution of giant planets. In Papers I and II we showed that in the fast migration regime, planet mass does not influence the migration significantly, whereas in the slow migration regime the migration is strongly dependent on . The relation between and the planet’s migration for outward migration is presented in Fig. 7. We ran models with initial masses equal , (standard case M1) and (curves 1, 2 and 3 respectively). The effective planet mass was allowed to increase, .
The upper left and upper right panels show the planet’s semi-major axis and the migration rate . There is a clear difference between the evolution of the two first models and the last one, indicating a sharp border in parameter space for which the outward migration is allowed. In the last model the amount of mass in the corotation is too small to support the initial impulse for outward migration and the planet transits to an inward migration case at . Note that even though the initial migration rate is similar for all the models, the non-dimensional migration rate (lower left panel) differs since . We find that to start outward migration the initial average should be bigger or close to , and the last model does not satisfy this criterion having an (extrapolated) initial value of . Mass accumulation does not play a role here, as the increase of is relatively modest ( after orbits) and does not influence the migration in a major way.

The two lower mass models satisfy the criterion stated above, with extrapolated values of and , respectively. During the first orbits both systems evolve almost exactly the same way, even though the migration takes place in the slow migration regime. This can be understood from the fact that the non-dimensional migration rate is relatively close to 1 () and the migration is mostly determined by the increase of the gravitational planet’s mass, which grows in a similar way in both models (reaching about ). Unlike the inward migration case (Paper II Sect. 5.1), the amount of mass accumulated by these planets is almost independent of its initial mass. The difference is relatively small (of order of ) and does not play the role while is increasing.
The evolution starts to differ after drops below and starts to decrease. The migration rate drops faster for the model with the larger initial planet mass and the planet moves from the outward to inward migration at about orbits and . For the lighter planet this transition takes place at about orbits and .
The relation between planet mass and orbital evolution is visible on the lower left panel, where the non-dimensional migration rate is plotted as a function of the planet’s position in the disc. The increase of planet mass, until reaches the critical mass for which outward migration is no longer possible, causes to diminish smoothly and moves the curve to the right. In this case the region of the disc where the rapid migration can take place shrinks with increasing and the planet stops closer to the star.
4.2 Effects of circumplanetary disc aspect ratio
The next parameter we investigate is the circumplanetary disc aspect ratio . We performed a set of three simulations with different values of and . The results are presented in Fig. 8. We use the same set of plots as in Fig. 7: the evolution of the planet’s semi-major axis and the migration rate in the upper panels, and the non-dimensional migration rate as a function of the planet’s position in the disc together with the evolution of the effective planet mass in the lower panels. Curves 1, 2 and 3 correspond to (standard case M1), and respectively.
The planet’s mass is strongly dependent on the circumplanetary disc aspect ratio and decreases with increasing . In the first model with , the gravitational planet’s mass grows up to causing the planet to migrate in the slow migration regime. In the second model with , grows during the whole outward migration stage reaching , however it stays very low during the first orbits allowing the planet to migrate in the fast migration regime. A similar behaviour is seen for , but in this case is almost constant.
There is an important difference between the first () and the second () model. In the first model the outward migration stops due due to the rapid increase of the planet’s inertia, but in the second one does not grow enough to reduce considerably and increases significantly. This gives a rapid increase of the non-dimensional migration rate up to at which point changes in the flow structure in the co-orbital region similar to those found for standard case M2, slow down the migration. The increase of the circumplanetary disc aspect ratio allows the planet to migrate faster and to larger radii. The planet reaches at orbits and at orbits in the first and the second model respectively.
A further increase of does not influence the migration significantly, and the evolution of the second and the third model is similar. However, increasing implies lowering , giving a faster increase of . That is why in the model with the flow inside the Roche lobe changes its structure for a lower value of and the planet changes to inward migration at orbits reaching a maximum orbit . In the last model the migration rate grows up to , but in the second model reaches .
Summarising, as in the inward migration case the temperature profile influences the planet’s orbital evolution mostly by limiting the amount of mass in the Hill sphere. gives a rapid grow of and the planet stops due to the increase of its inertia. Higher values for reduce the effective planet mass and lead to the other stopping mechanism (M2), where the flow in the planet’s vicinity changes structure for some critical value of . In this case the lower gravitational planet mass (corresponding to higher ) allows to reach this critical value of faster and stop outward migration closer to the star.
The reader has to keep in mind that we present the results of two-dimensional simulations with constant in time, an important simplification. In the case of strong mass inflow into the planet’s vicinity, should be a function of the gas density in the circumplanetary disc, and the possible vertical motions of the gas should be taken into account.
4.3 Dependence on the total disc mass and the initial density profile
Above we discussed the effects of parameters connected to the planet and its circumplanetary disc. In this section we consider parameters describing the global circumstellar disc: the total disc mass given by the disc to the primary mass ratio , and the initial density profile described by the exponent .
4.3.1 Total disc mass
To describe the effect of changing the total disc mass we performed two sets of simulations: one set for the gravitational planet mass increased by the mass within the planet’s gravitational softening (similar to M1) and one set for the constant planet’s mass (similar to M2). In both sets and .
The first set contains three models with equal , (standard case M1) and (curves 1, 2 and 3 in Fig. 9). We see that the results are similar to those of the simulations performed for different planet masses (Sect 4.1 and Fig. 7). As in the case of inward migration (Paper II Sect. 5.3), an increase of the disc mass acts in a similar way as decreasing the planet mass. There are however also some differences.
In the simulation with the lowest disc mass the amount of the mass within corotation is not sufficient to support type III migration, and the planets stops outward migration after orbits reaching . In this case at the start of the simulation, and the criterion for outward migration is not satisfied. This illustrates again the sharp border in parameter space for which outward type III migration is allowed. The combination of planet and disc masses gives a single parameter defining the disc region where the type III migration is allowed.
In the second and the third model the condition for the outward migration is satisfied with the initial averaged equal and respectively. The evolution of these models is similar, however the migration rate for the most massive disc is slightly higher and the planet reaches at orbits. In the second model the outward migration stops at orbits and . The last model shows the fastest increase of the gravitational planet mass too, giving after orbits. In the second model at orbits. This reduces the difference between the migration rate , and the plot of the non-dimensional migration rate as a function of radius (lower right panel) shows a very similar evolution for both systems. This is different from the models with different planet masses (where the lighter planet can travel further away), and the inward migration case (where modifies the planet’s migration in a significant way).
In the second set of simulations () we have two models with equal and . The results are presented in Fig. 10. Curves 1 and 2 correspond to the first and the second model respectively. In a more massive disc the planet migrates faster and has a higher mass accumulation rate, but the maximum value of the mass within the Hill sphere is similar for both models and equals about . Similarly the migration rate increases faster for the more massive disc, but both models reach the same maximum value, at and orbits for model 1 and 2 respectively. After the migration rate starts to decrease, is still growing and reaches its maximum at and orbits. However, the transition between outward and inward directed migration takes place at () and () orbits. So, although the more massive disc allows the planet to travel faster, the outward migration phase lasts shorter and the planet actually stops closer to the star. This is caused by the nature of the stopping mechanism which here is M2-like. In both models the rapid changes start upon reaching , a value only weakly dependent on . The more massive disc shows a stronger increase of and reaches this critical value sooner.
4.3.2 Initial density profile
The final parameter we consider is the density exponent . Since the evolution of the models with is dominated by the mass accumulation and only weakly depends on , we performed a series of simulations with constant , and equal , , and (curves 1, 2, 3 and 4 in Fig. 11). The density gradient at the initial planet position is the same in all presented models, giving the same initial value of the migration rate .
Once again this set of simulations shows the sharp boundary in parameter space for which outward migration is allowed. Although the initial condition for outward migration is satisfied for all the models, in the last simulation (, curve 4) the mass within corotation is too small to support the migration and the planet switches to inward migration after about orbits reaching . The mass within its Hill sphere does not exceed .
The other models migrate in the fast migration regime, however the migration rate depends strongly on . The smallest gradient in the density profile corresponds to the biggest mass in the corotation region and allows for the fastest increase of , reaching after orbits. This gives a maximum value of . Similarly this model shows the quickest increase of the mass within the Hill sphere giving at about orbits. The transition between outward and inward migration takes place at about orbits and .
Lower means lower mass within the corotation region, and thus slower migration. That is why the migration rate grows slower in the second model reaching after about orbits, and remains approximately constant with between and orbits in the third model. Although is almost constant in model 3, grows in both models reaching about and in the second and the third model respectively. The lower value of allows the planets to travel outward for a longer time, and only switch to the inward migration phase after about () and () in model 2 and 3 respectively. The rate of the mass accumulation in the Hill sphere decreases with decreasing , however the final mass in the first and the second model is quite similar. In the third model reaches almost .
One thing that this series of simulation shows is that the critical value of for stopping mechanism M2, is not universal, but actually depends on the exponent in the density profile and decreases with decreasing .

5 Stopping type III migration
In Paper II we described two possible mechanisms of stopping type III migration (or more precisely, switching it to type II migration). Inward migration can be slowed down by the simple geometrical effect of the shrinking of the co-orbital region with decreasing semi-major axis, or by the interaction with a steep density gradient, such as a disc edge. The second mechanism acts in the same way for outward directed migration, but the first one would make outward type III migration a self-accelerating process. In this case an additional mechanism is necessary to limit the non-dimensional migration rate .444In most of the simulations grows during the outward migration phase even though decreases; see middle row in Fig. 1. We found two possible mechanisms to achieve this.
The first one is the rapid increase of the planet’s inertia, which lowers and forces the migration to proceed in the slow migration regime (). The example is our standard case M1, in which the effective planet mass grows from up to about during about orbits ( years). Such a rapid mass accumulation seems unrealistic and could be expected to lead to an increase of the disc aspect ratio , which would reduce the mass accumulation rate. Our disc model does not allow for time-dependent values of , but as the growth of the rapidly migrating planet is a highly dynamical process in which a large amount of mass may enter the Roche lobe and interact with the gaseous planet’s envelope, a much more sophisticated method would be needed to model this realistically.
Note that even though such a rapid increase of the effective planet’s mass is more likely to happen in outward migration, we even found it in some cases of inward migration (see the model with described in Paper I Sect. 5.1.2).
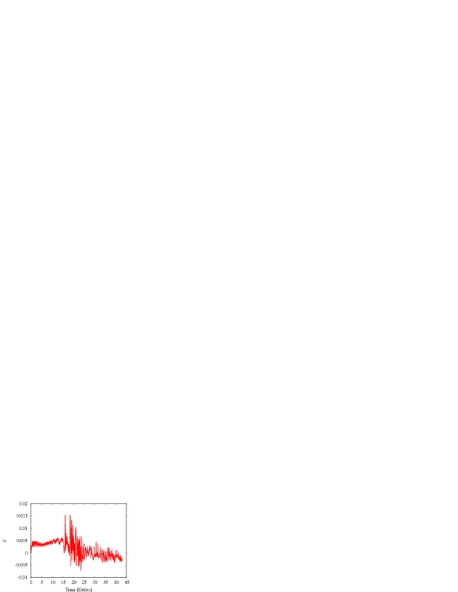
The second stopping mechanism is encountered in models in which the growth of the effective planet mass remains limited555In the model with the final effective planet’s mass is of the order of ; see Fig. 8., and the example is our standard case M2. Here both and grow quickly during the migration until a critical value of is reached and the flow structure in the co-orbital region changes dramatically. The reason for such a rapid change are strong oscillations of the flow in the planet’s vicinity. They are clearly visible in the simulation with (see Fig. 8). In this model the outward directed rapid migration lasts for about orbits and the planet reaches . This simulation has the important advantage that the relatively high value of the circumplanetary disc aspect ratio suppresses the highest frequency oscillations, and consequently it is easier to study the non-time-averaged torque .
The results are presented in Fig. 12. The upper left plot shows the time evolution of the non-averaged torque. There are oscillations of that start at about orbits () and grow in time. These oscillations are caused by cyclic changes of the shape of the circumplanetary disc. One of these cycles starting at about orbits, is presented in the upper right and lower panels. In Paper II we described the flow structure in the planet’s vicinity for different stages of migration, showing that in the fast migration regime the circumplanetary disc is strongly asymmetric (Paper II, upper left panel in Fig. 4) and gives a significant contribution to the total torque (Paper II, Fig. 5). A similar situation can be seen in the upper right panel in Fig. 12, corresponding to a value of close to the maximum of the cycle. The circumplanetary disc has a triangular shape compressed at the side of the co-orbital flow and stretched at the side of the horseshoe region. In a later phase, the orbits in the circumplanetary disc have stretched even more at the side of the bow shock in the outer disc (lower left panel) giving a small increase of . In the final phase, some mass from the planet’s vicinity leaves the Roche lobe flowing along the outer bow shock (lower right panel), reducing significantly. Using the tracer fluid (marking the position of gas placed in the initial corotation region) we can see that this process involves a big portion of the gas from the co-orbital flow entering the Roche lobe and being redirected back to the outer disc and not accumulating in the planet’s proximity. This strongly perturbs the outer bow shock and giving the oscillations in .
We find that these oscillations grow in time, until they become so strong that they destroy the regular co-orbital flow, starting a period of strong oscillations in and . These strong oscillations of the migration rate open the flow-lines in the co-orbital region and a large amount of gas from the former co-orbital flow is captured into the new horseshoe region. Such a short phase of strong oscillations of averaged and is also visible in the standard case M2 (Fig. 1).
We note that we found a similar process (the corrugation of the inner bow shock by the gas from the co-orbital flow being redirected back to the inner disc) in models for inward migration. However there the oscillations do not appear to grow in time. This difference in behaviour may be due to the inherently self-decelerating and self-accelerating character of inward and outward migration.
One may wonder whether this rearrangement of the co-orbital region is not caused by numerical effects. Although we cannot fully rule out that our disc model influences this process, we still think it is a rather robust mechanism. We find it in models with different parameters and envelope masses, indicating that it is not our self-gravity correction that plays a role here. We also point to the results of Masset & Papaloizou (2003) which showed an outward directed migration to revert its direction after a relatively short time.
6 Eccentricity evolution
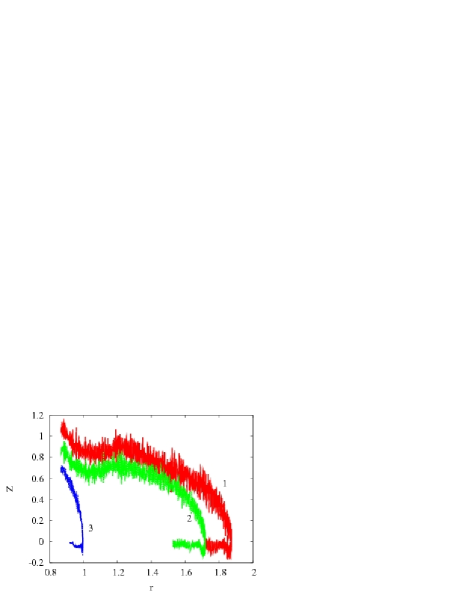
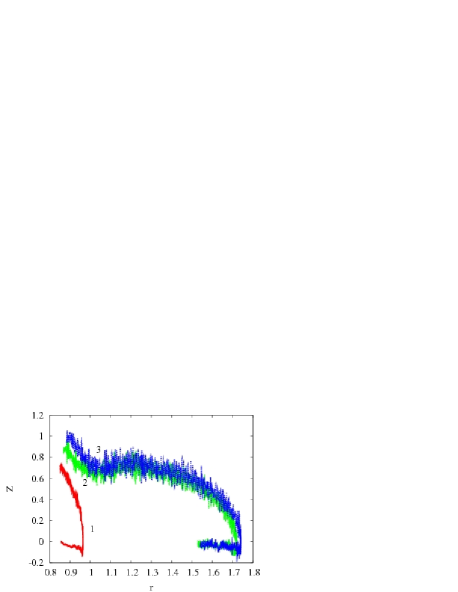
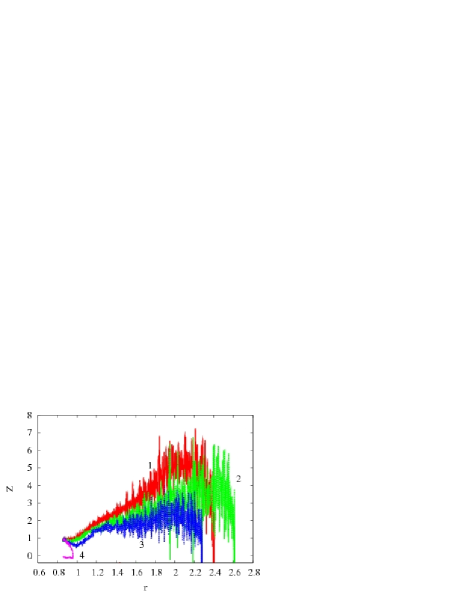
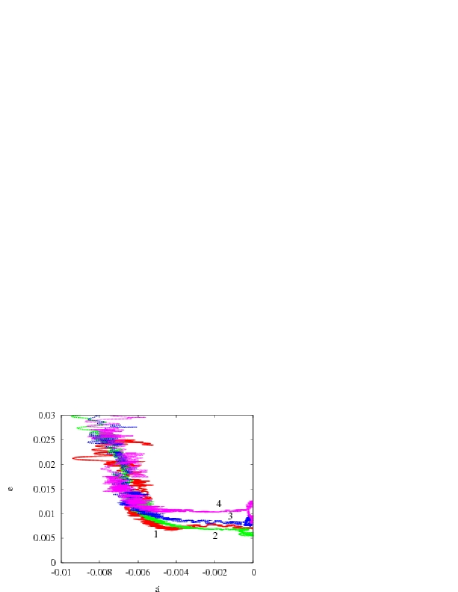
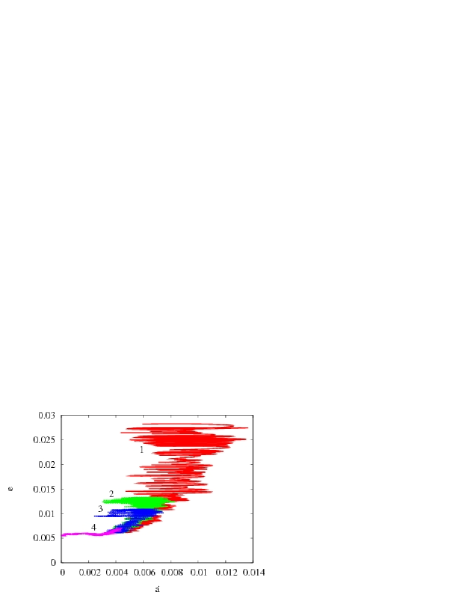
In Paper II we discussed the eccentricity evolution for inward migrating planets. In this case the eccentricity is damped during the rapid migration phase on a time-scale similar to that of migration. Moreover we found the damping time-scale to be independent of the planet mass. In the case of outward migration we find that the eccentricity grows with the migration rate during the whole outward migration phase. These results suggest a correlation between and , as shown in Fig. 13. This plot shows the results of the inward (left panel) and outward (right panel) directed migration models for different prescriptions of the effective planet’s mass ( for curve 1 and for curves 2, 3 and 4) and different initial planet’s masses ( equal , and for curves 2, 3 and 4 respectively). For the outward directed migration only the rapid migration phase is plotted.
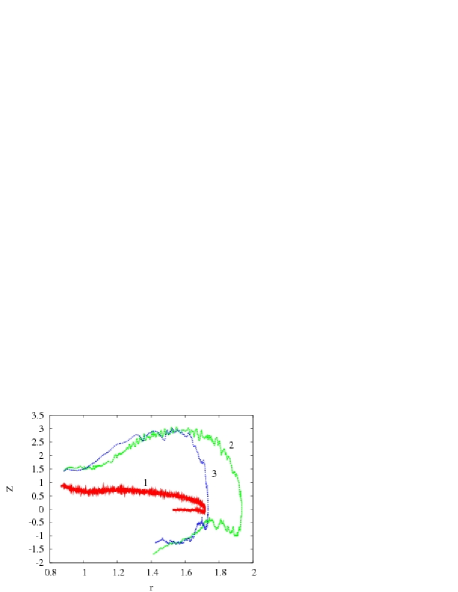
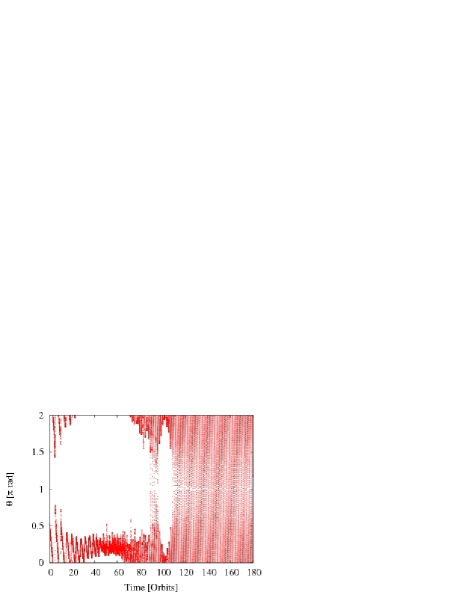
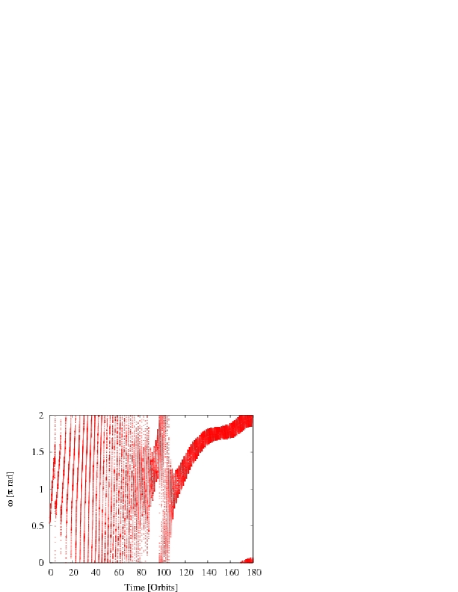
The eccentricity is approximately constant for and grows rapidly for bigger absolute values of the migration rate. This relation is similar for inward and outward directed migration and is weakly dependent on the planet mass. The origin of this relation is unclear, but it may be caused by the fact that the spiral orbit of a rapidly migrating planet cannot be properly represented by Keplerian elements. This conclusion is supported by the fact that during the rapid migration phase, unlike in the gap formation phase, the true anomaly for the migrating planet oscillates in a relatively narrow range of angles, but the argument of periastron ranges from up to (Fig. 14).
7 Conclusions
In this paper we investigated the outward directed type III migration of the high-mass planet embedded in a disc. Using two dimensional numerical simulations, performed in a Cartesian coordinate system and the inertial reference frame, we studied the orbital evolution of planets and the dependency on various numerical parameters. The adaptive mesh refinement allowed us to achieve high resolution inside the Roche lobe and study in detail the flow structure in the planet’s vicinity. To avoid problems with numerical convergence we used a modified version of the usual local-isothermal approximation, where the temperature depends on the distance to both the star and the planet, and also added a correction for the gas self-gravity near the planet.
Both inward and outward type III migration are driven by the co-orbital torque. However, the existence of the (inward directed) differential Lindblad torque can be expected to break the symmetry between the two cases. Indeed, the simulations show that outward migration always reverts to inward migration. In fact in some cases this reversal happens almost instantly, and the initial value of the non-dimensional migration rate is found to be crucial here. Placing the planet at an initial density gradient we force the planet to start rapid migration, however the strength of the initial impulse depends on the planet mass and the local density profile, and it can be measured through the initial averaged value of . We found that the disc supports outward migration if the initial . Since the initial decreases with the planet mass and grows with the disc mass. It means that outward migration is easier to start for less massive planets in more massive discs. Note here that although initially is required, this does not mean that outward type III migration can not later proceed in the slow migration regime .
The second important difference between inward and outward migration is caused by the relation between the planet’s semi-major axis and the volume of the co-orbital region. In Paper II we showed that the migration rate can be approximated to be dependent on the mass of the co-orbital region, and for the inward rapid migration is a self-decelerating process (the mass of the co-orbital region decreases during migration). For the same reason outward directed migration is a self-accelerating process. The migration rate grows with during the outward migration phase, however the non-dimensional migration rate can grow or decrease depending on the effective planet mass.
We found two different stopping mechanisms for outward type III migration. Because of the presence of the Lindblad torques, stopping here always implies a reversal of the migration direction. The first stopping mechanism occurs when the effective planet mass increases enough to make fall below 1 so that the migration proceeds in the slow migration regime. In this case some aspects of the evolution of the system resemble the evolution of the standard case of inward migration described in Paper II. In both cases the transition between and is smooth and proceed in a similar way, however the reason for slowing down migration is different (decrease of the co-orbital mass and increase of for the inward and outward migration respectively). The horseshoe region is initially restricted to a single tadpole-like region and gradually grows filling the whole co-orbital region and decreasing the co-orbital flow. As in the inward migration case the torque is a linear function of . In this model the migration rate is relatively small and the planet starts clearing a gap shortly after the simulation starts.
The other mechanism of stopping outward type III migration is seen in models where the first mechanism does not operate, and the planet keeps migrating in the fast migration regime . The migration is accelerated due to the growth of the co-orbital mass and the asymmetry of the flow in the planet’s vicinity grows too, leading to corrugations of the external bow shock and oscillations in the torque. These oscillations grow in time and finally destroy the co-orbital flow, opening the flow lines in the co-orbital region. Due to this the planet rapidly stops its outward migration and starts migrating inward (also in the fast migration regime). The simulations show that there is a critical value of at which the strong oscillations of start and the planet reverts its migration direction. We found this critical value of to be weakly dependent on the total disc mass , but sensitive to . For our set of simulations this critical value for fell in the range 3–6.
For the second stopping mechanism the whole process of direction reversion is very brief and the planet does not have time to initiate gap clearing. For the same reason the gas from the former (before the slowing down of the migration started) horseshoe region does not mix with the gas captured in the new horseshoe region and can be seen as a low density region in the corotation region. Compared to the slow migration regime, the averaged torque has a weaker dependency on .
Our simulations show a correlation between eccentricity and migration rate, which is almost independent on the planet mass. We found the eccentricity to be approximately constant for and to grow rapidly for bigger absolute values of the migration rate. This correlation may be caused by the fact that the spiral orbit of a rapidly migrating planet is not well represented by Keplerian elements.
Outward directed type III migration is an extreme process in terms of mass accumulation by the planet, and clearly to make progress a more sophisticated model for how the planet deals with such a massive accretion rate is needed. This would involve both improvements in the thermal model used, as well as the inclusion of the self-gravity of the gas. However, outward type III migration can clearly add interesting aspects to planet formation scenarios, allowing both rapid growth and a (perhaps only temporary) increase of its orbital radius.
Acknowledgements
The software used in this work was in part developed by the DOE-supported ASC / Alliance Center for Astrophysical Thermonuclear Flashes at the University of Chicago. We thank F. Masset for interesting and useful comments. Calculations reported in this paper were performed at High Performance Computing Centre North (HPC2N) and National Supercomputing Centre, Linköping, and on the Antares cluster funded at Stockholm Observatory purchased using funding provided to PA by Vetenskapsradet, Sweden. The authors acknowledge support of the European Community’s Human Potential Programme under contract HPRN-CT-2002-00308 (PLANETS), as well as the NSERC, Canada, Discovery grant (2005-2008).
References
- Artymowicz (2004) Artymowicz P., 2004, in Caroff L., Moon L. J., Backman D., Praton E., eds, Debris Disks and the Formation of Planets Vol. 324 of Astronomical Society of the Pacific Conference Series, Dynamics of Gaseous Disks with Planets. pp 39–+
- Artymowicz & de Val Borro (2008) Artymowicz P., de Val Borro M., 2008, ApJ, in preparation
- Artymowicz & Peplinski (2008) Artymowicz P., Peplinski A., 2008, ApJ, submitted
- Boss (2001) Boss A. P., 2001, ApJ, 563, 367
- Crida & Morbidelli (2007) Crida A., Morbidelli A., 2007, MNRAS, 377, 1324
- D’Angelo et al. (2005) D’Angelo G., Bate M. R., Lubow S. H., 2005, MNRAS, 358, 316
- Goldreich & Tremaine (1979) Goldreich P., Tremaine S., 1979, ApJ, 233, 857
- Goldreich & Tremaine (1980) Goldreich P., Tremaine S., 1980, ApJ, 241, 425
- Lin & Papaloizou (1993) Lin D. N. C., Papaloizou J. C. B., 1993, in Levy E. H., Lunine J. I., eds, Protostars and Planets III On the tidal interaction between protostellar disks and companions. pp 749–835
- Lin et al. (2000) Lin D. N. C., Papaloizou J. C. B., Terquem C., Bryden G., Ida S., 2000, Protostars and Planets IV, pp 1111–+
- Marcy et al. (2000) Marcy G. W., Cochran W. D., Mayor M., 2000, Protostars and Planets IV, pp 1285–+
- Masset et al. (2006) Masset F. S., D’Angelo G., Kley W., 2006, ApJ, 652, 730
- Masset & Papaloizou (2003) Masset F. S., Papaloizou J. C. B., 2003, ApJ, 588, 494
- Mayor & Queloz (1995) Mayor M., Queloz D., 1995, Nature, 378, 355
- Paardekooper & Mellema (2006) Paardekooper S.-J., Mellema G., 2006, A&A, 459, L17
- Papaloizou (2005) Papaloizou J. C. B., 2005, Celestial Mechanics and Dynamical Astronomy, 91, 33
- Papaloizou et al. (2007) Papaloizou J. C. B., Nelson R. P., Kley W., Masset F. S., Artymowicz P., 2007, in Reipurth B., Jewitt D., Keil K., eds, Protostars and Planets V Disk-Planet Interactions During Planet Formation. pp 655–668
- Peplinski et al. (2008a) Peplinski A., Artymowicz P., Mellema G., 2008a, MNRAS, accepted (Paper I)
- Peplinski et al. (2008b) Peplinski A., Artymowicz P., Mellema G., 2008b, MNRAS, accepted (Paper II)
- Pollack et al. (1996) Pollack J. B., Hubickyj O., Bodenheimer P., Lissauer J. J., Podolak M., Greenzweig Y., 1996, Icarus, 124, 62
- Vogt et al. (2002) Vogt S. S., Butler R. P., Marcy G. W., Fischer D. A., Pourbaix D., Apps K., Laughlin G., 2002, ApJ, 568, 352
- Ward (2003) Ward W. R., 2003, in Mackwell S., Stansbery E., eds, Lunar and Planetary Institute Conference Abstracts Vol. 34 of Lunar and Planetary Inst. Technical Report, Type II Migration and Giant Planet Survival. pp 1736–+