Modeling of Time-Structured Multi-Turn Injection
into Fermilab’s Main Injector
(Micro-Bunch Injection with Uncontrolled Longitudinal Painting)
Abstract
This article presents the modeling of time-structured multi-turn injection for an upgraded version of Fermilab’s Main Injector with the 8-GeV Superconducting RF proton driver, or the International Linear Collider (ILC)-style linac, or the Project-X linac. The Radio-Frequency (RF) mismatch between a linac and the Main Injector will induce uncontrolled longitudinal painting in RF-phase direction. Four scenarios have been explored with different choices of RF parameters of a single RF system and a double RF system in the presence of longitudinal space charge. It is found from the studies of micro-bunch injection with the aid of ESME (2003) simulations that a dual RF system with an optimized choice of RF parameters enables overcoming the space-charge limits set by beam intensity during the multi-turn injection process. A double RF system with a harmonic ratio () of 2.0 and a voltage ratio () of 0.5 are most favored to reduce both longitudinal and transverse effects of space charge residing in the Main Injector.
1 Micro-Bunch Injection
into the Main Injector from
a Superconducting RF Linac
Following the method of time-structured multi-turn injection from the 400-MeV linac to Fermilab’s Booster [1], we have further explored the scheme of micro-bunch injection for applications to Fermilab’s Main Injector, (from a future Superconducting RF (SCRF) linac to an upgraded Main Injector (MI-2)) 111 We will use the Main Injector (MI) and an upgraded version of the Main Injector (MI-2) interchangeably throughout this article. considering parasitic longitudinal painting. The future SCRF linac referred here can be either the 8-GeV SCRF linac Proton Driver [2, 3, 4], or the Project-X linac [5].
1.1 Overview of the Main Injector
The Main Injector (MI) is a ring with a circumference of about 3.3 (km). The central role of the MI is to connect to the Tevatron, the Booster, the Anti-Proton source, switchyard, and the Recycler Ring via a number of beam transport lines within the Fermilab accelerator complex. The MI accelerates and decelerates particle beams with energy ranging from 8 (GeV) and 150 (GeV), depending on the operation mode. The harmonic number of the MI is 588 and the harmonic RF at injection is 52.8114 (MHz)222 For the sake of brevity and convenience, 53 MHz is referred to as MI RF hereafter..
1.2 Overview of the 8-GeV Superconducting RF Linac
An 8-GeV SCRF linac has been proposed as a single-stage injector into the Main Injector as a replacement for the aging 400-MeV Linac and the 8-GeV Booster. This new 8-GeV SCRF linac would be the highest-energy multi-turn injection system in the world. Fermilab has been carrying out design studies [4, 6] of the SCRF linac and injection systems[7] over the last several years. The linac design[8] utilizes a warm-temperature 325-MHz RFQ and rebunching cavities to bunch the beam at 325 (MHz). At (about ), the RF of the Superconducting (SC) cavities is 1.3 (GHz). The ultimate bunch structure required for injection into the MI will be formed by a 325-MHz fast chopper system[9]. The fast chopper system will be required to remove individual 325-MHz bunches or bunch trains for matching to the MI RF structure and providing a beam-abort notch: two out of every six micro-bunches333 The micro-bunch is referred to as a 325-MHz bunch hereafter. are to be removed.
1.3 Time Structure of the Main Injector
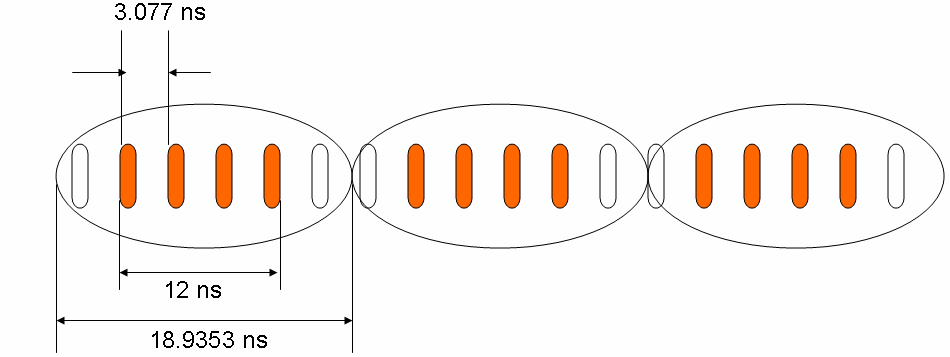
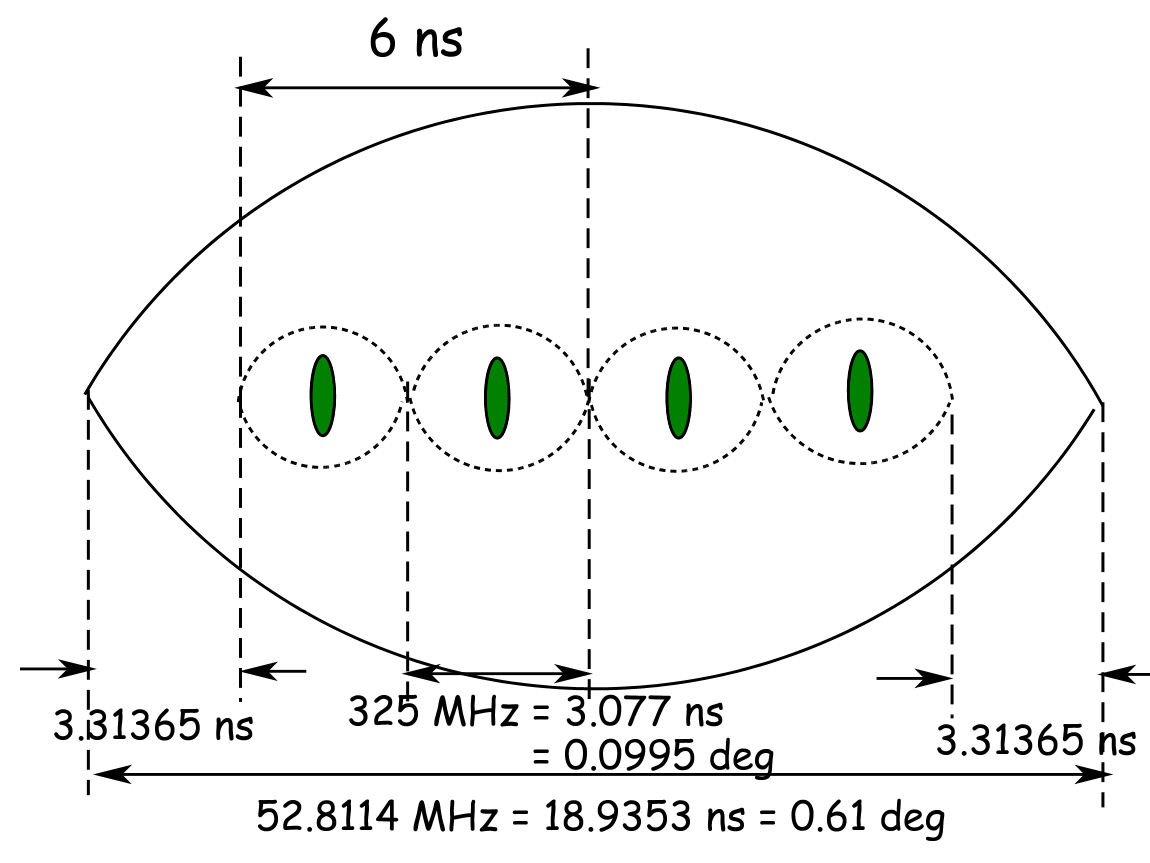
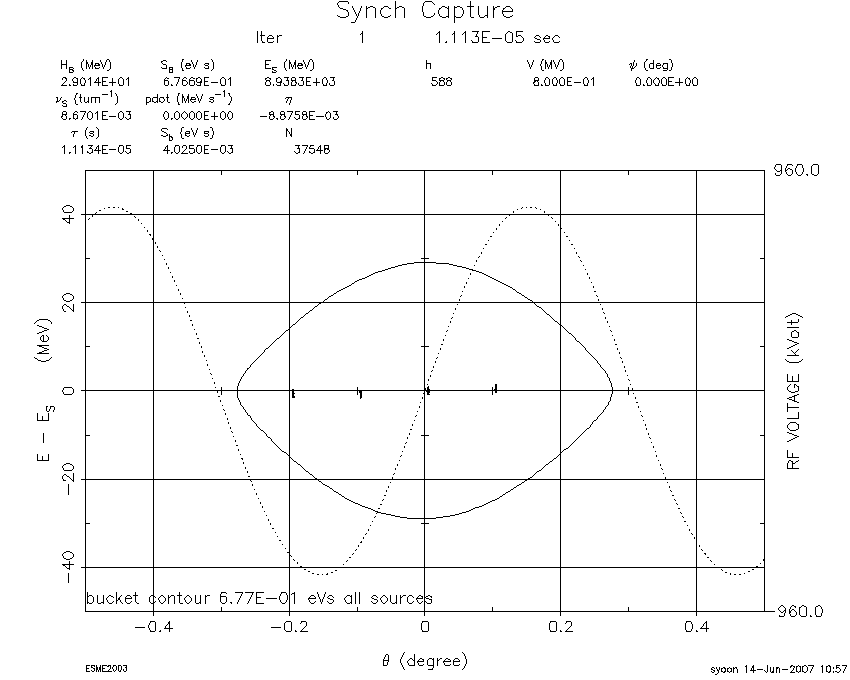
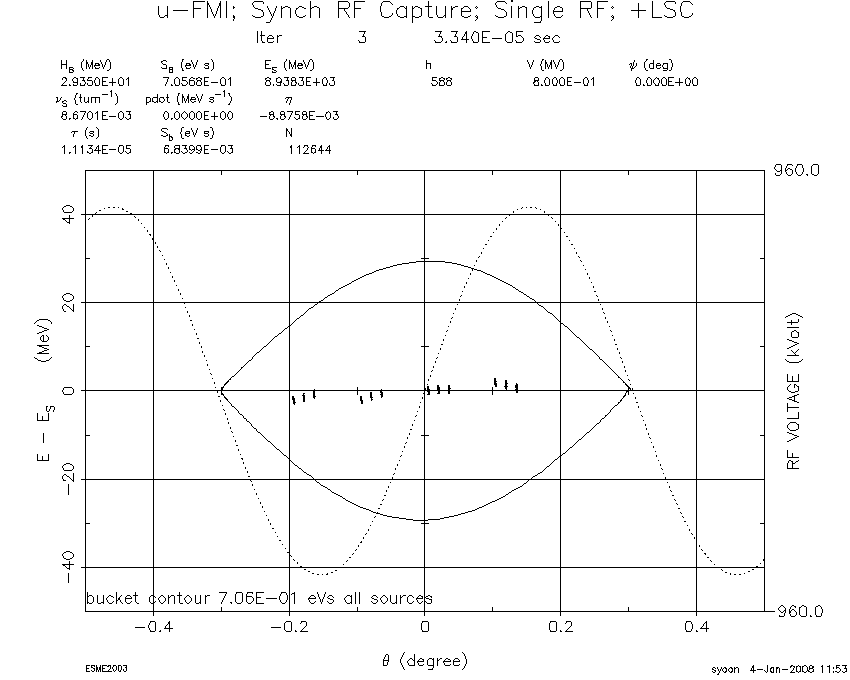
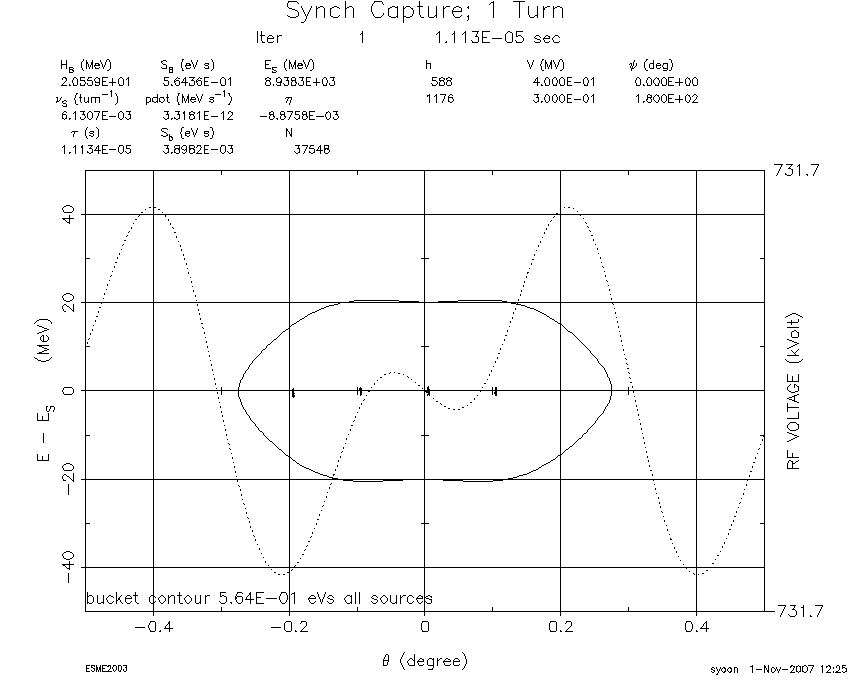
In the injection model the fast chopper system located at the front end of the 8-GeV SCRF linac produces a train of four micro-bunches for being injected into the MI. Illustrated in Figure 1 is a schematic for one MI RF bucket populated with an initial train of four micro-bunches. The two chopped micro-bunches are represented by two consecutive empty 325-MHz RF buckets. A train of four 325-MHz micro-bunches are synchronously injected into a standing 53-MHz bucket. The length of the two chopped micro-bunches is equivalent to 6 ns. More details of the time structure of each MI RF bucket after the first synchronous injection from a SCRF linac are illustrated in Figure 2. A total beam notch per MI RF bucket is about 6 ns, which corresponds to two 325-MHz RF buckets, whereas the principal RF harmonic of 52.8 (MHz) and the sub-harmonic of 325 (MHz). Illustrated in Figure 3 is a phase-space () plot containing the very first train of four micro-bunches with an RF-voltage waveform drawn in the background.
The following is a list of longitudinal parameters that can be seen in the header of each ESME phase-space plot presented in this article:
iter (number of turns), (bucket height), (bucket area), (bunch area), (RF voltage), (synchronous energy), (synchrotron tune), pdot (), (slip factor), (revolution period), h (harmonic number), (synchronous phase), and N (number of macro-particles)
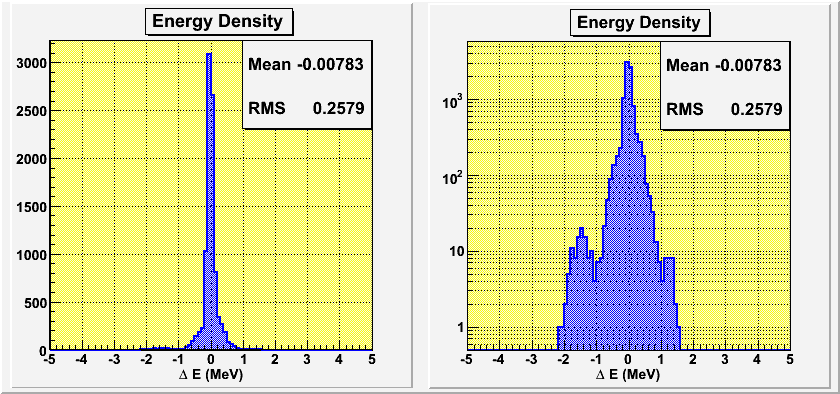
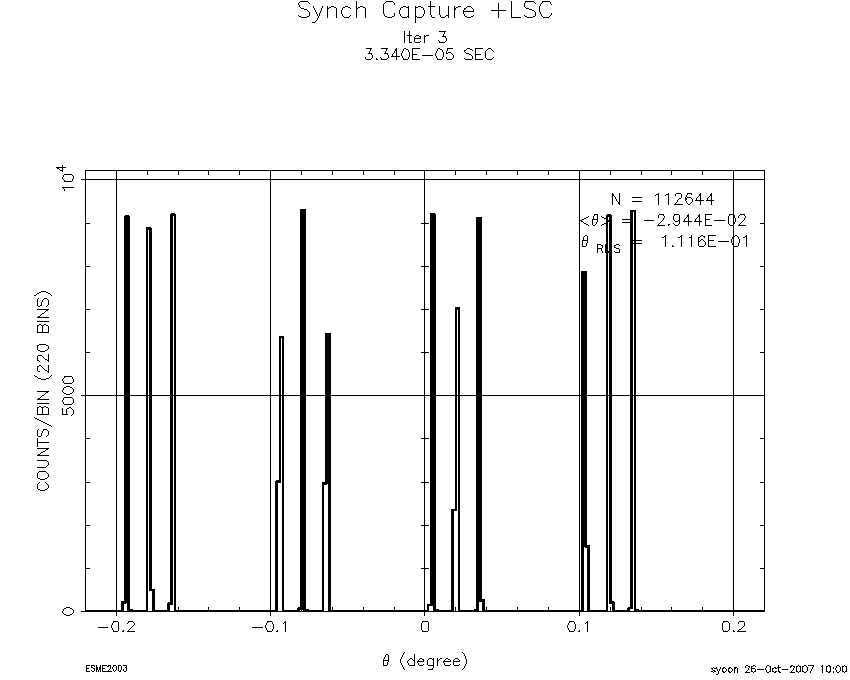
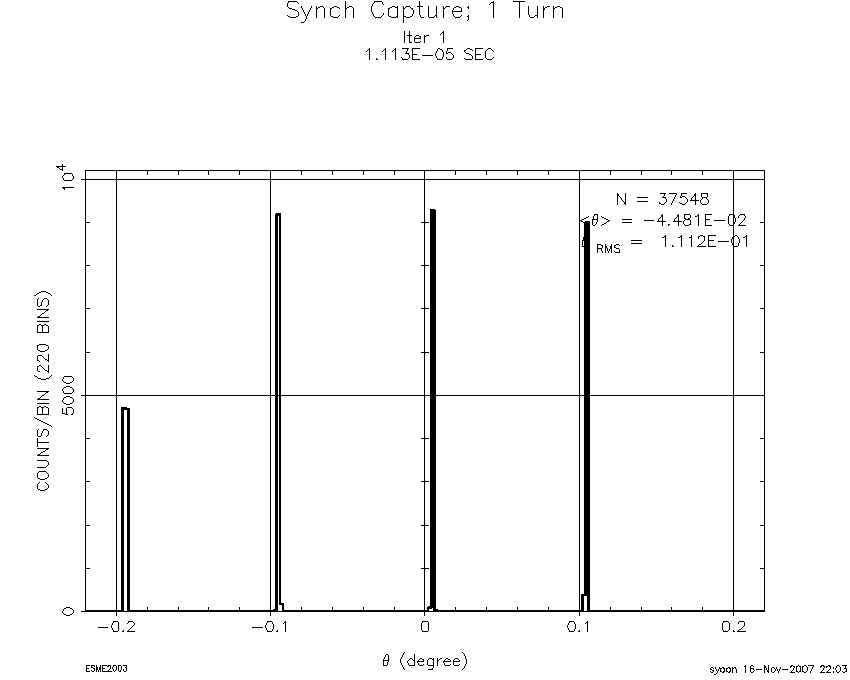
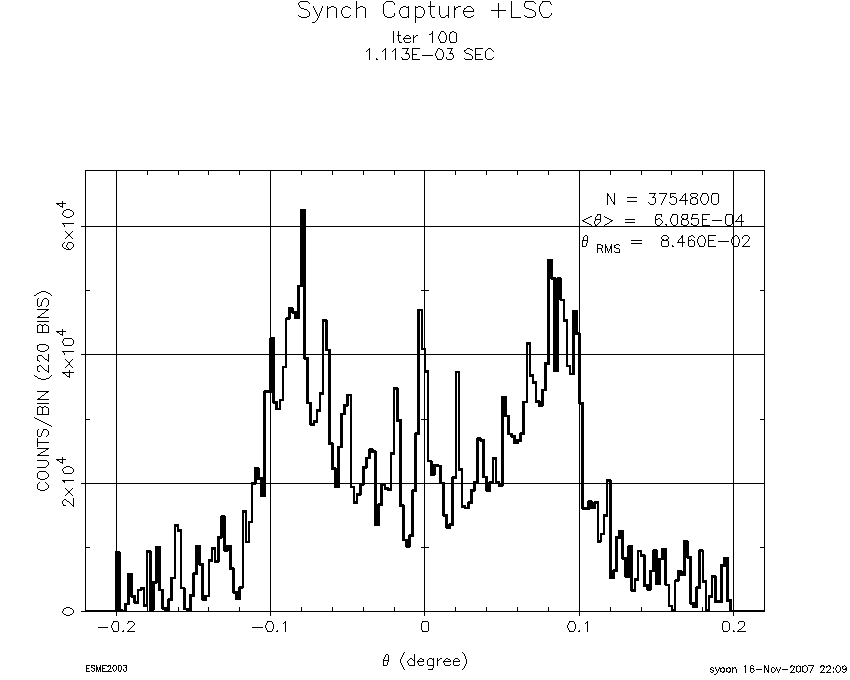
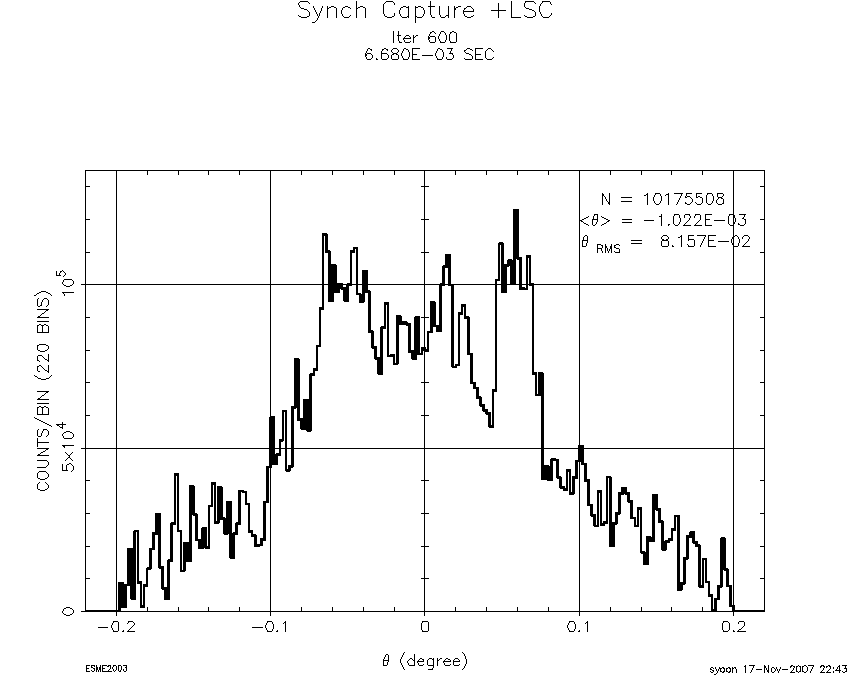
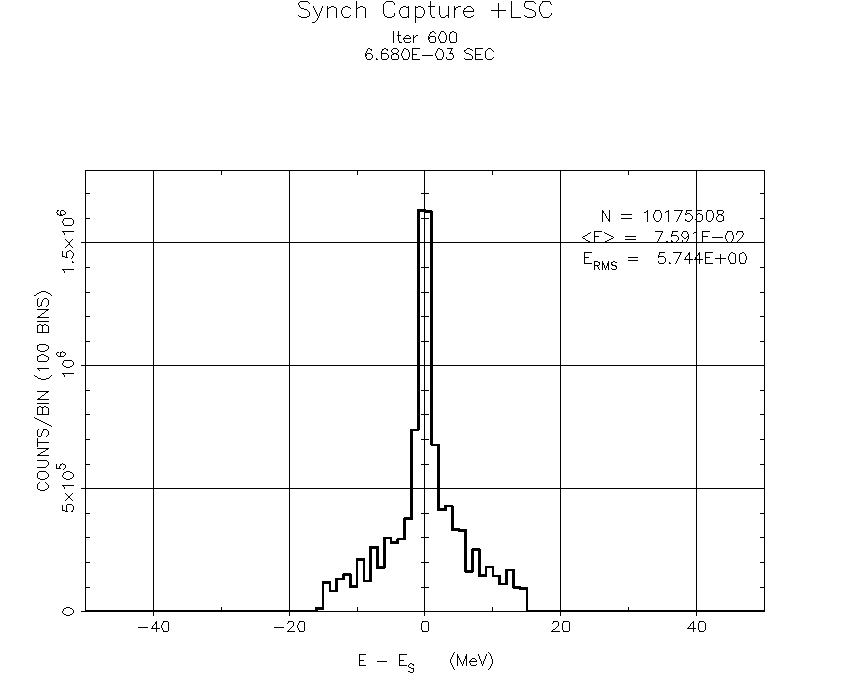
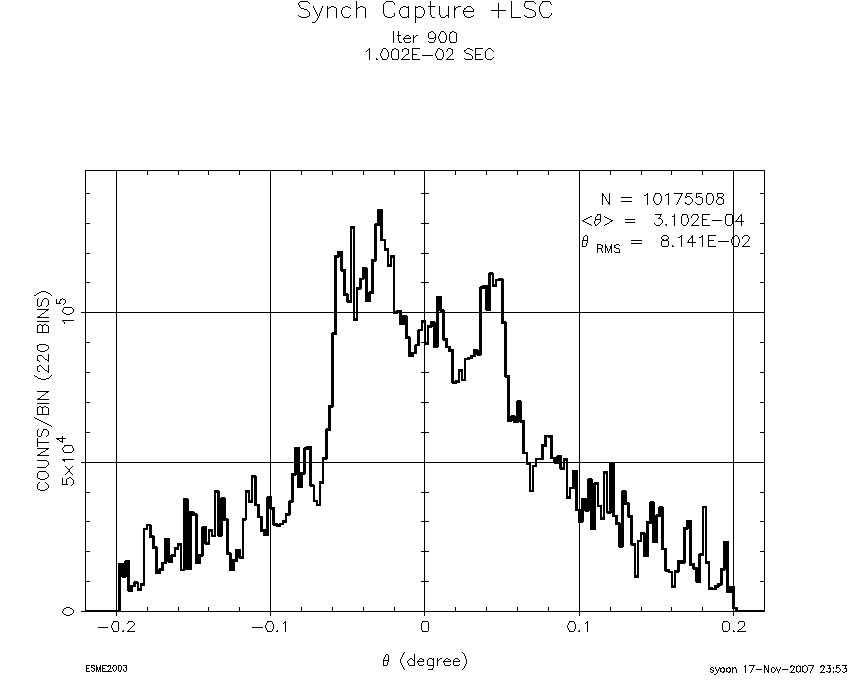
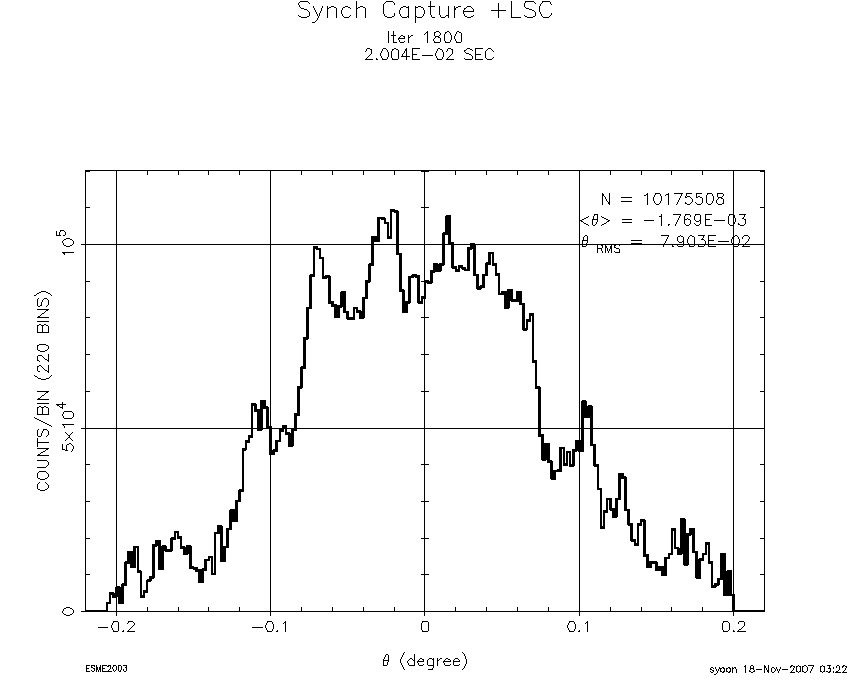
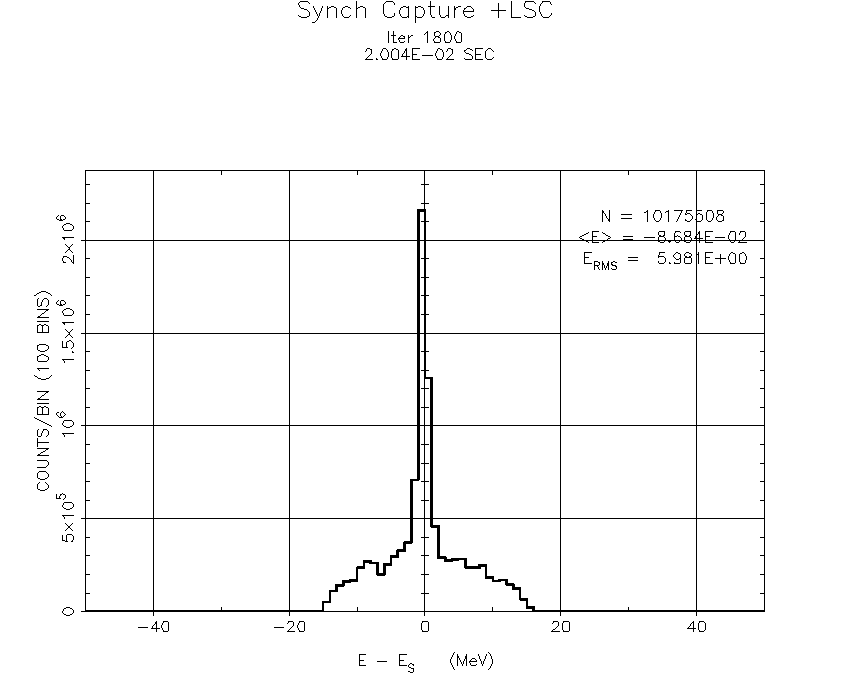
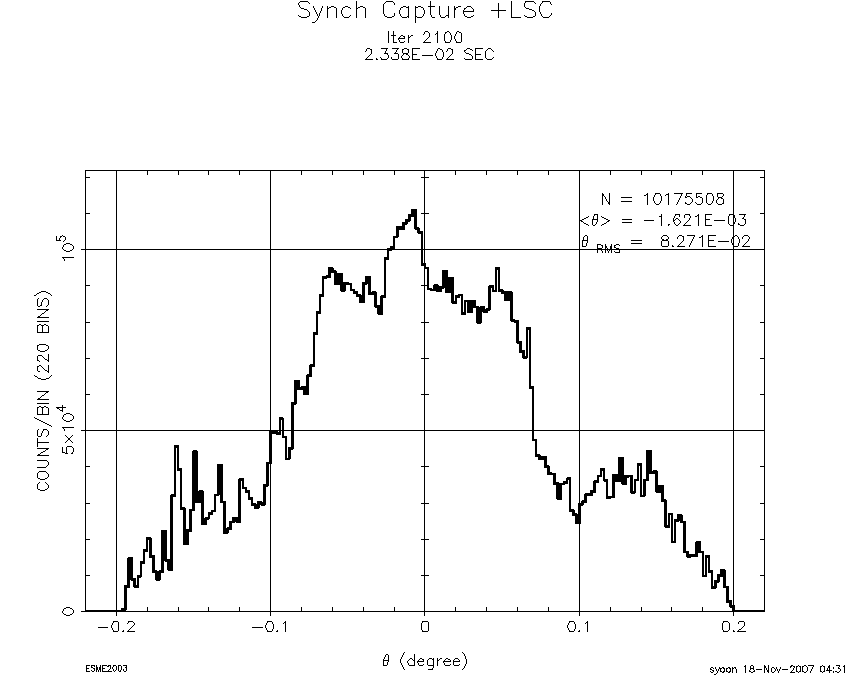
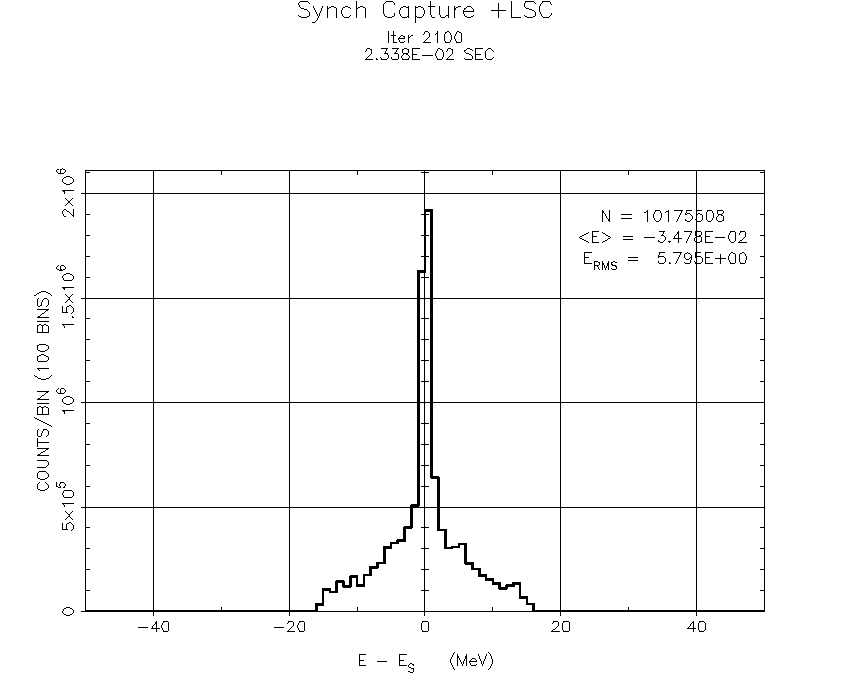
The horizontal axis represents () in units of degrees, and the vertical axis on the left is () in units of , and the vertical axis on the right is in units of for the RF waveform. In addition to the phase-space plot, the azimuthal-density444 The azimuthal density is referred to as the charge density, or the azimuthal profile of macro-particles. and energy-density distributions555 The energy-density distribution is referred to as the profile of macro-particles in energy () direction. of one of four micro-bunches are plotted, using output data generated by ESME simulations as shown in Figures 4 and 5.
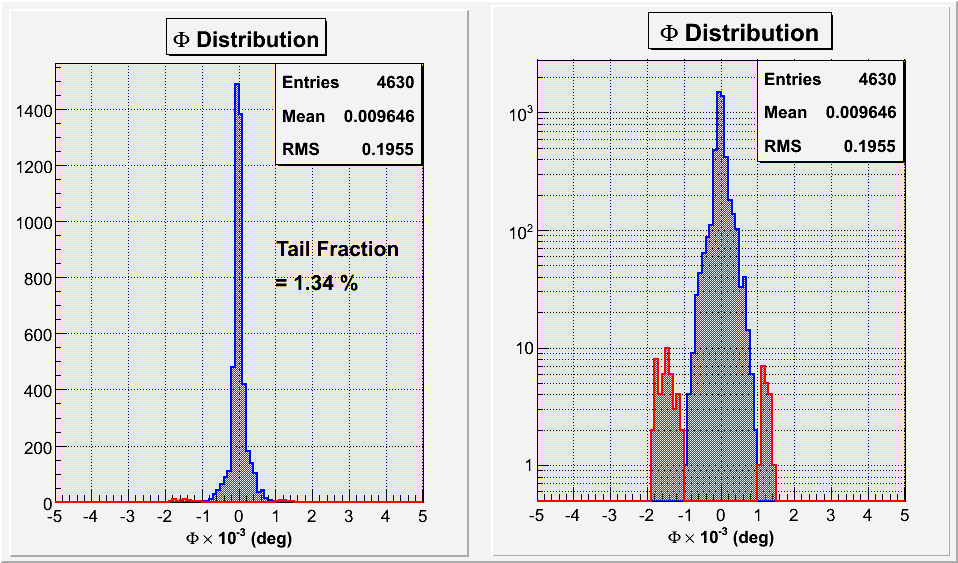
The root-mean-square (RMS) width of one micro-bunch is 1.96 (deg), which corresponds to 6.05 (ps). The area in red, indicating the tail portion of a micro-bunch, is about 1.34. To make the tail portion of a micro-bunch stand out, the density distribution is plotted on a logarithmic scale. The RMS value of initial energy spread is about 0.26 (MeV) per each micro-bunch. Regarding the MI to be a 11.1338-s, or 360-degree ring, we used the following conversion factor:
| (1) |
The principal MI RF is 53 (MHz) and the SCRF linac bunching frequency is 325 (MHz). From the MI RF, we can obtain an integer harmonic number of 588. The width of an MI RF bucket is 18.935 (ns), into which trains of micro-bunches are injected repeatedly during the first 270 turns, while filling in one MI RF bucket in the region of 6 (ns) around its center. The beam notch that is kept free of beams is 3.3 (ns) long, on the basis of an earlier injection study performed with a long bunch[11]. In the following sections, we will explore and discuss several different scenarios of micro-bunch injection, based upon the RF parameters used in the current MI operation.
1.4 Micro-Bunch Injection Scenarios for the Main Injector
The goals for modeling the time-structured multi-turn injection into the MI with a SCRF linac are three-fold:
-
(1)
To find the optimized RF system of Fermilab Main Injector with the following aspects:
-
(a)
Efficient RF capture methods with minimum particle losses
-
(b)
Main Injector RF system with adequate RF parameters
-
(c)
Minimizing space-charge effects in all degrees of freedom
-
(d)
Optimizing total capture time and total injection time
-
(a)
-
(2)
To design a fast beam-chopper system to make nearly loss-free injection attainable
-
(3)
To investigate any limits on the intensity upgrades from the current Main Injector
| Mean Radius | 528.297 (m) |
|---|---|
| Beam Momentum (at injection) | 8.889 () |
| (transition gamma) | 466.53572 |
| Principal Harmonic No. | 588 |
| (synchronous phase) | 0.0 (deg) |
| effective beam radius (at injection) | 0.0050 (m) |
| effective beam-pipe radius (at injection) | 0.051 (m) |
| No. of Space-Charge Bins | 64 |
| No. of FFT Bins | 64 |
| Micro-Bunch Intensity | 2.65 |
| Total Intensity (after injection is complete) | 1.54 |
With the above aims in mind, we modeled four different scenarios of synchronous injection over 270 injection turns, but with different RF harmonic systems and RF parameters. Listed in Table 1 are the key parameters of the Main Injector that were employed in ESME simulations for all scenarios presented in this article.
2 Scenario I
{Bitemize}[t]synchronous injection of a train of 4 micro-bunches into a standing RF bucket single RF Harmonic (53 MHz) = 800 (kV) (fixed RF voltage with no ramping) 270 injection turns ( 3 ms) 2,700 turns ( 30 ms) longitudinal space charge included uncontrolled longitudinal painting in RF-phase () direction
We begin with a single RF system of 53 (MHz) and the fixed RF voltage () of 800 (kV). Referring to Figure 3, a set of four blobs captured in an RF bucket represent the first train of micro-bunches that are synchronously injected into a standing RF bucket. The dotted sinusoidal curve for RF voltage waveform in the background of the phase-space figure indicates the single RF harmonic and the amplitude of RF voltage.
The single turn in the MI in terms of the average machine circumference and the revolution period can be expressed with the following relationship for use as conversion factors:
| (2) |
As illustrated in Figure 2 the relationships, which can be used as conversion factors for one MI RF bucket, are derived from Eqn. (2):
| (3) |
Due to the longitudinal mismatch, or RF mismatch between the SCRF linac and the MI, inherent phase slips, or phase jitters can be induced in the form of uncontrolled or parasitic painting in RF-phase direction. With and being radio frequency and RF wavelength, respectively, we computed the RF ratio ():
| (4) | ||||
in which PD stands for the 8-GeV SCRF Proton Driver. Referring to Figure 2, Eqn. (4) implies that a total of 6 linac RF buckets can fit into one MI RF bucket. Since the RF ratio is a non-integral number, a modulus of the RF ratio is computed as for the case of modeling the Booster’s injection[1]:
| (5) |
Then, the range of phase jitters within one MI RF bucket can be determined:
| (6) |
With phase slips included after the first three injection turns,
trains of micro-bunches captured in an MI RF bucket
and their discrete charge distribution
are acquired as shown in Figure 6.
For each successive MI RF bucket,
a train of 325-MHz bunches advance by 0.0153 (deg).
Accordingly, over 6 injection turns, the trains of micro-bunches
slip through the phase direction across one 325-MHz bucket:
| (7) |
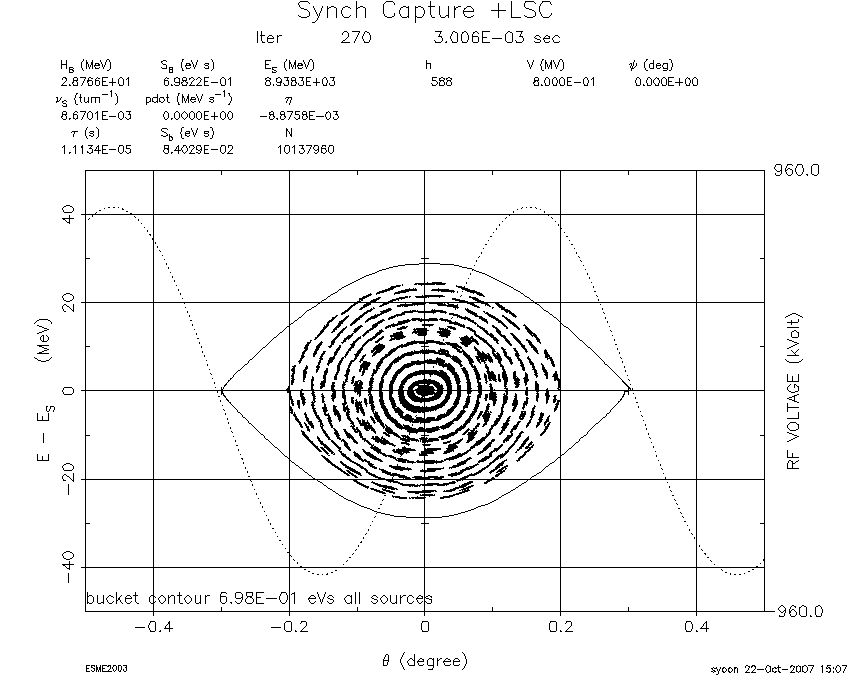
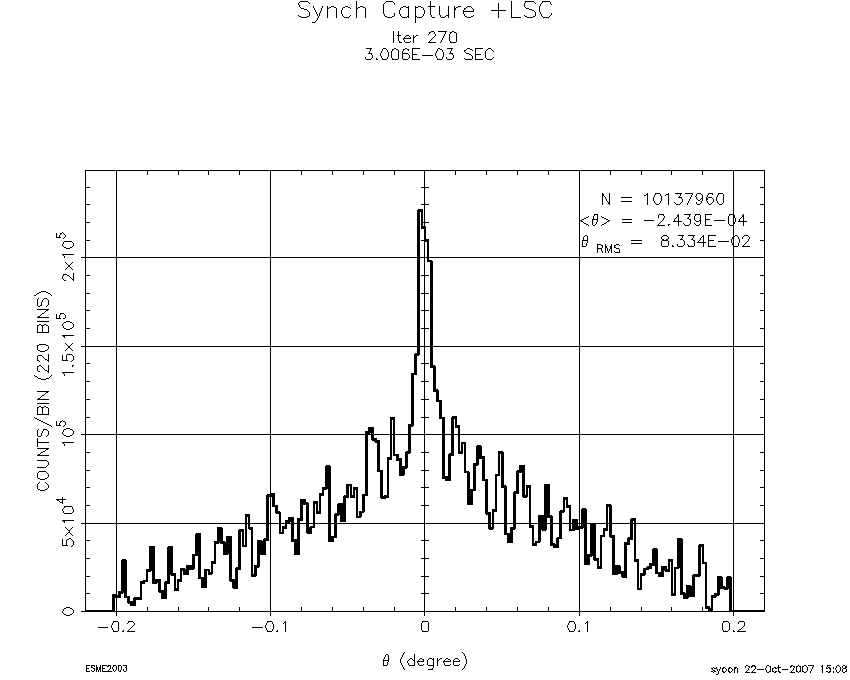
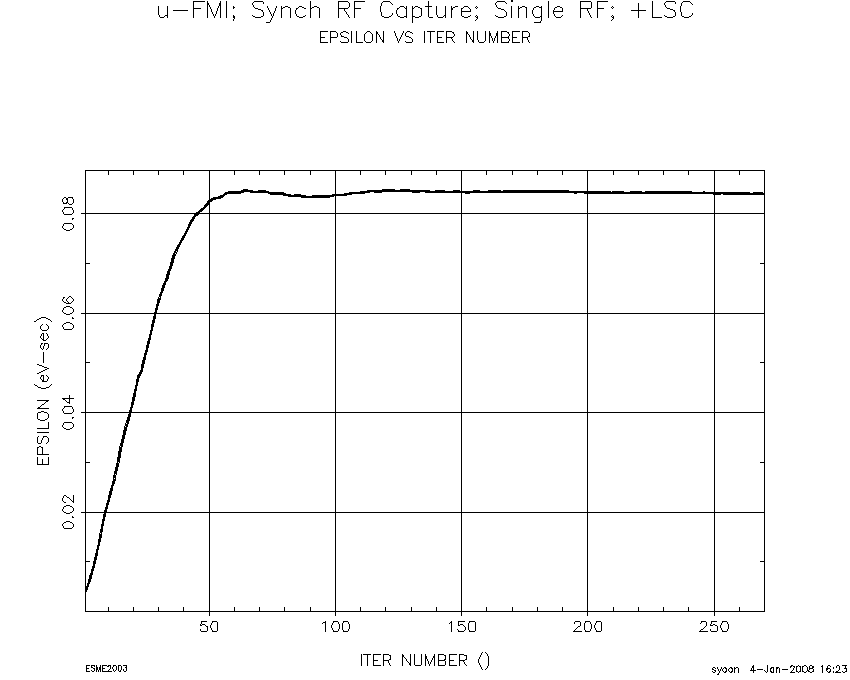
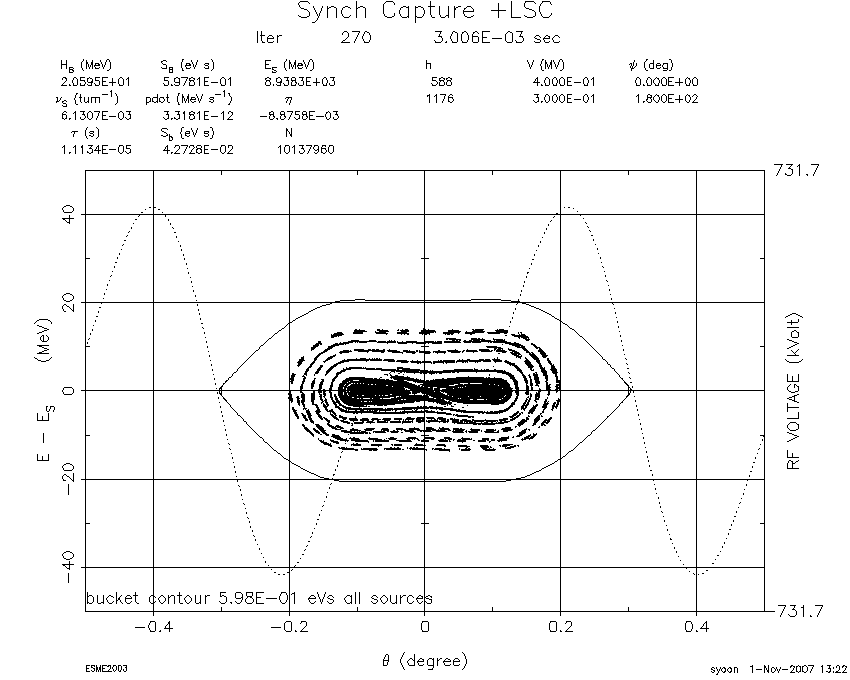
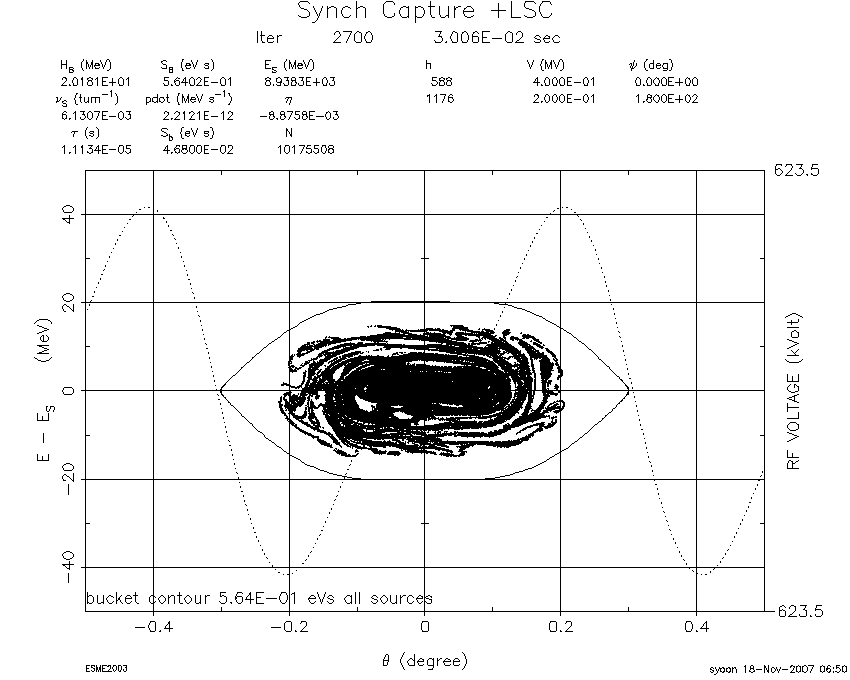
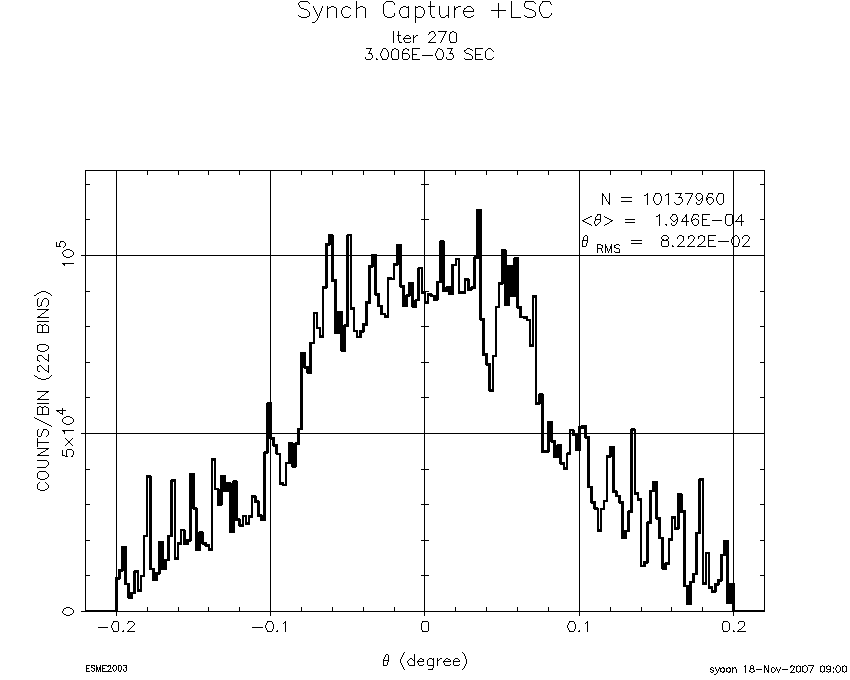
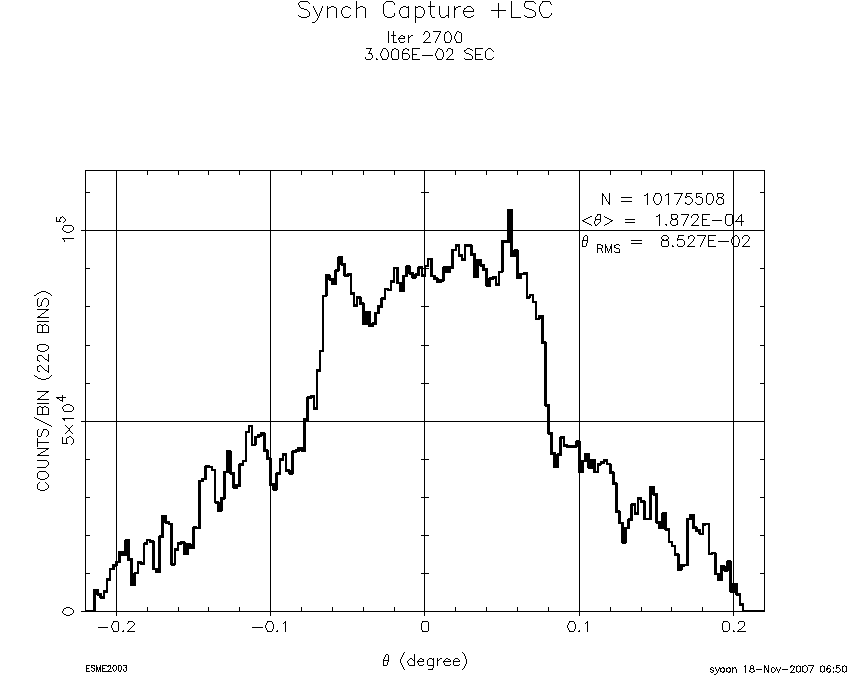
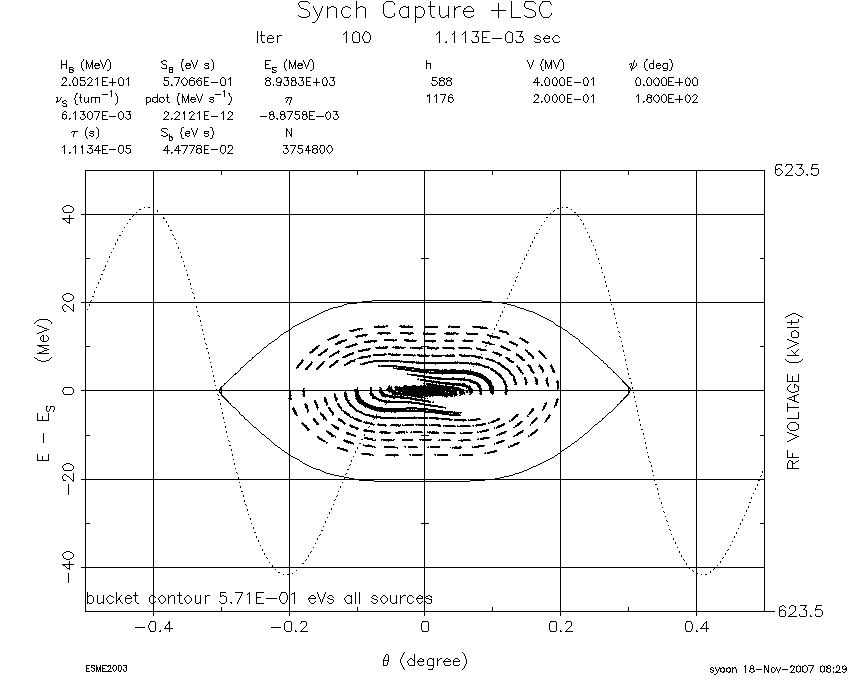
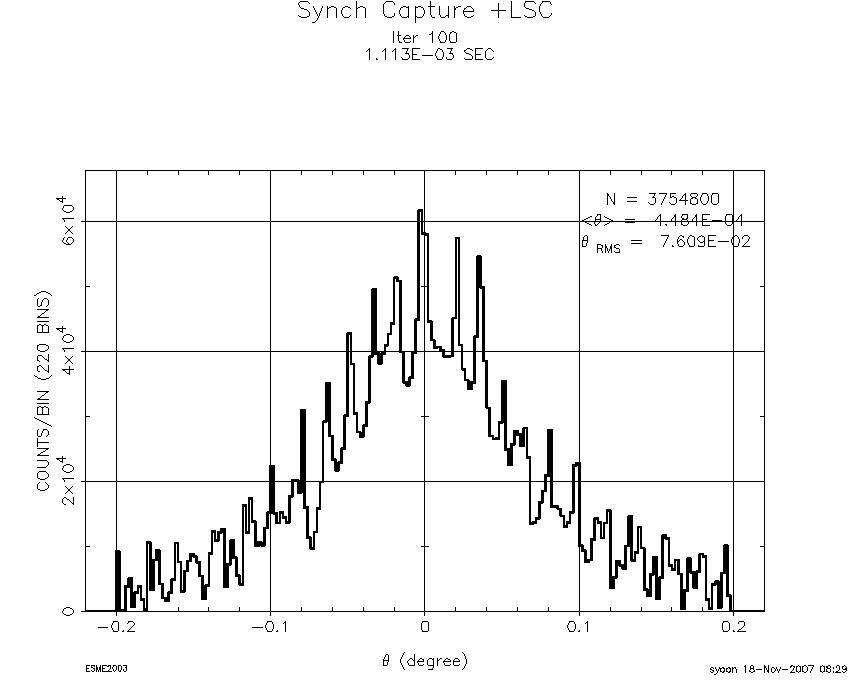
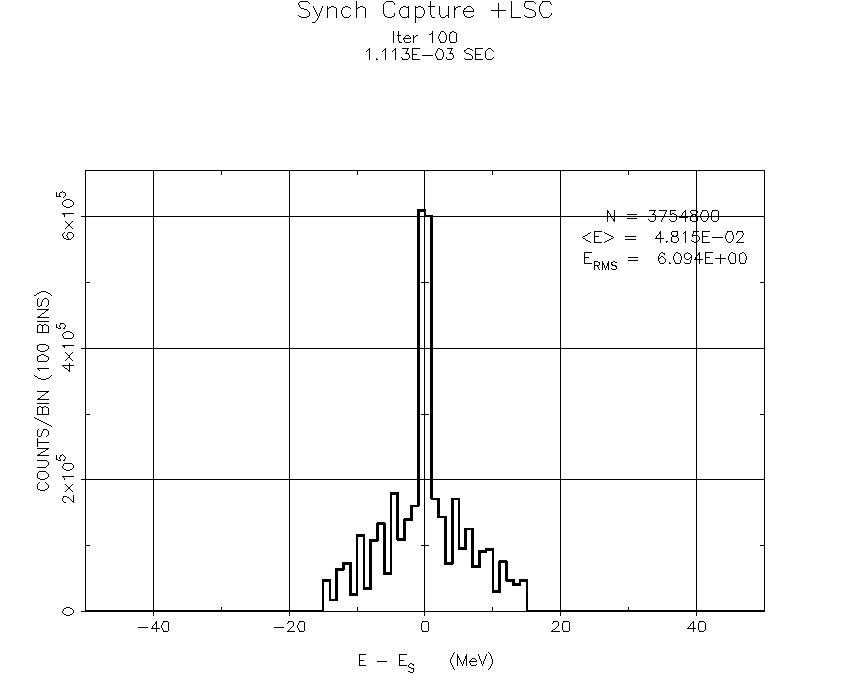
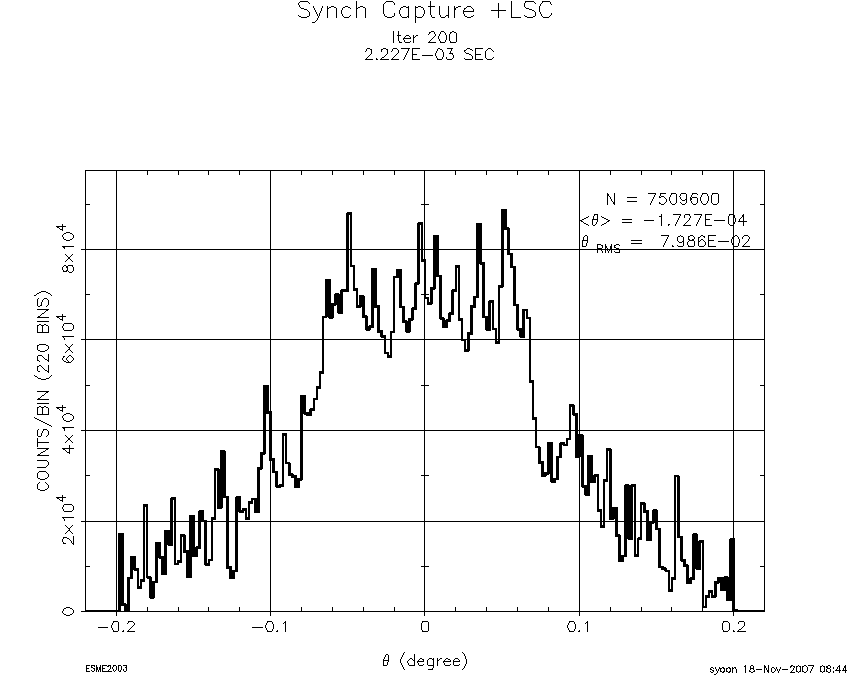
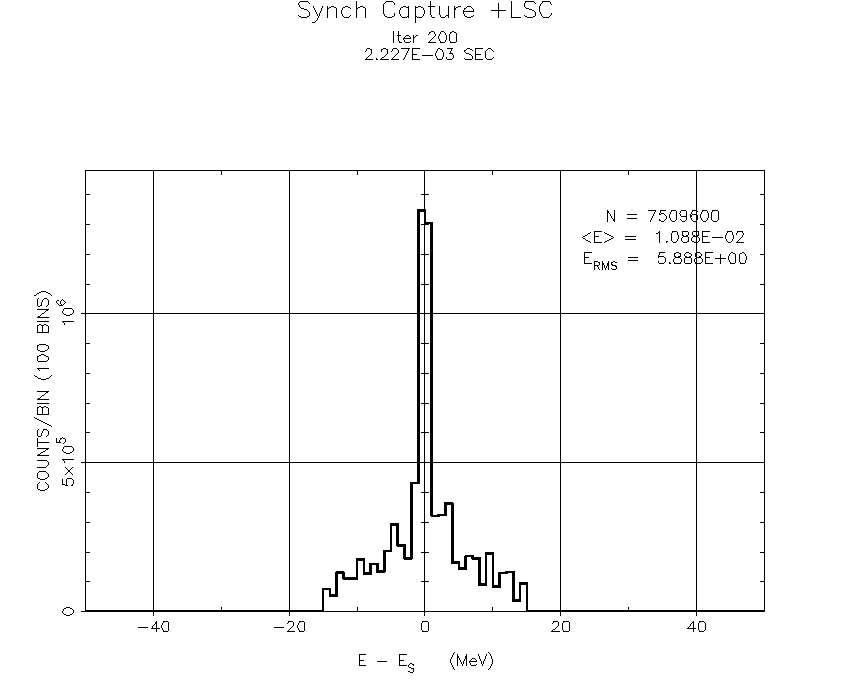
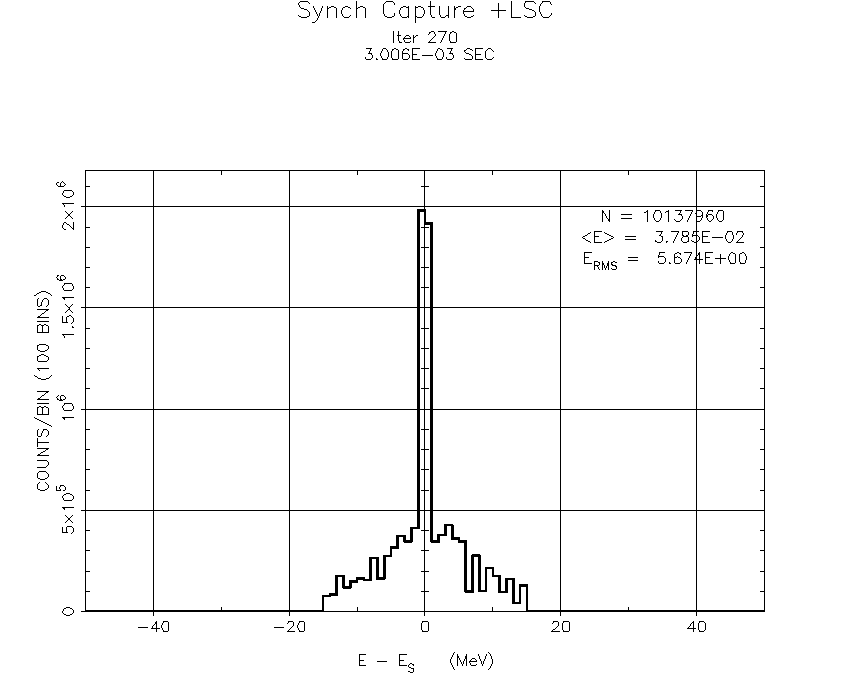
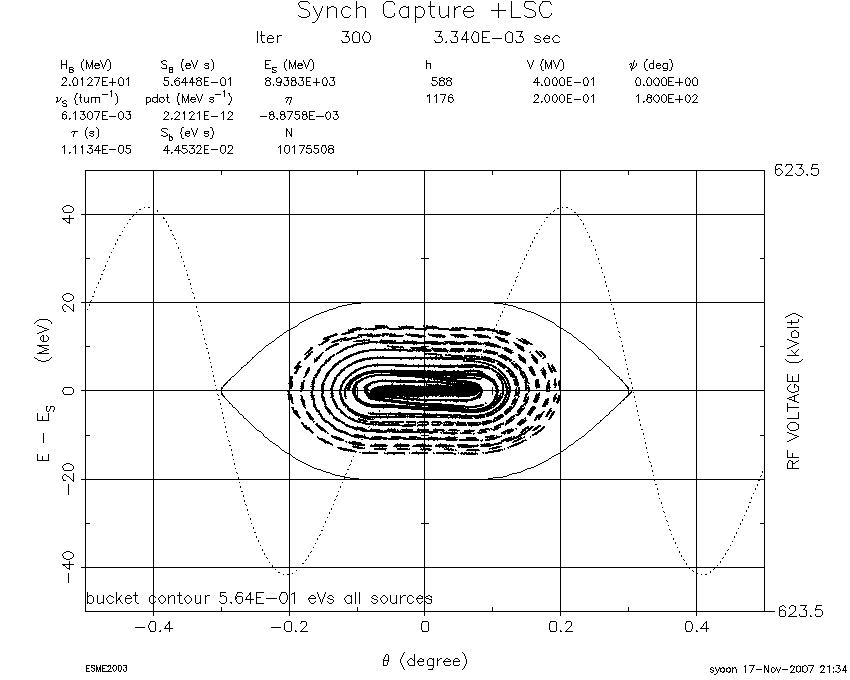
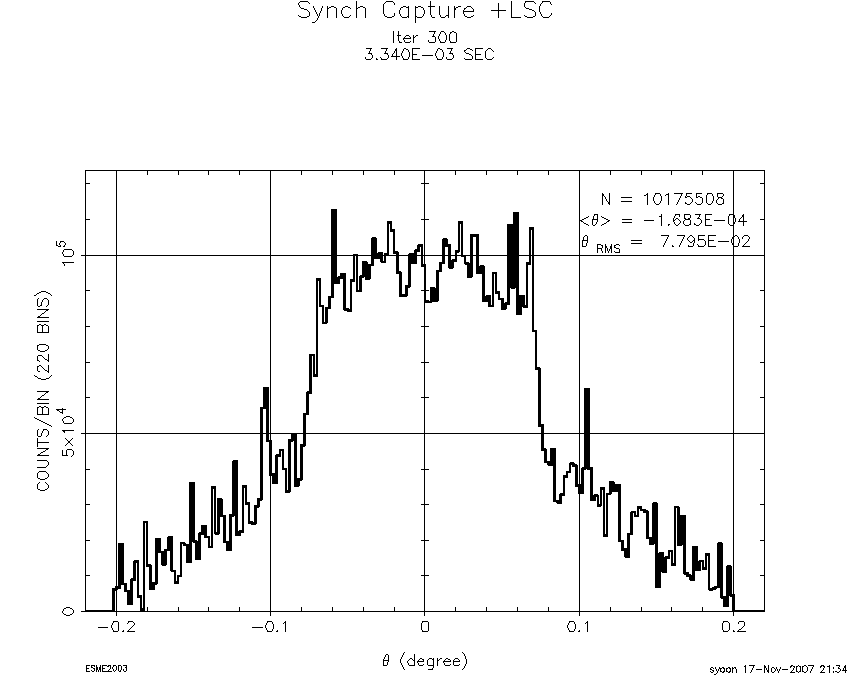
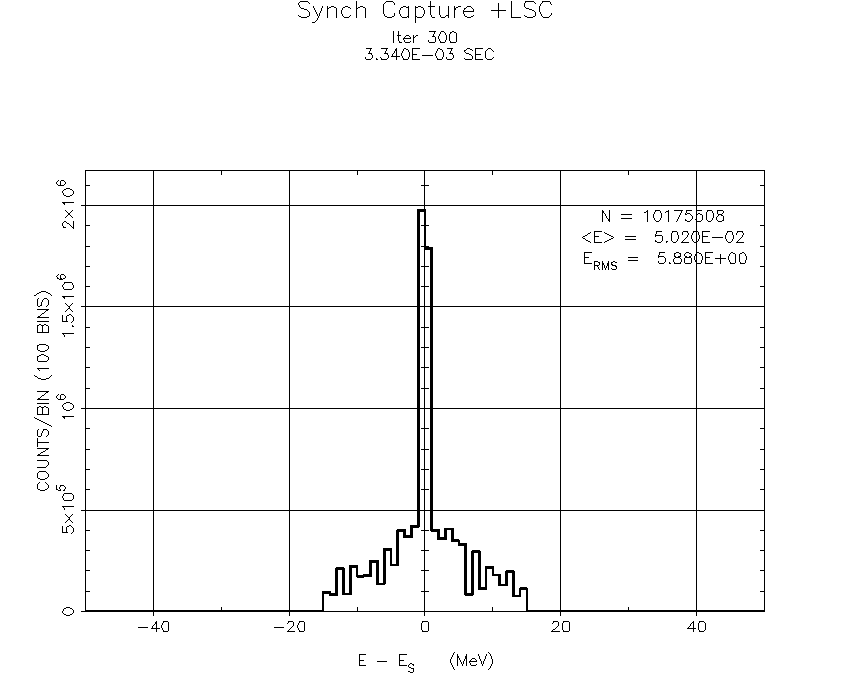
Having this amount of uncontrolled phase slips included, we simulated the SCRF linac-to-MI injection with ESME over 270 injection turns. During the 270 turns, longitudinal painting takes place at each turn within the MI RF bucket under the influence of longitudinal space charge, as illustrated by Figure 7. Shown in Figure 8 is one-peaked continuous distribution of charge density666 Charge density, or azimuthal density is referred to as charge line density (), for convenience. at the 270th turn. The turn-by-turn evolution of longitudinal emittance growth for the case of a single RF harmonic is shown in Figure 9(a). As the number of macro-particles increments, so does the longitudinal emittance up to about 0.08 (eV-s). Then, the emittance reaches its equilibrium and remains constant until the end of the simulation run. The induced voltage () arising from space-charge fields () is proportional to the g-factor, which is defined as . Thus, space-charge-induced voltage per turn can be computed at a specific turn from the charge distribution. In particular, we looked at the induced voltage arising from the symmetric charge distribution at the end of injection (at the 270th turn), as shown in Figure 9(c):
| (8) |
where , , , , , and denote effective beam pipe radius, effective beam radius, relativistic and , line density, and longitudinal path length, respectively. In the case of the Main Injector at an injection energy of 8.0 (GeV), the value of g-factor is 5.64:
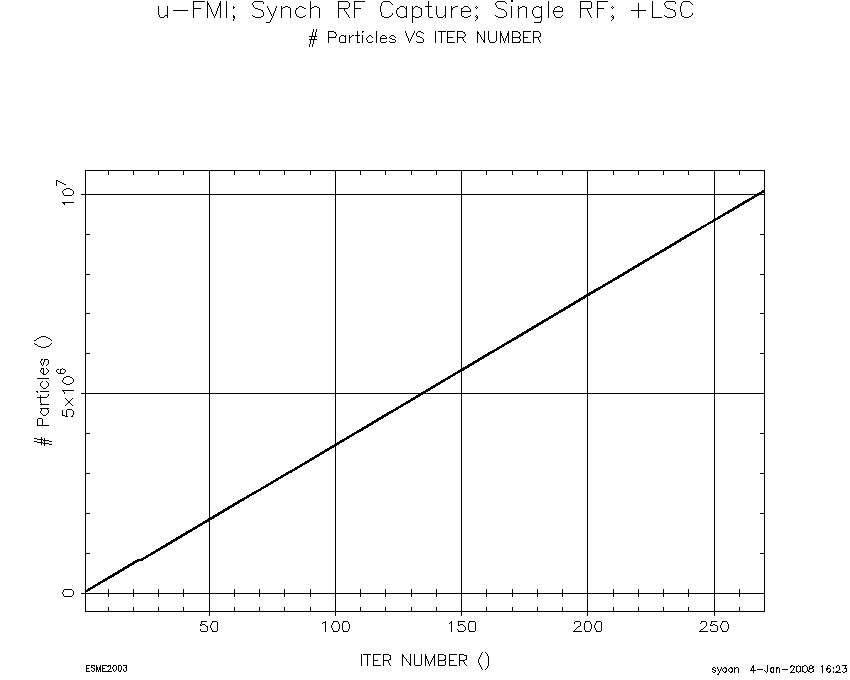
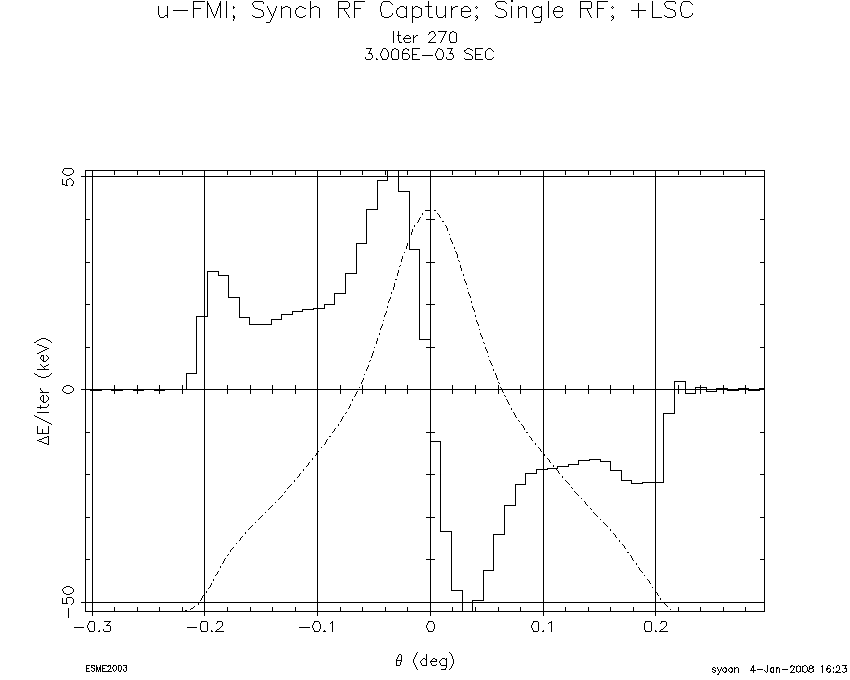
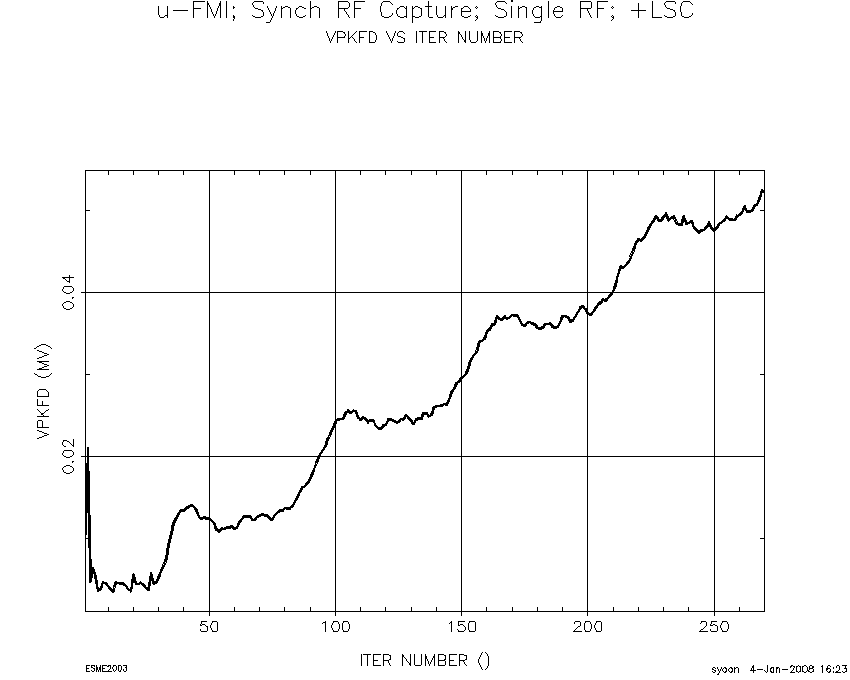
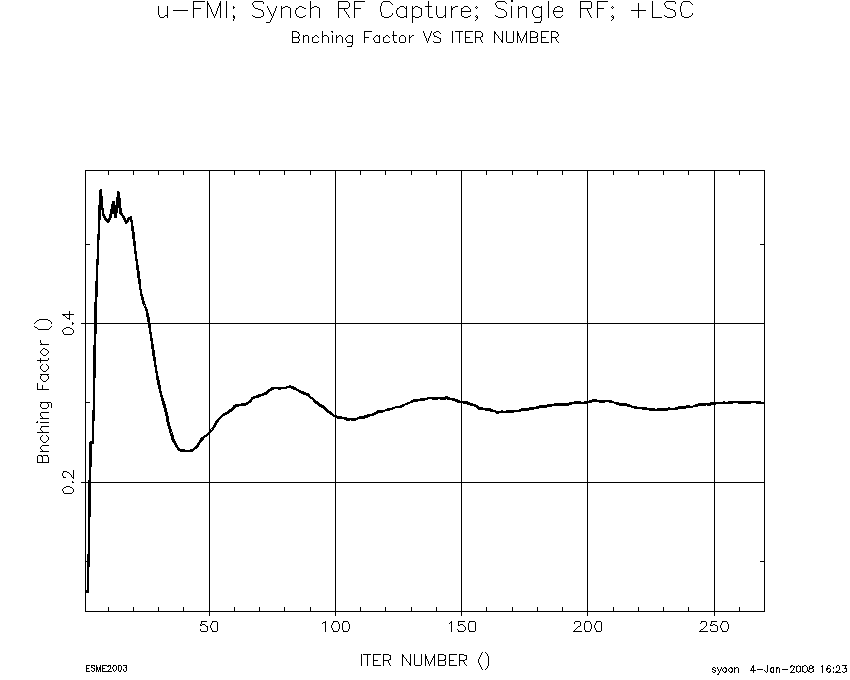
Drawn in Figure 9(d) is the peak collective voltage in frequency domain () computed at each turn. The collective voltage goes up to about 50.0 (keV) at the end of the injection process. Since the bunching factor is usually defined as average current () over peak current () for convenience, its value is upper-bounded at unity. Figure 9(e) shows that the bunching factor converges to the value of about 0.3 for the case of Scenario I.
3 Scenario II
In Scenario II, the injection process described in Scenario I is followed by RF-voltage ramping linearly up to 150 of the initial value. Thus, the RF voltage ramping lasts for additional 27 (ms), and the total injection time elapses about 30 (ms).
{Bitemize}[t] = 800 (kV), = 1,200 (kV) ramping RF voltage after the injection is complete
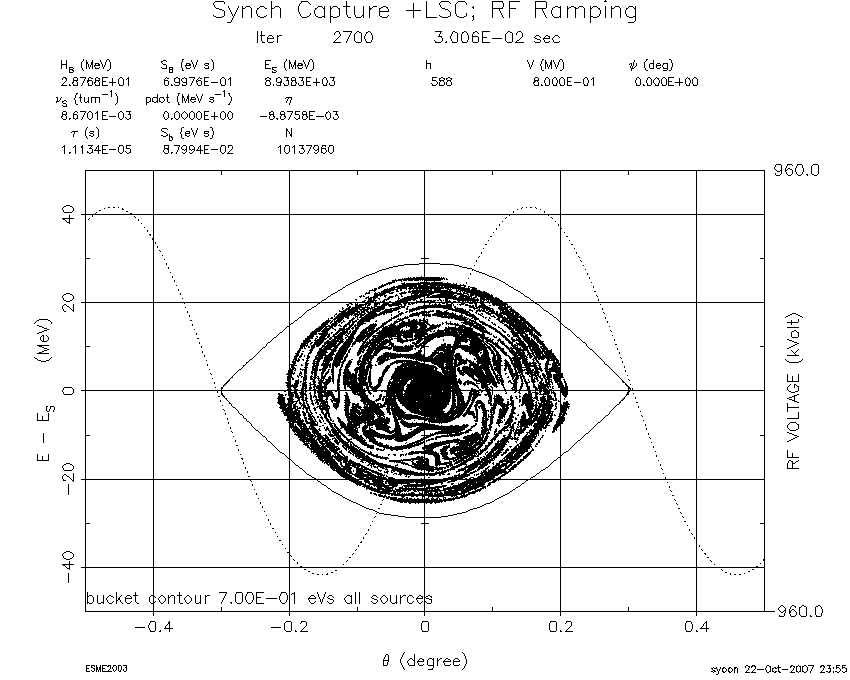
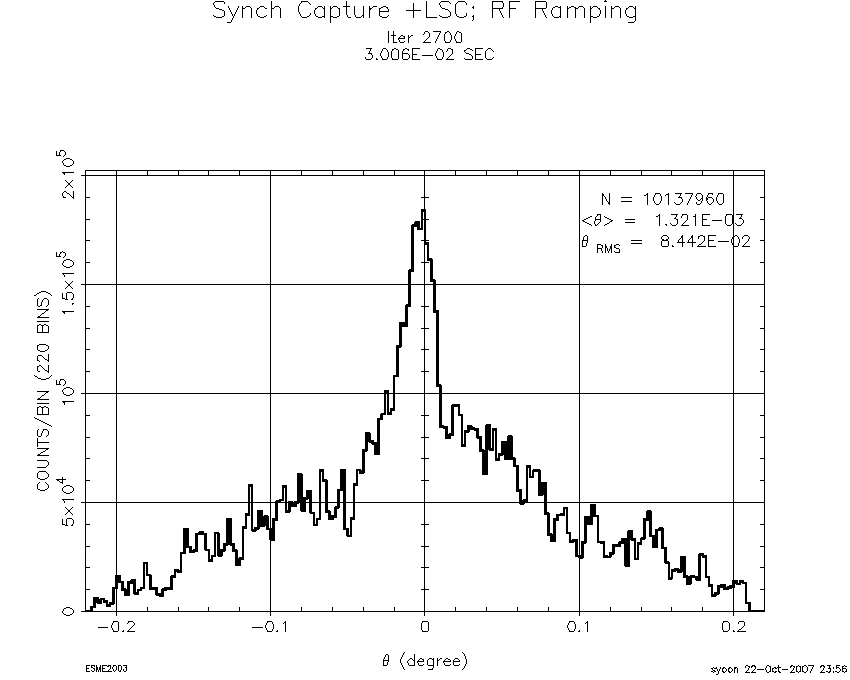
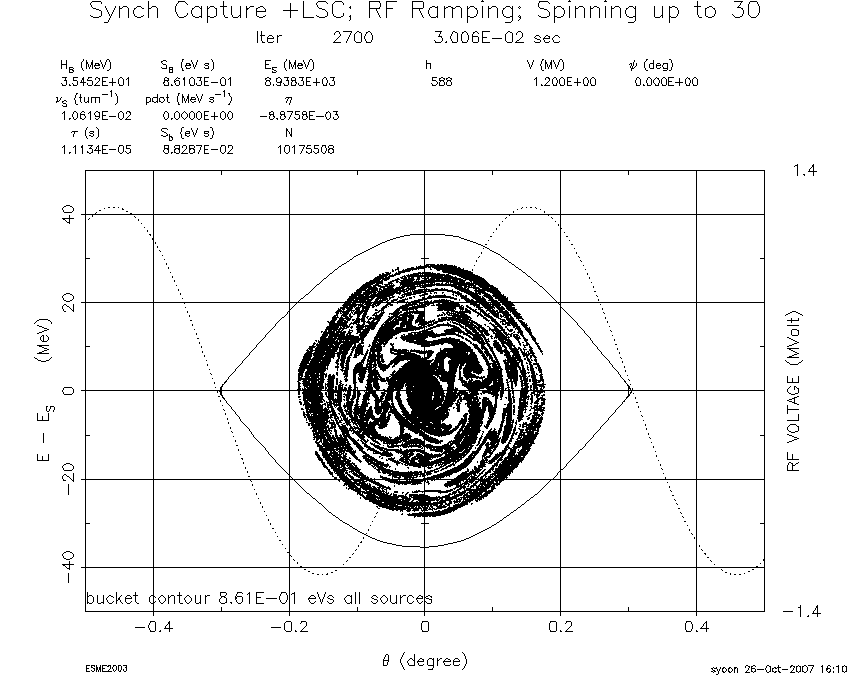
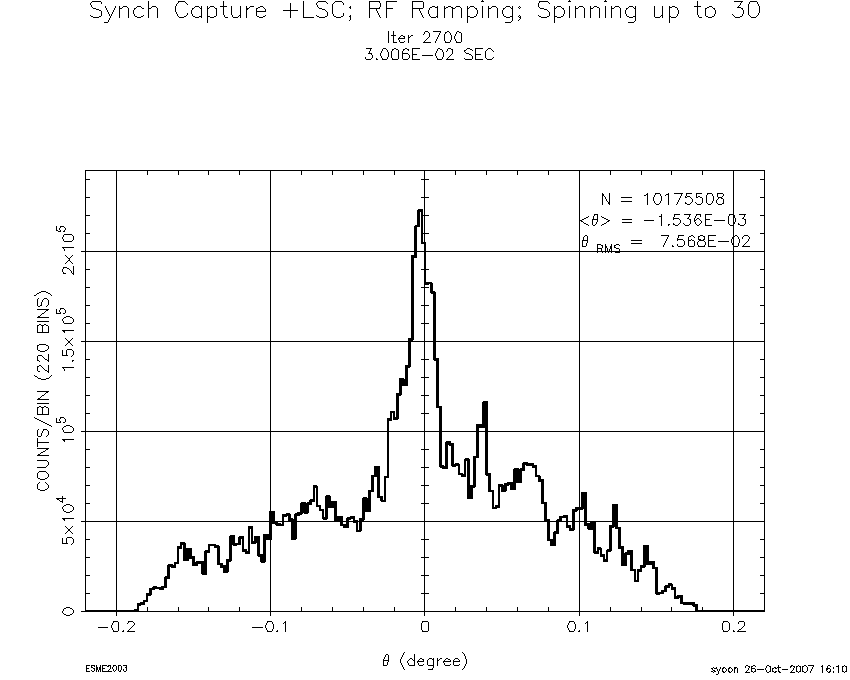
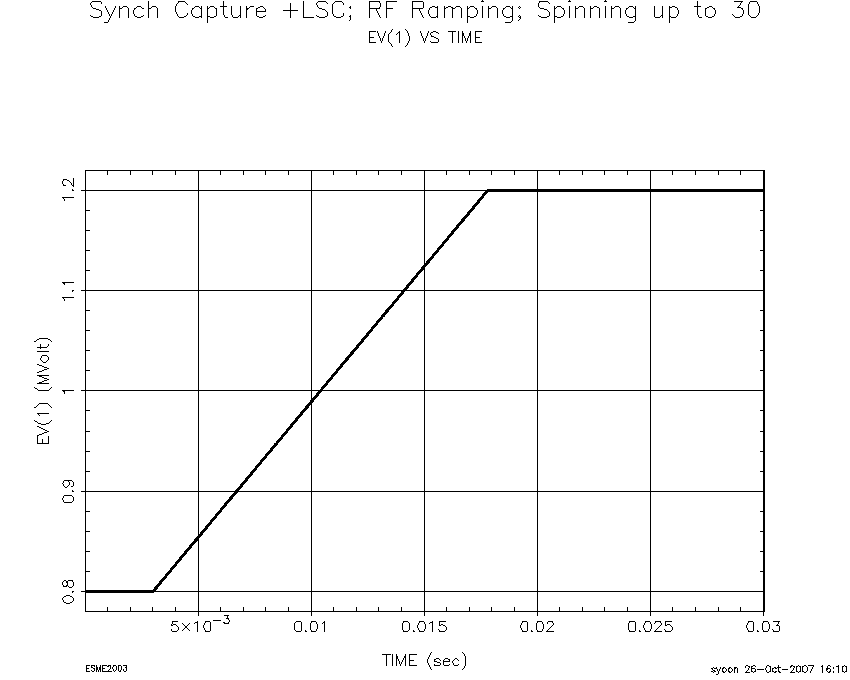
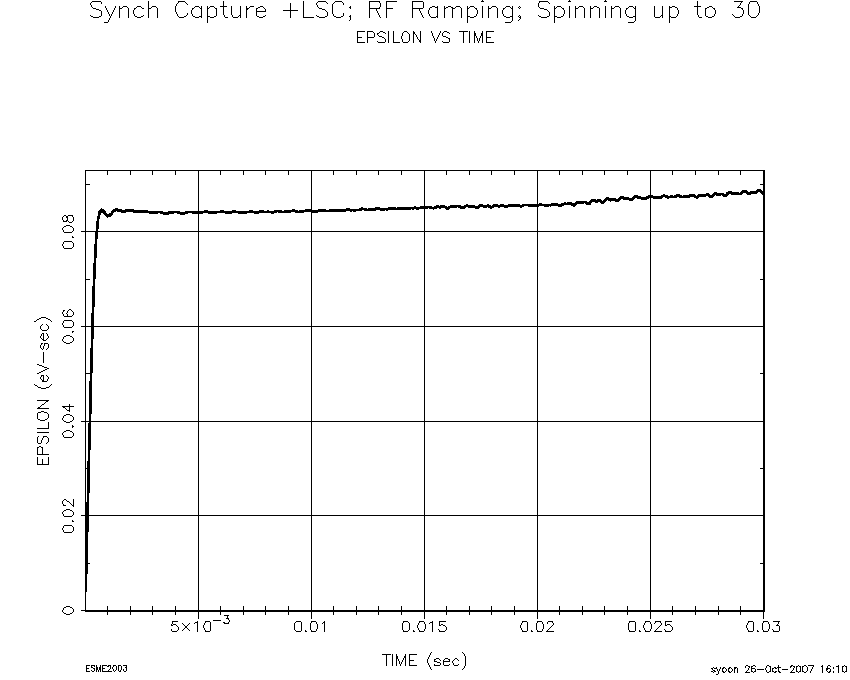
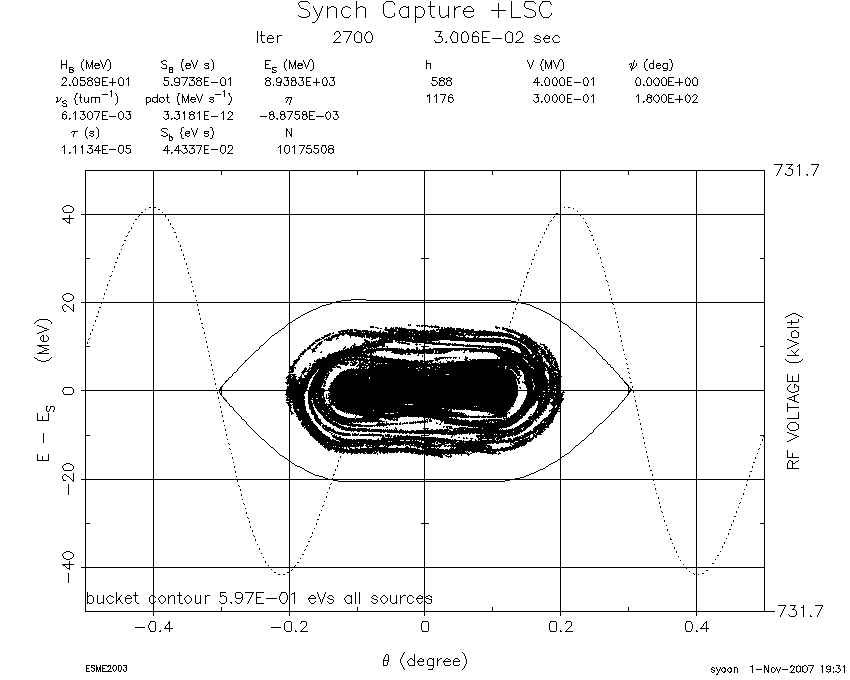
At the end of RF-voltage ramping, the entire macro-particles are well captured within an enlarged RF bucket as depicted in Figure 10. With RF-voltage ramping, the bucket area is enlarged, such that beam loss arising from space-charge effect can be avoided. Figure 12 shows the variation of RF voltage from 800 (kV) to 1,200 (kV) during the interval from the 270th turn through the 2,700th turn. In comparison to Figure 8 from Scenario I, the gradient of charge distribution () are reduced and spread more out with ramping RF voltage over extended 2,700 turns (cf. Figure 11). Yet, a peaked distribution centered around the origin is observed. The longitudinal emittance () grows up to 0.085 (eV-s) with a fixed RF voltage at 800 (kV). Once the RF voltage starts ramping linearly, the emittance continues to grow gradually up to 0.09 (eV-s) as plotted in Figure 13.
In an attempt to further reduce the space-charge-induced voltage and to attain a more uniform charge distribution, a dual RF harmonic system is explored in Scenarios III and IV in the following subsections.
4 Scenario III
{Bitemize}[t]Dual RF Harmonics:
= 53 MHz and = 106 MHz
and
= = 2.0
and
(fixed RF voltages)
= = 0.75
In Scenario III, we explored a scheme of injecting micro-bunches into an MI RF bucket with dual RF harmonics of 400 (kV) on 53 (MHz) and 300 (kV) on 106 (MHz). The higher-order RF harmonic () is as double as the principal RF harmonic (). The secondary RF voltage () is 75 of the principal RF voltage (). The RF voltage waveform of the higher harmonic for dual RF harmonics can be obtained on the basis of Eqn. (9):
| (9) |
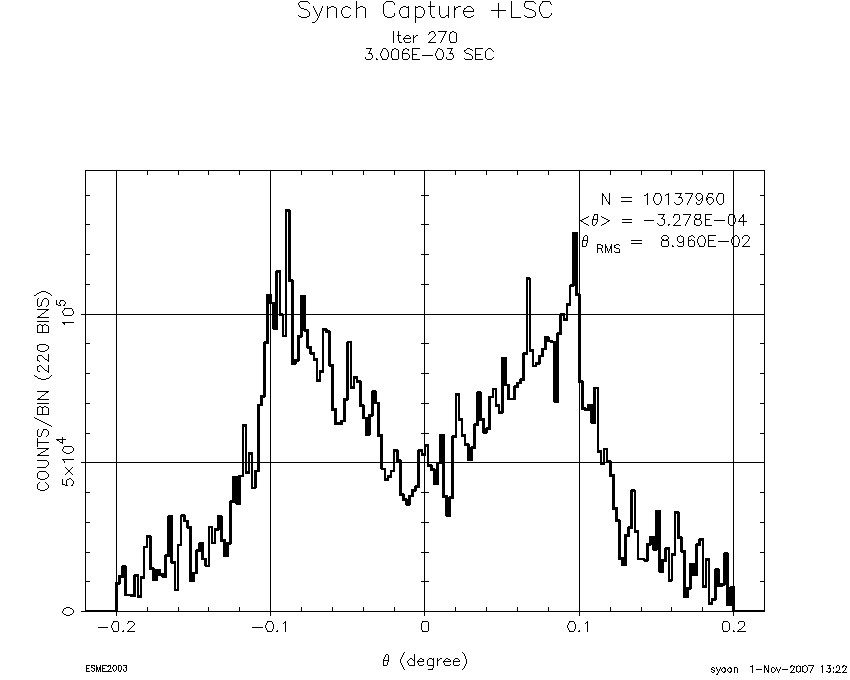
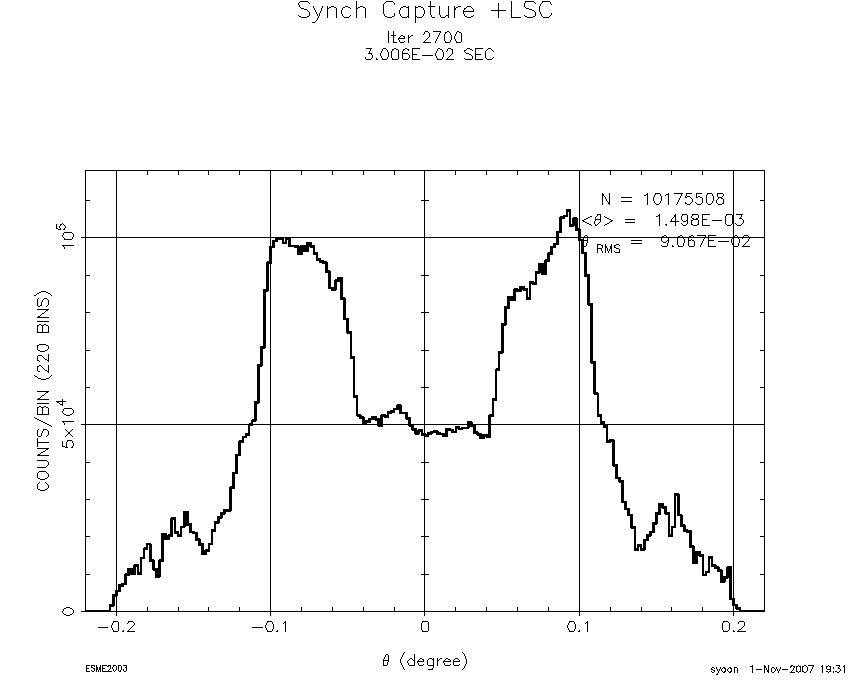
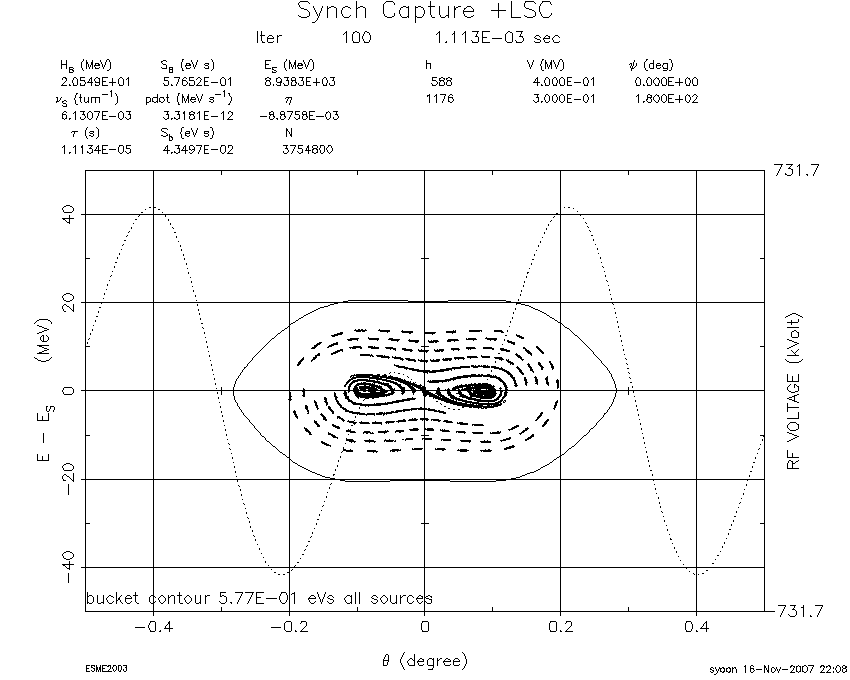
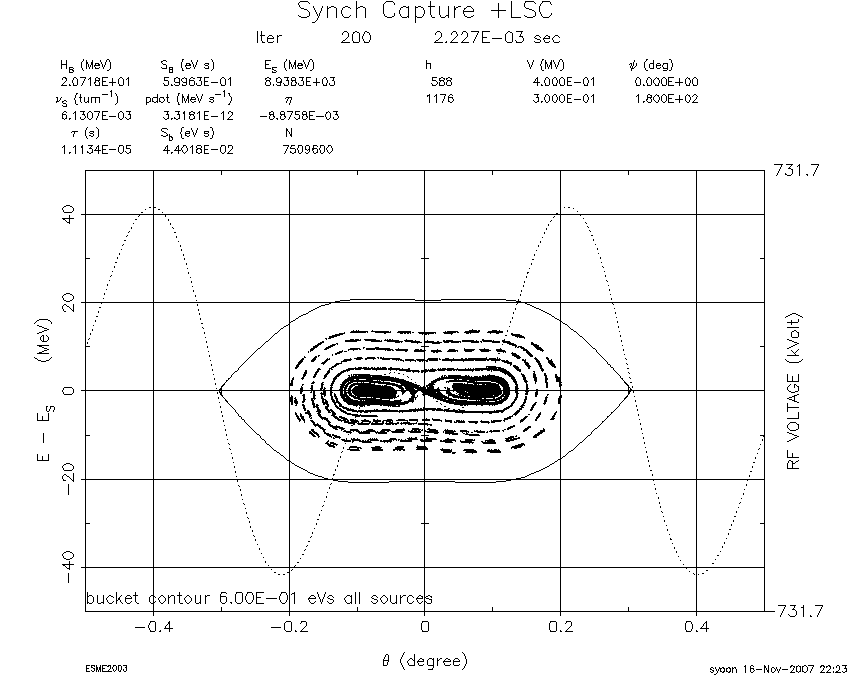
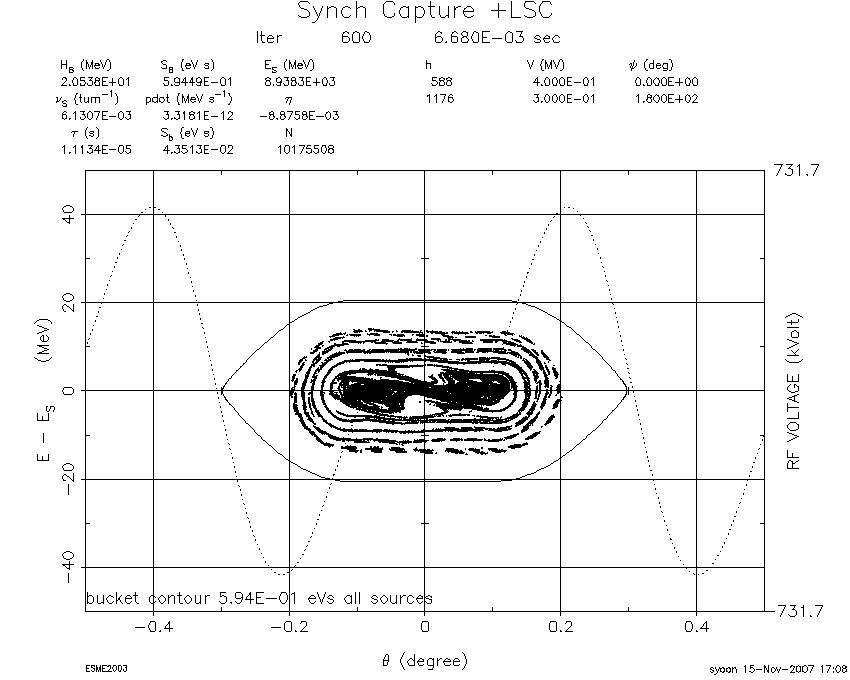
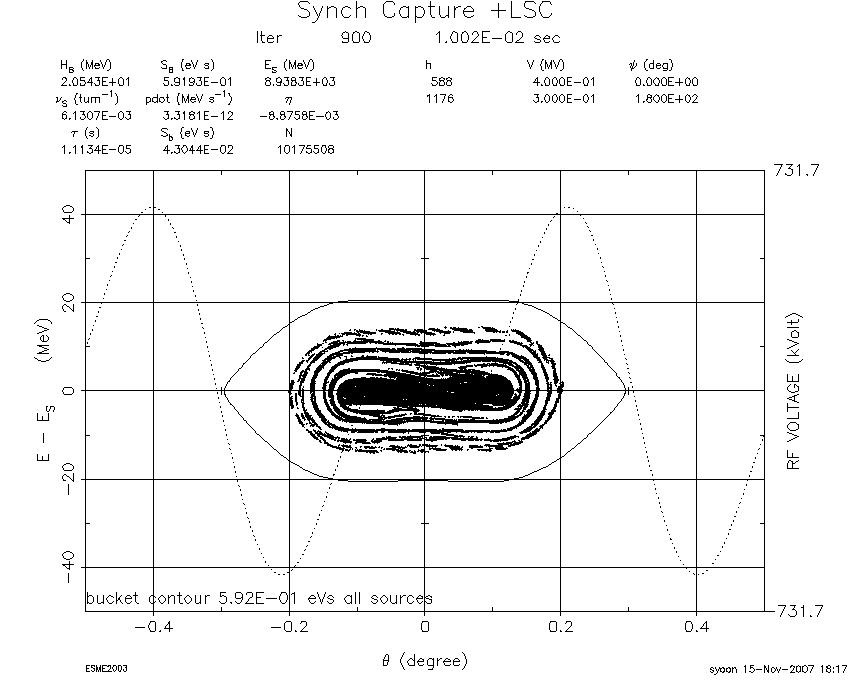
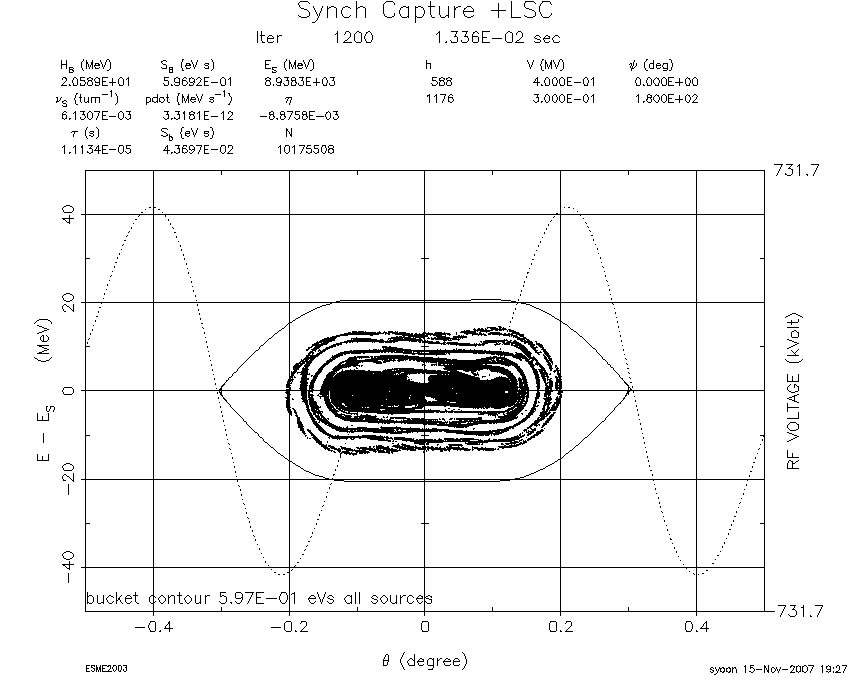
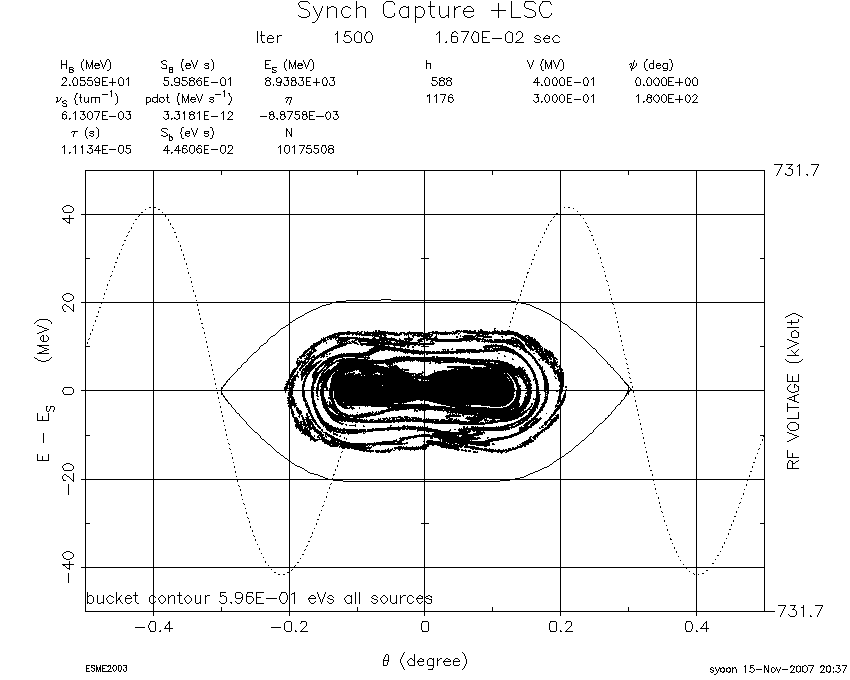
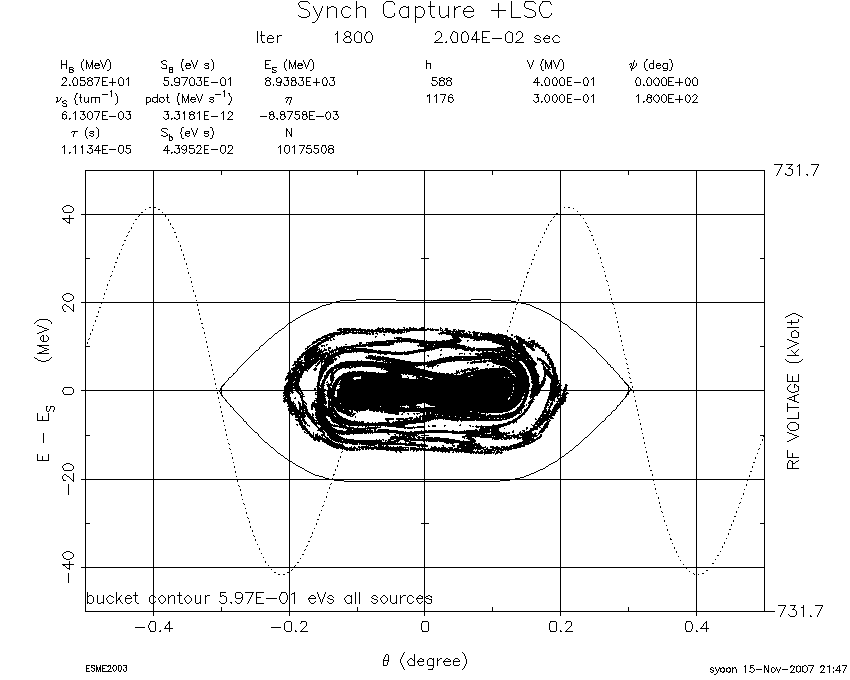
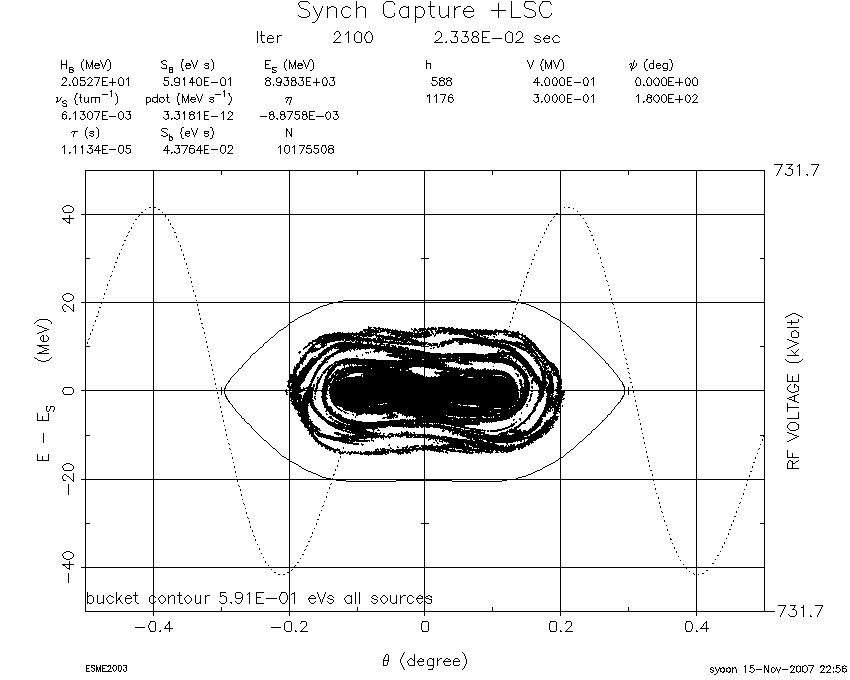
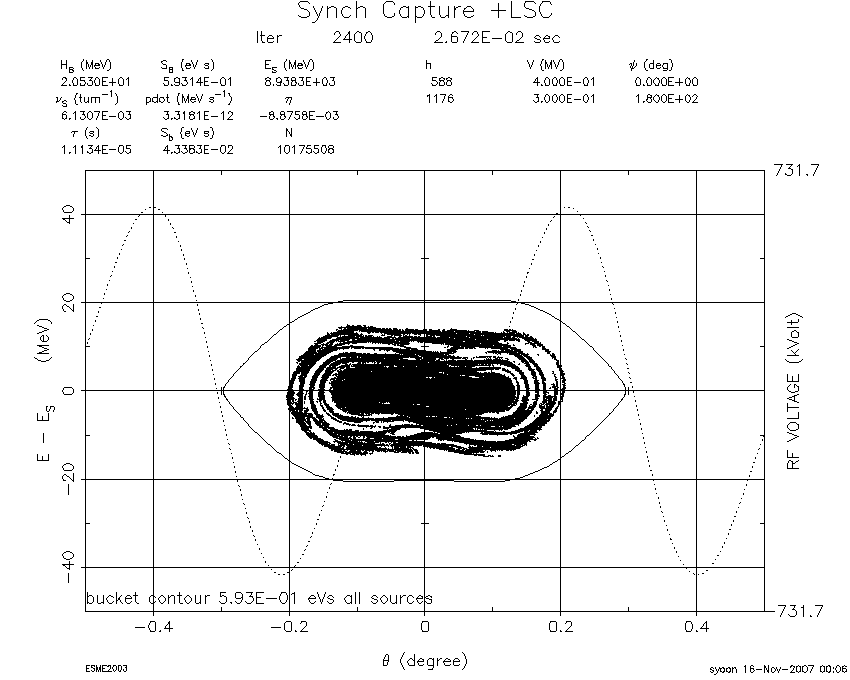
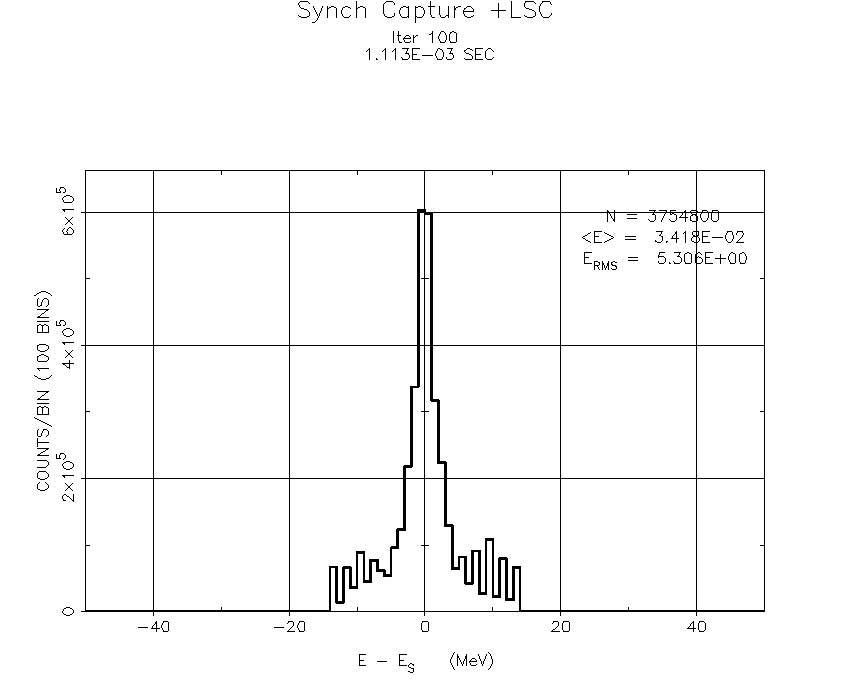
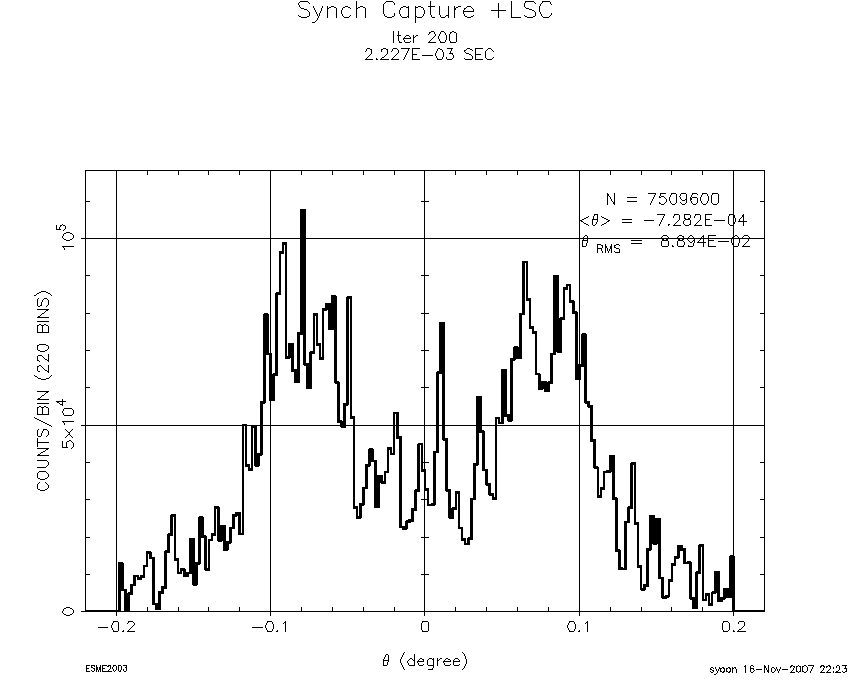
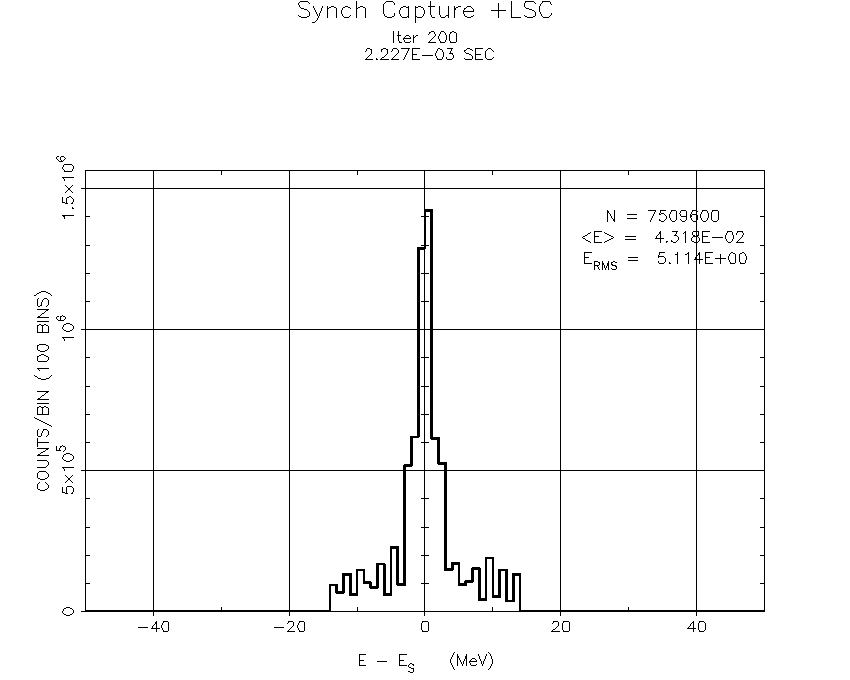
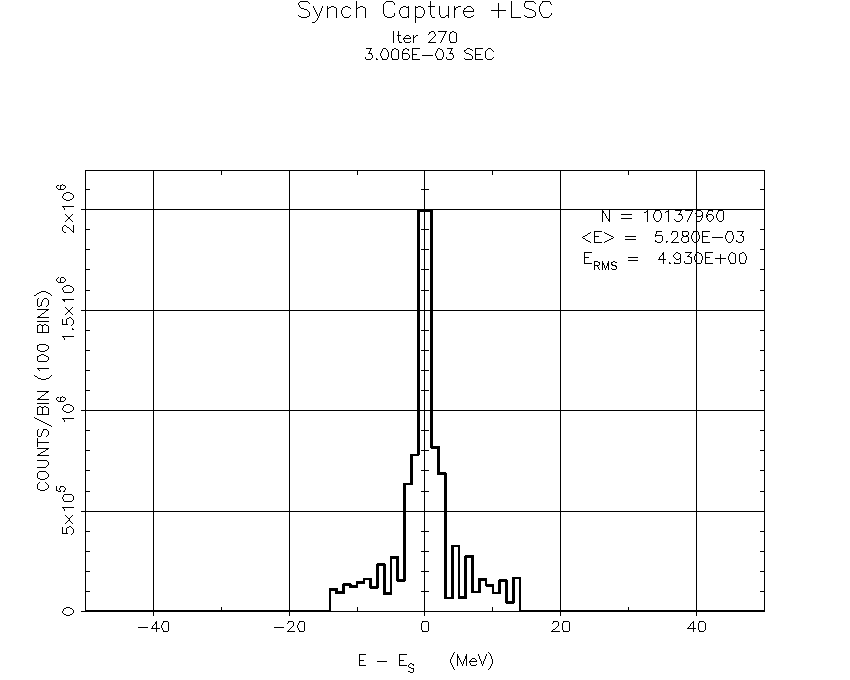
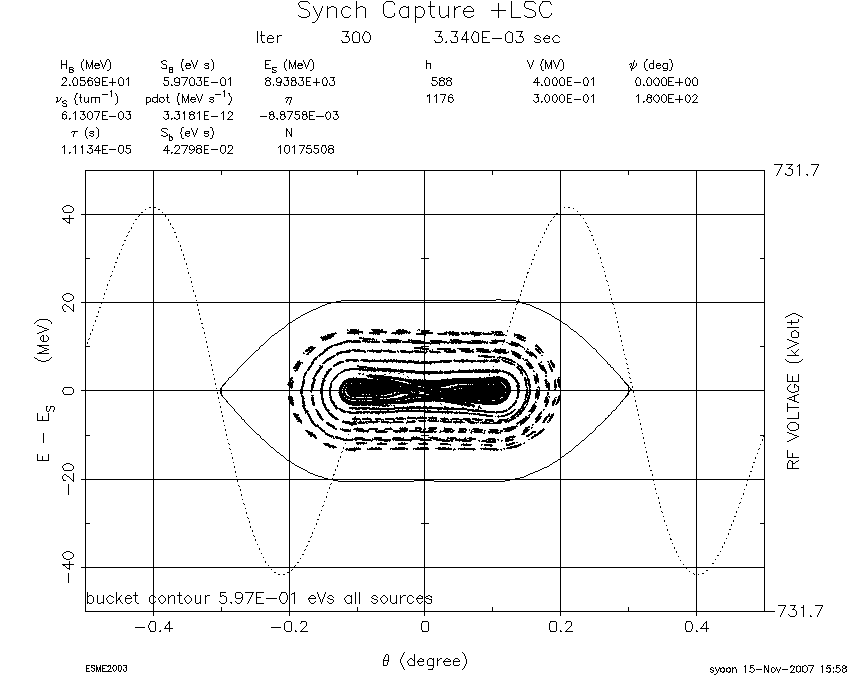
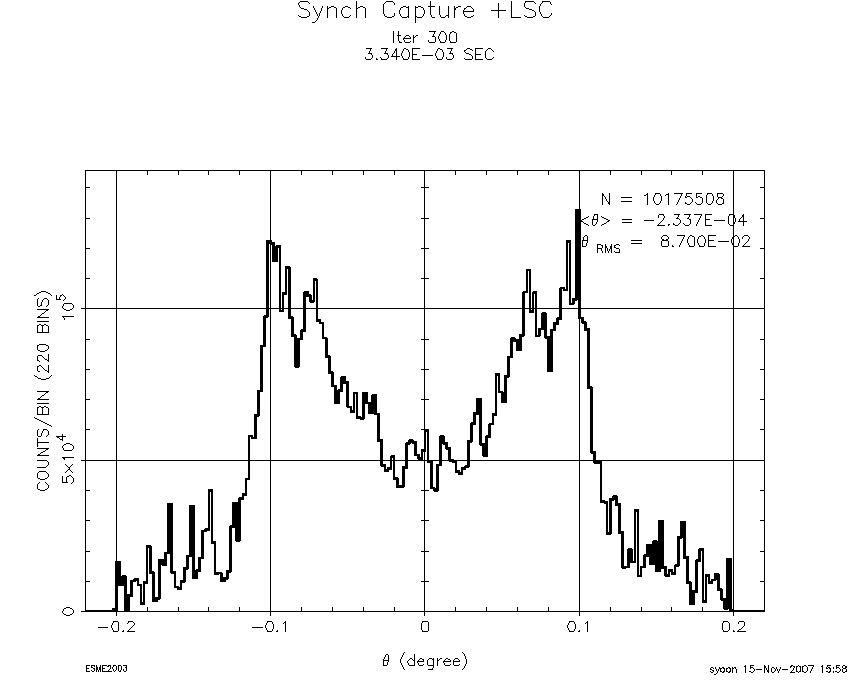
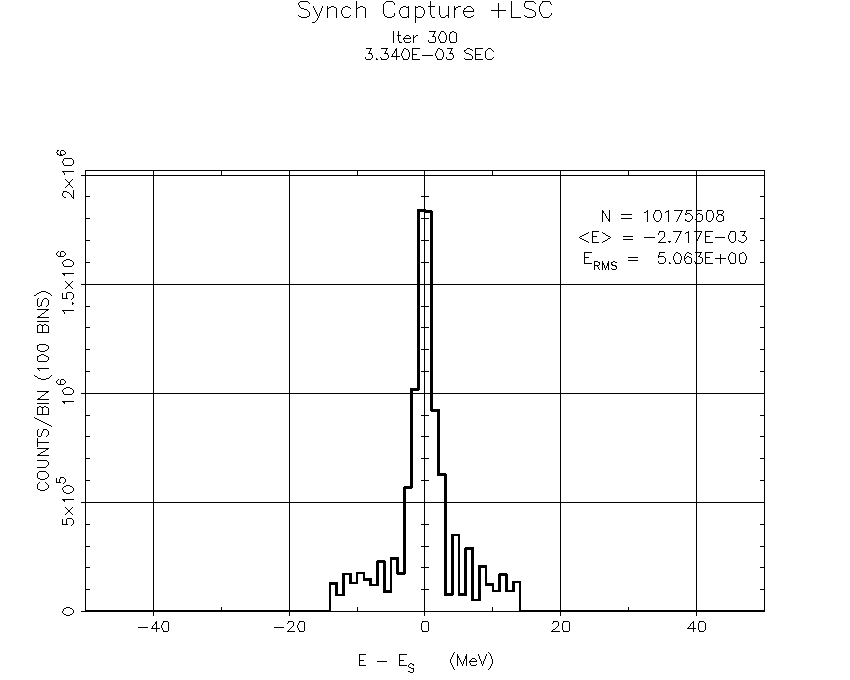
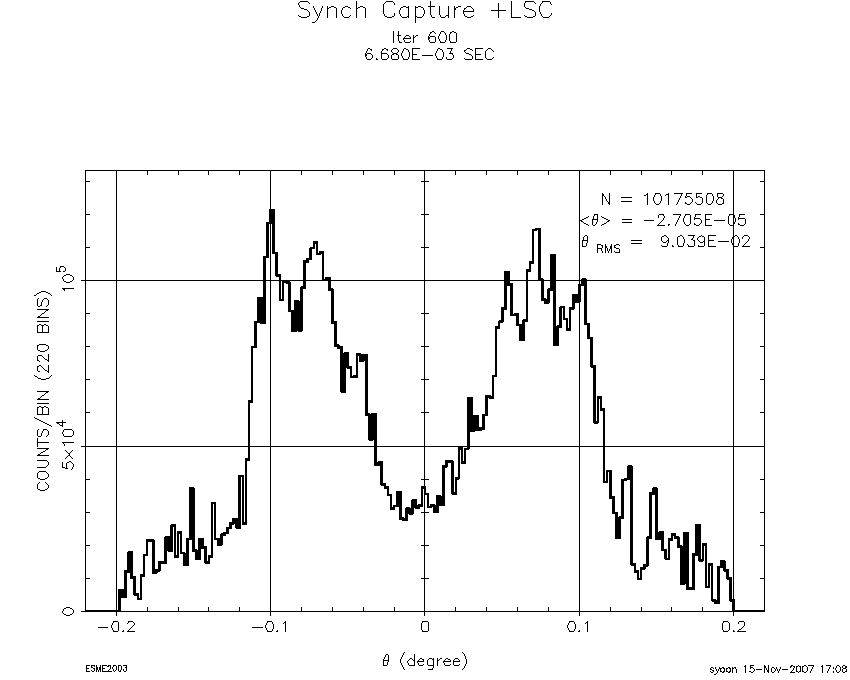
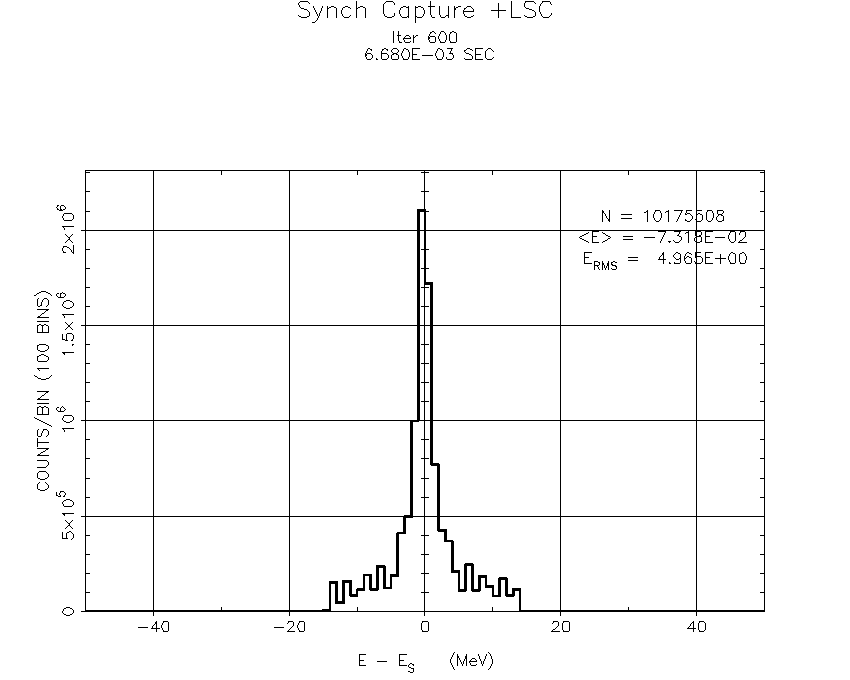
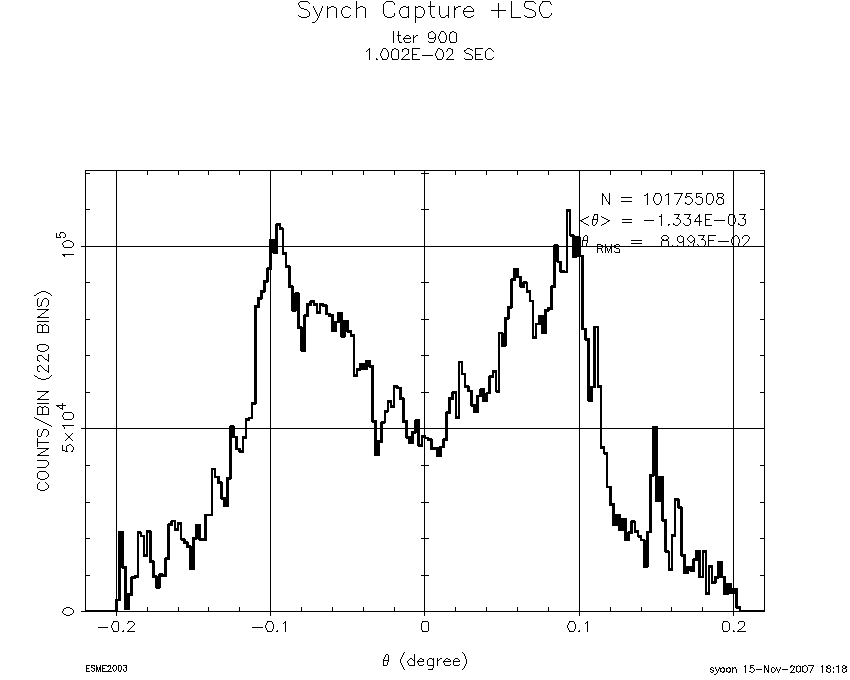
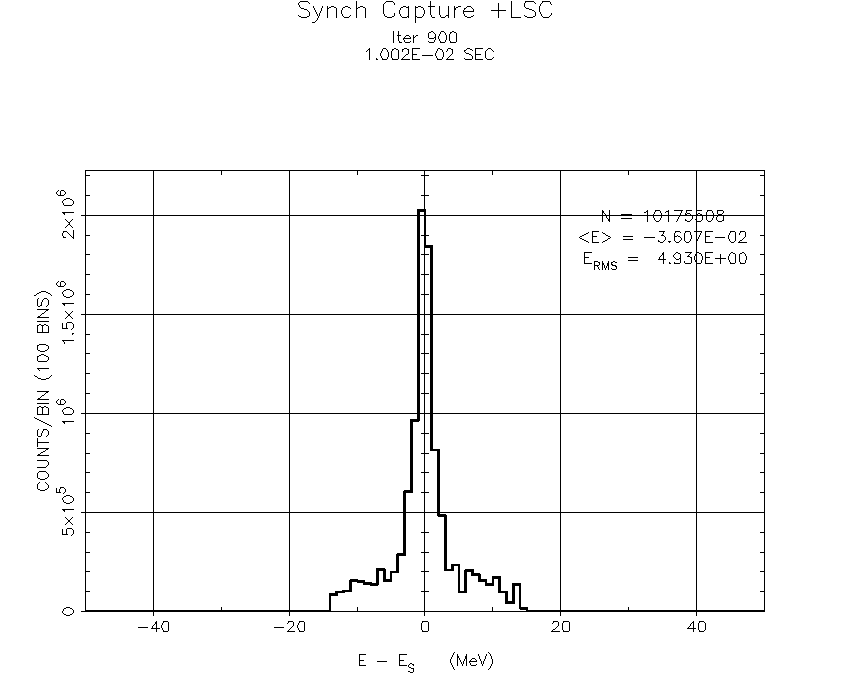
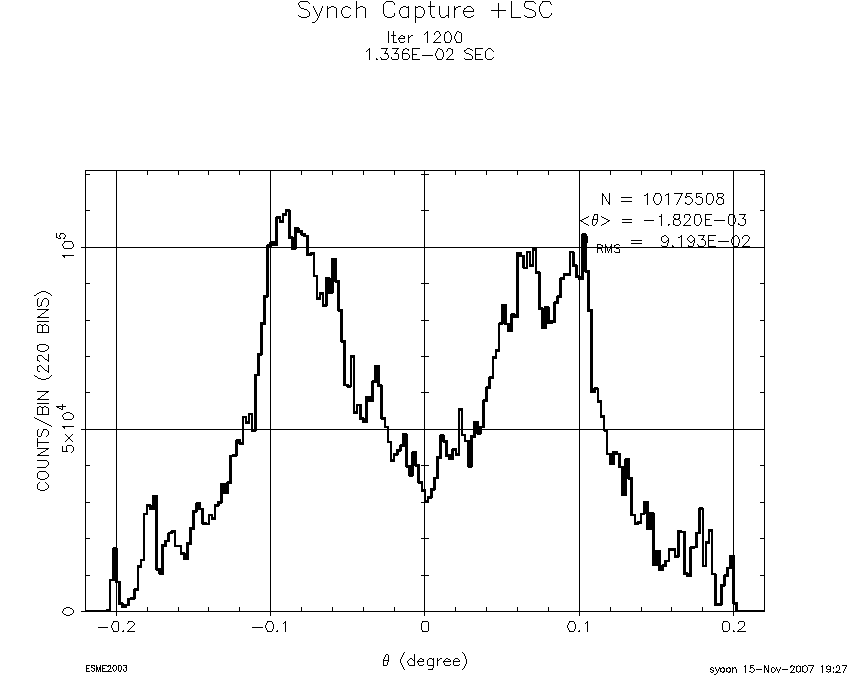
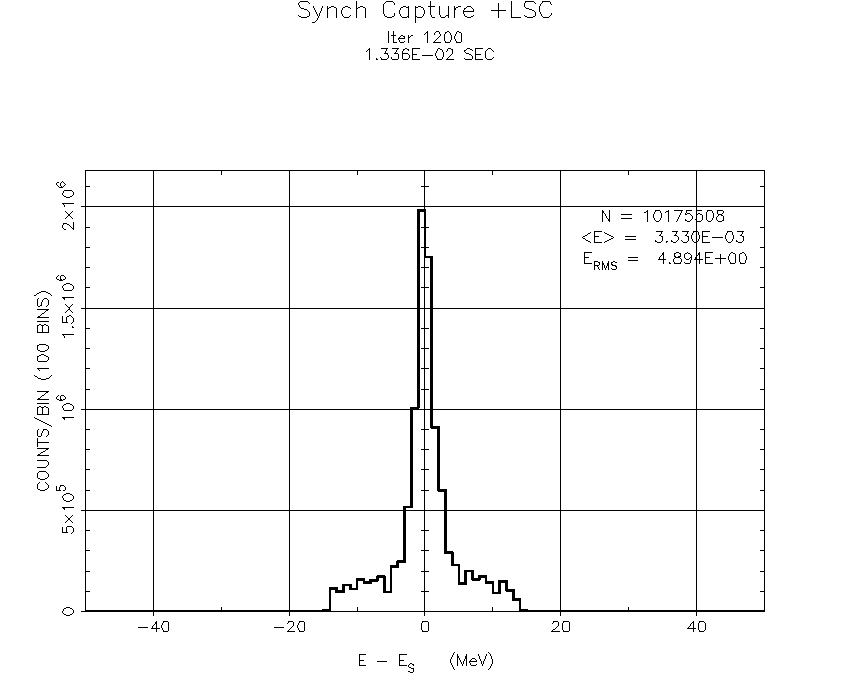
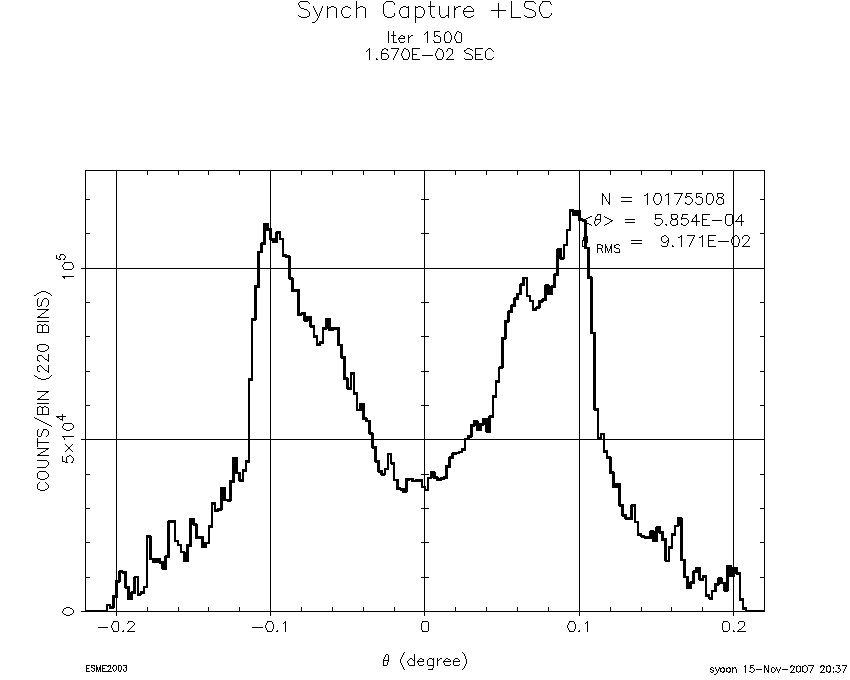
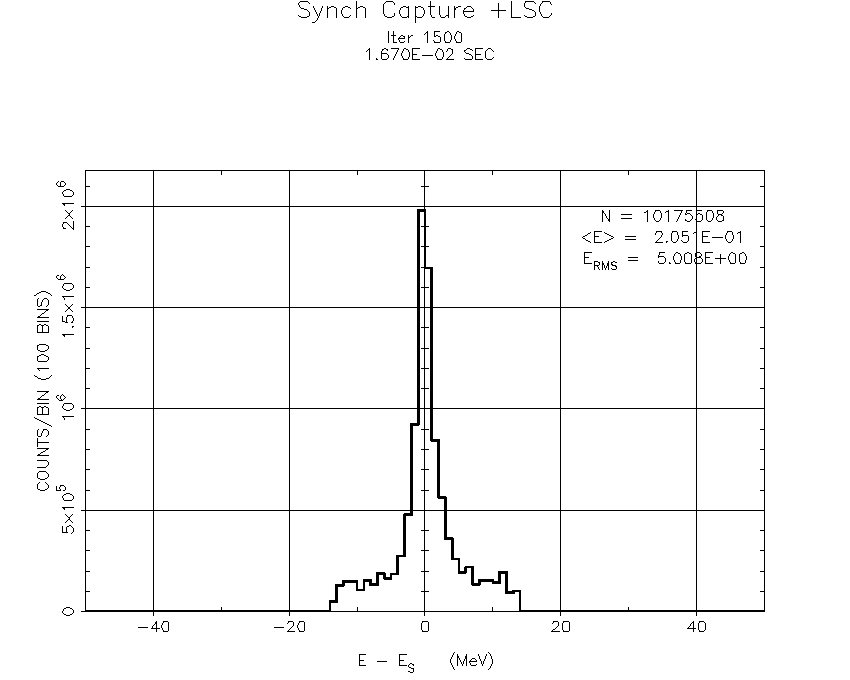
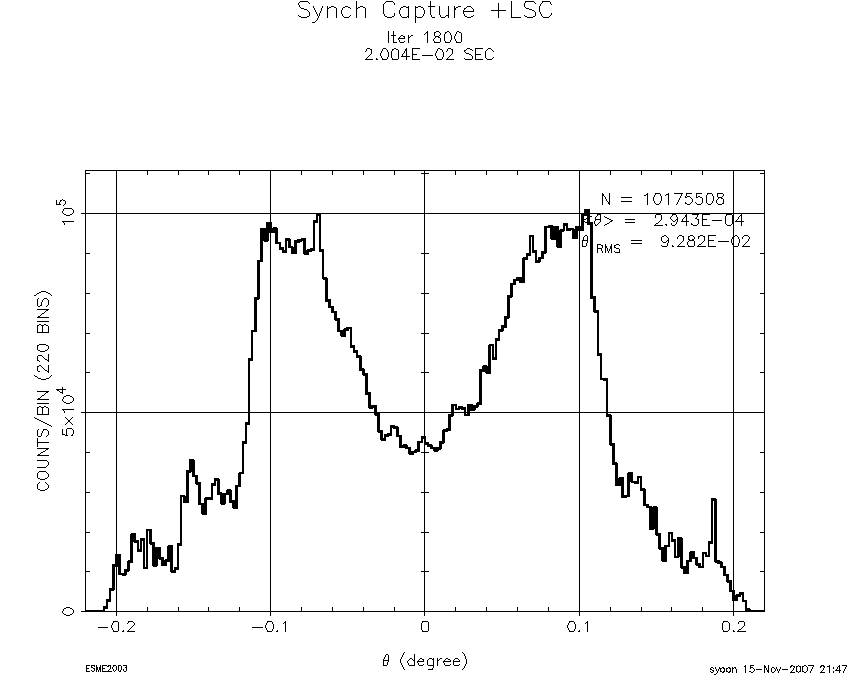
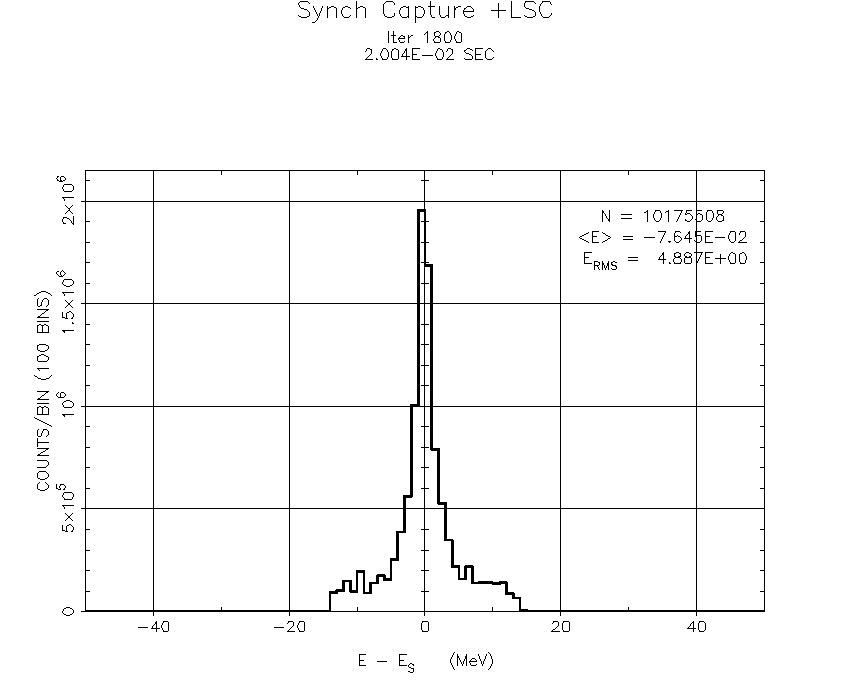
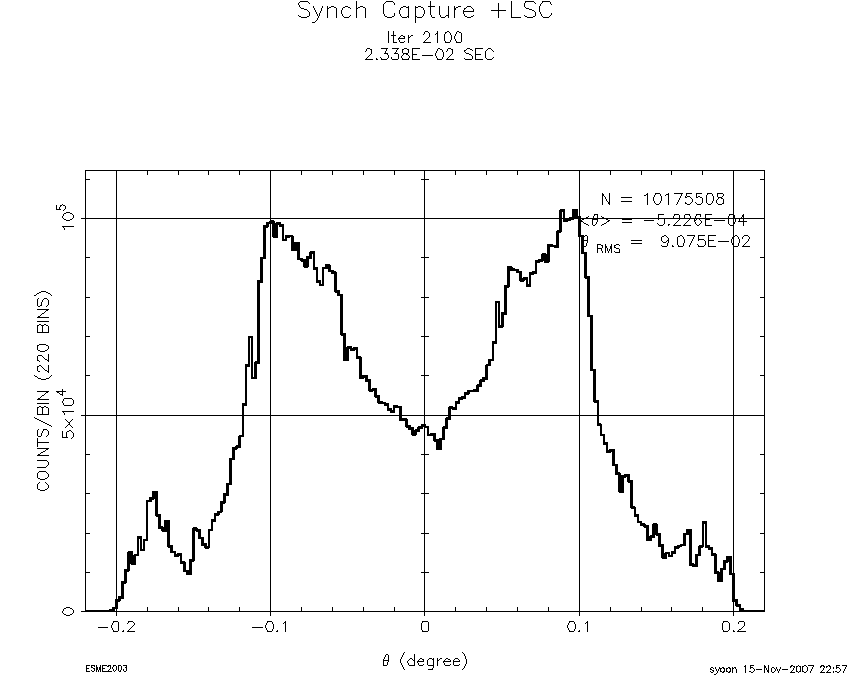
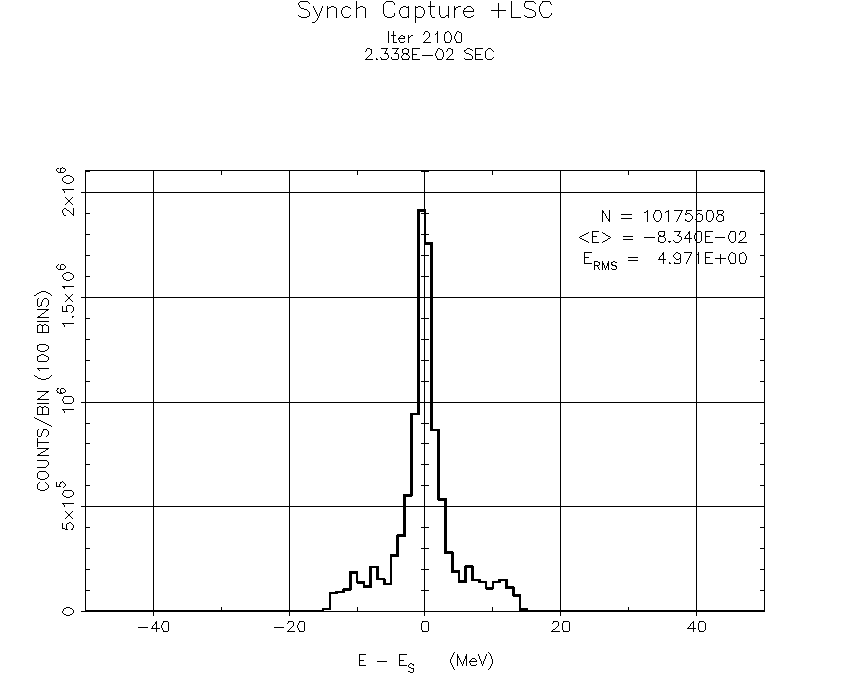
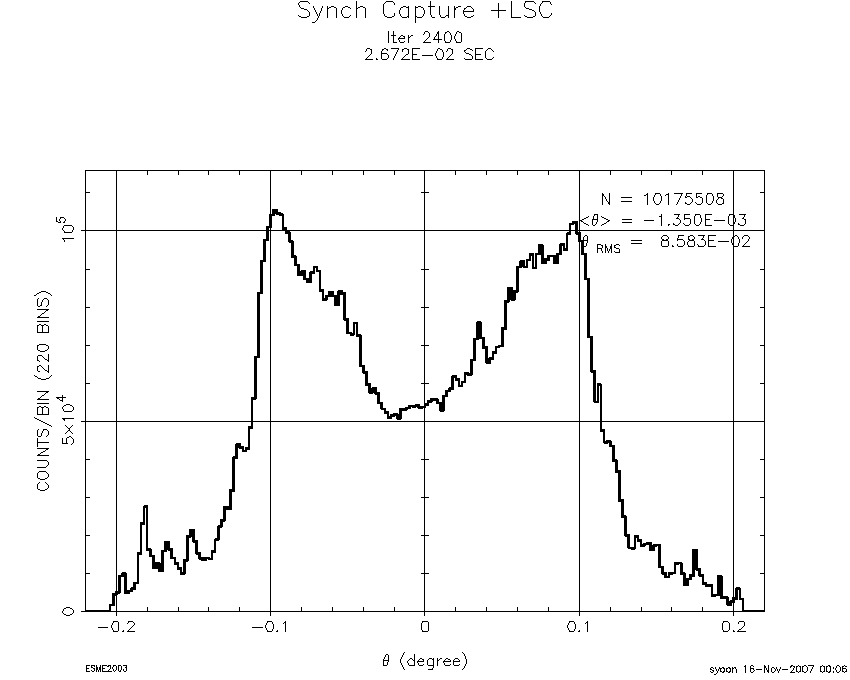
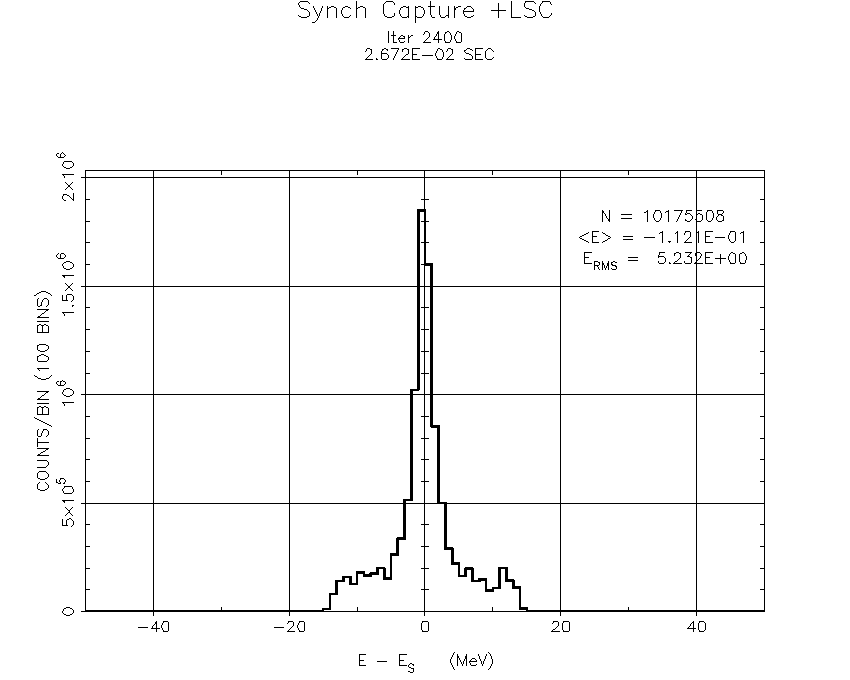
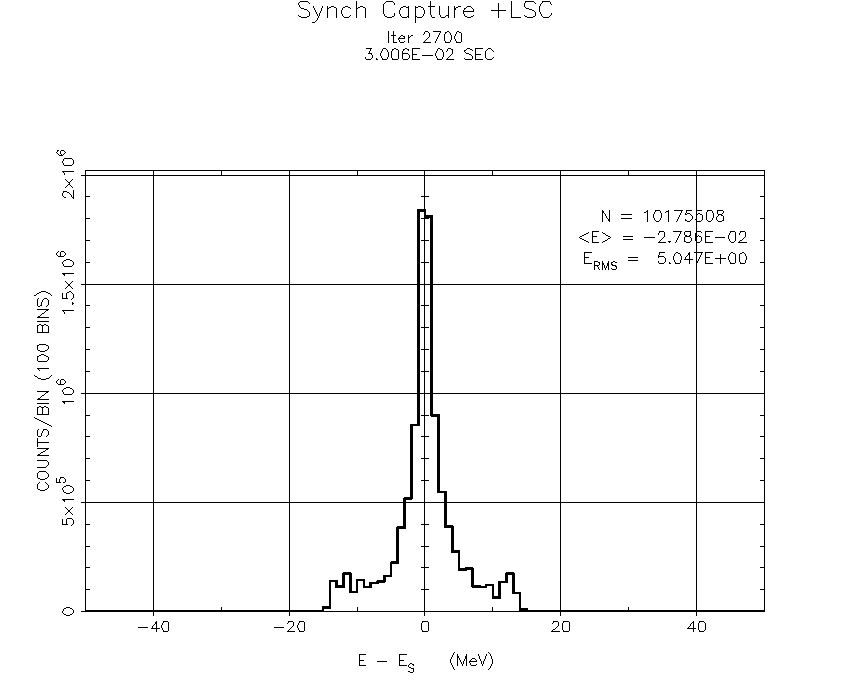
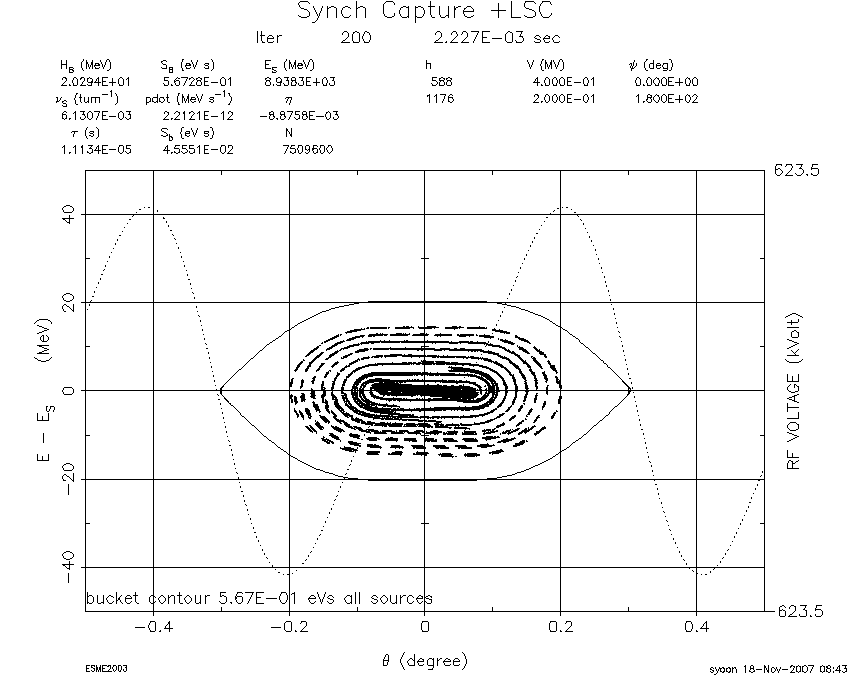
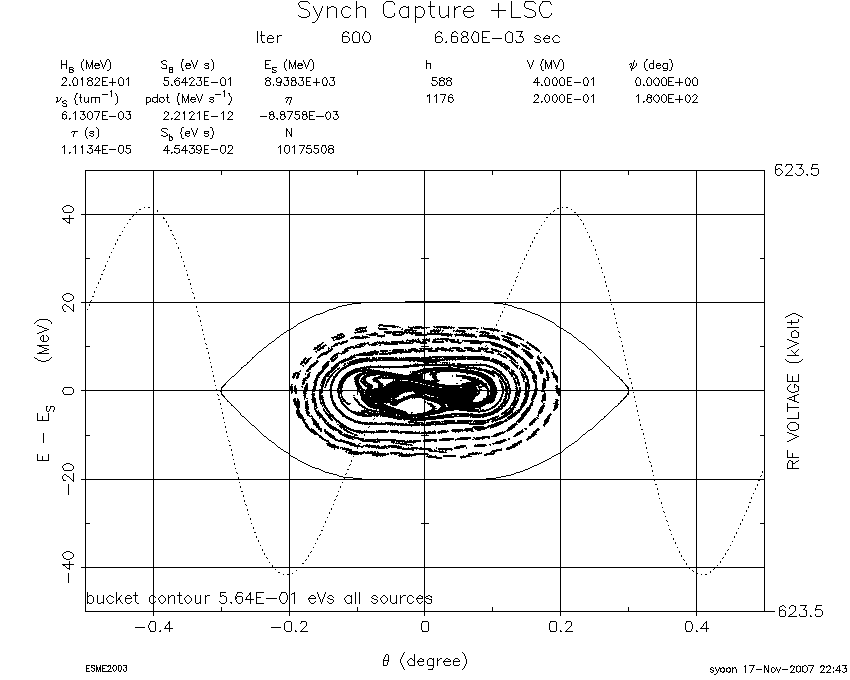
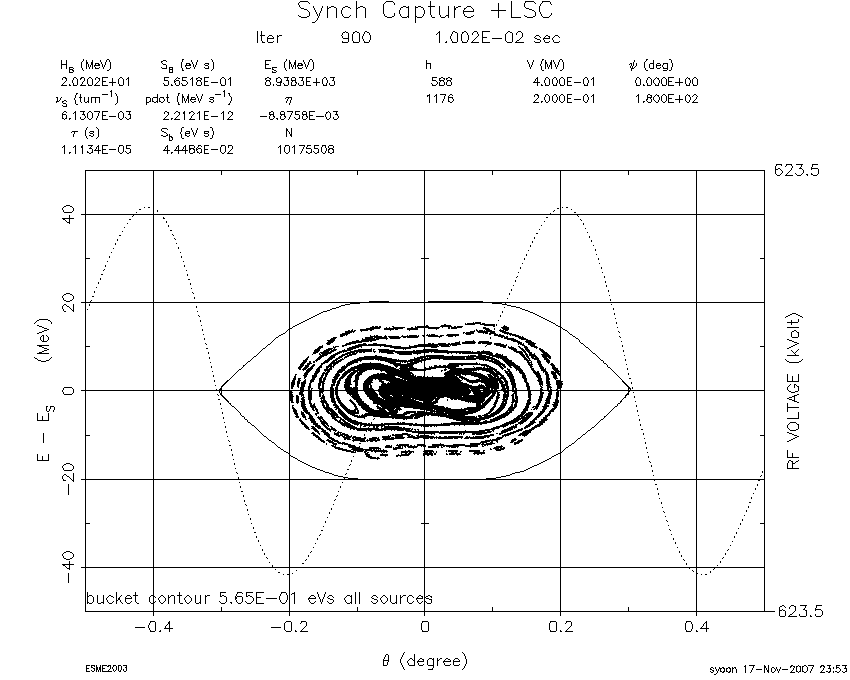
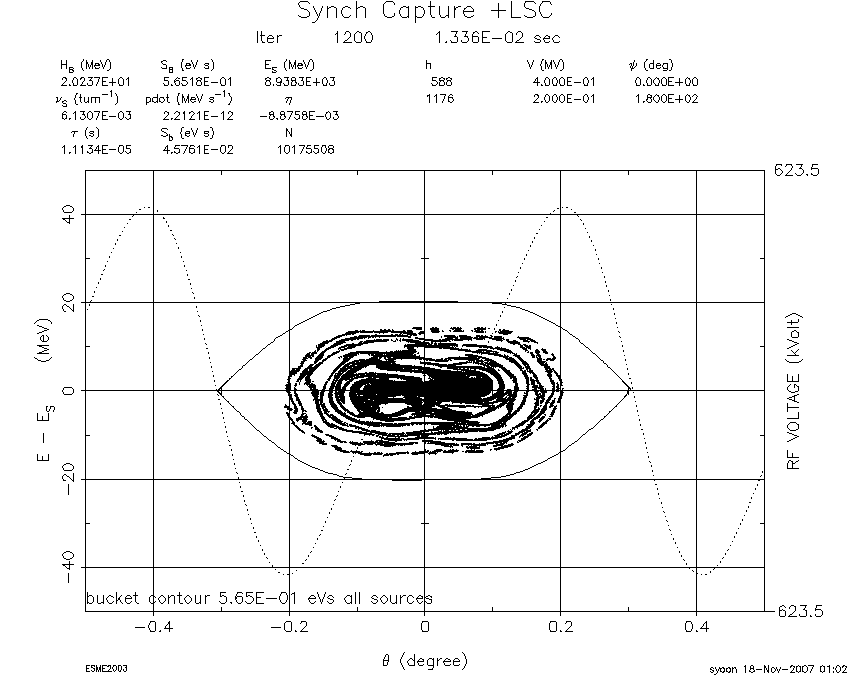
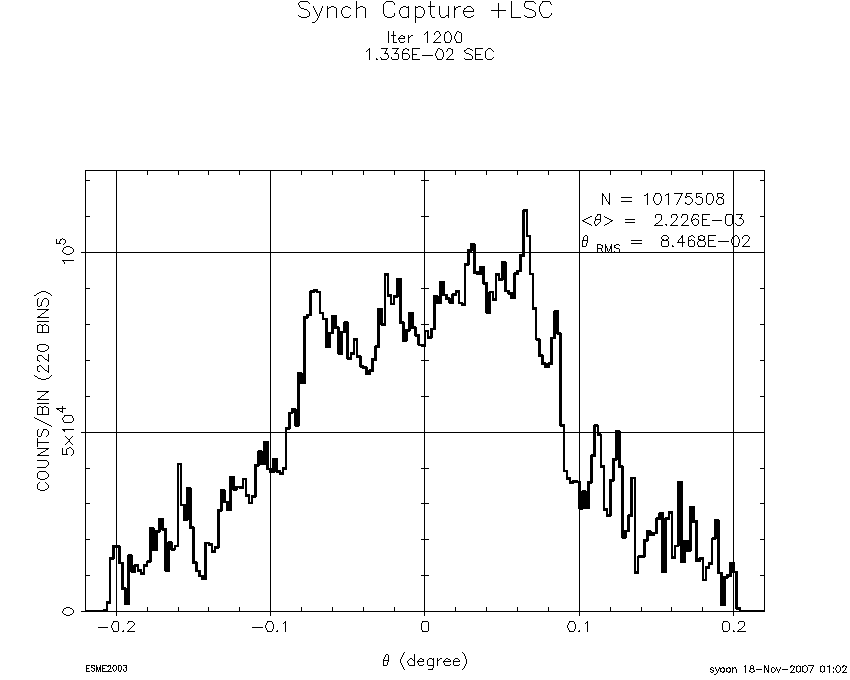
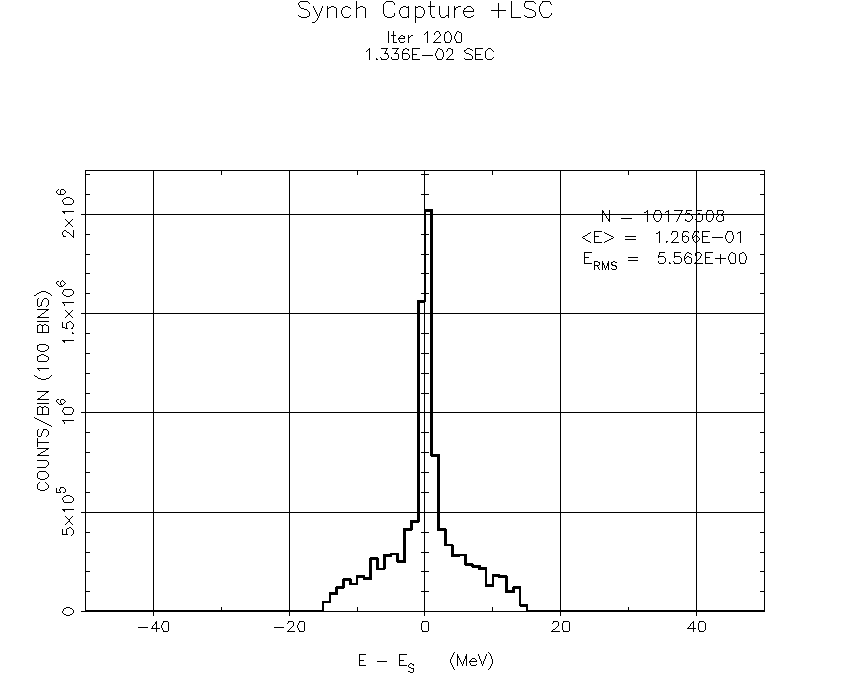
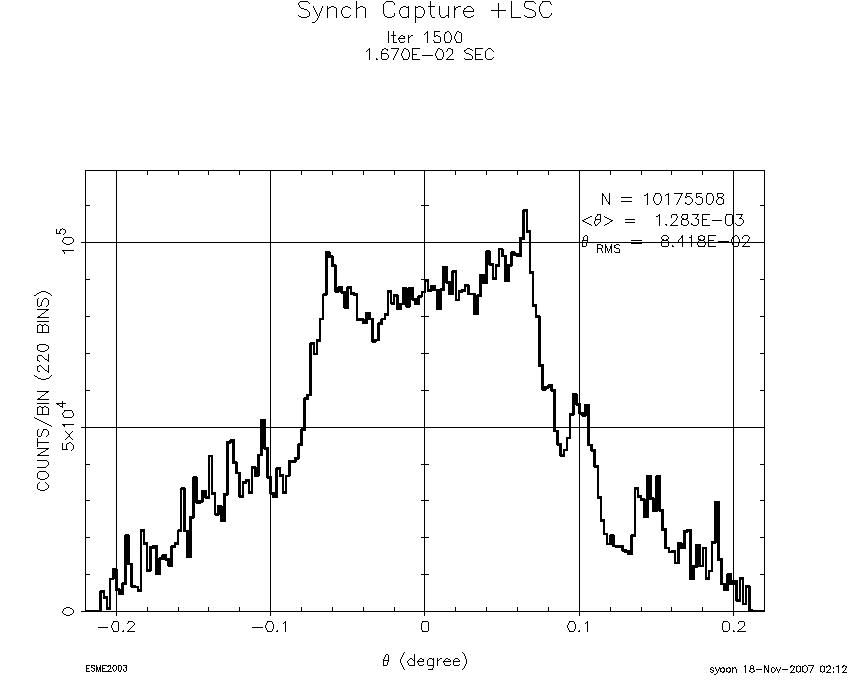
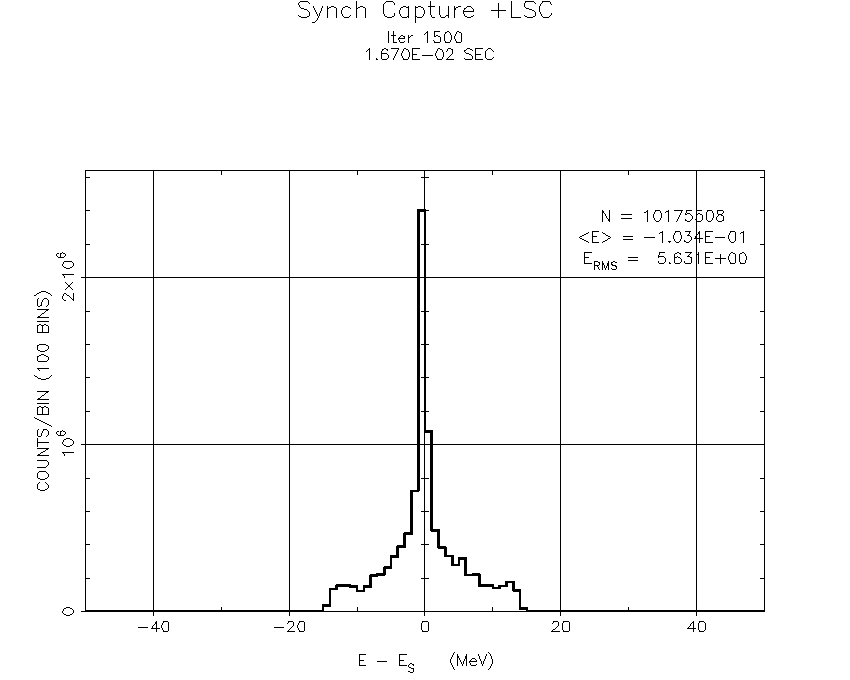
where , , , and are RF voltage, harmonic number, phase angle of each macro-particle, and phase of RF cavity, respectively. As can be seen in Figure 15, the waveform has a negative slope around the stable phase of 0 (deg). By adding a higher secondary harmonic RF voltage to a principal harmonic RF voltage, a flat-bottom potential energy can be produced. With the dual RF system, the RF-bucket contour is also flattened at the top and bottom on a phase-space plot, resulting in a flattened charge distribution. Besides, the principal RF voltage can be half as high as the RF voltage used for the case of single RF harmonic. Since the flat-bottom potential energy can iron out the peaked charge distribution, the utilization of a dual RF system offers a great advantage over the single RF harmonic. Eventually, the dual RF system helps to lower the beam-current limits set by space-charge effects. After 2,700 turns, the formation of localized macro-particle distributions is observed around three local bumps of the dual-harmonic voltage waveform. The time evolution of injected macro-particles inside a dual RF bucket is shown in Figure 16. From turn 1 through turn 270, trains of four micro-bunches are injected with parasitic phase offsets. After the injection process is complete, in order to reach an equilibrium state, injected macro-particles are circulated up to 2,700 turns with no further injection. In Figure 17, trains of injected micro-bunches captured in a dual RF bucket drawn on a phase-space plot at every 100 turns starting from the 1st turn through the 2,700th turns. Note that as time elapses after the completion of injection process, sporadic dips in between lumps of macro-particles are gradually disappeared. In Figures from 18 through 20 three plots of longitudinal phase space, charge density, and energy density comprise each row corresponding to turn number indicated below each phase-space plot. With the careful choice of RF voltages (), a bi-modal charge distribution is created due to a pair of potential wells around the stable phase of 0 (deg). As the turn number increments, longitudinal painting progresses in a parasitic fashion, thus leading up to a continuous bi-modal charge distribution.
















5 Scenario IV: Optimized MI RF
{Bitemize}[t]Dual RF Harmonics:
and
and
= 400 (kV) and = 200 (kV)
(fixed RF voltages)
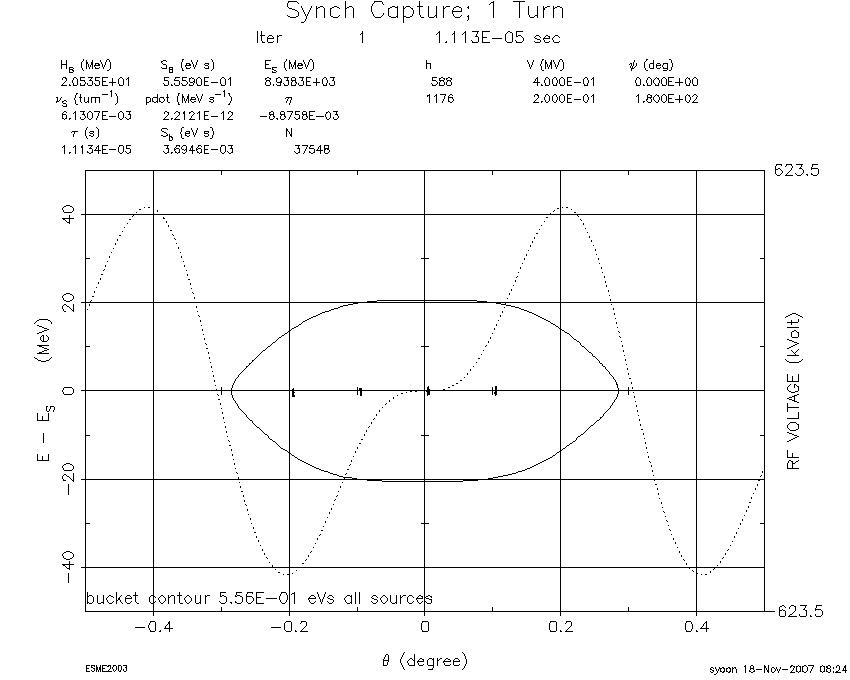
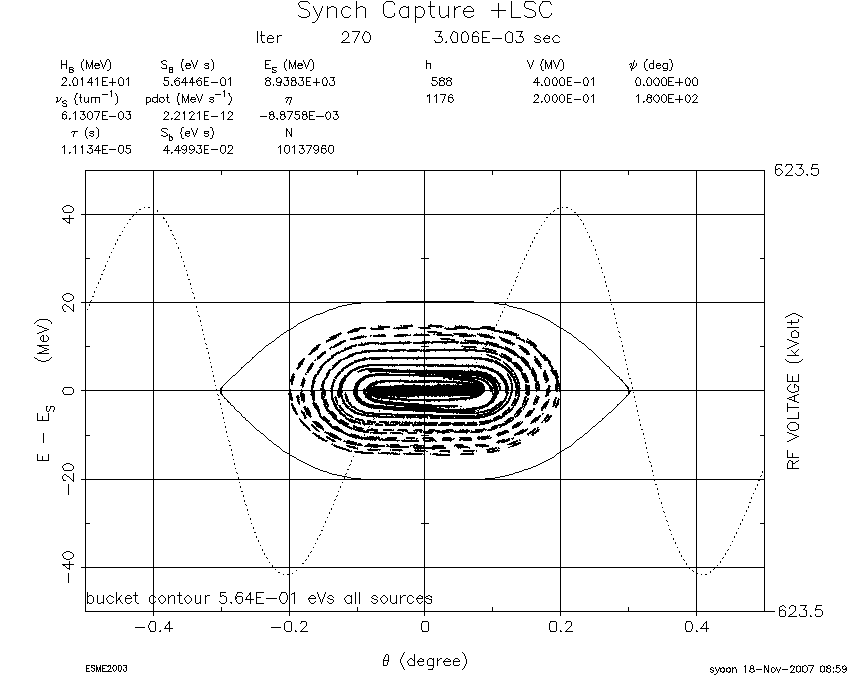
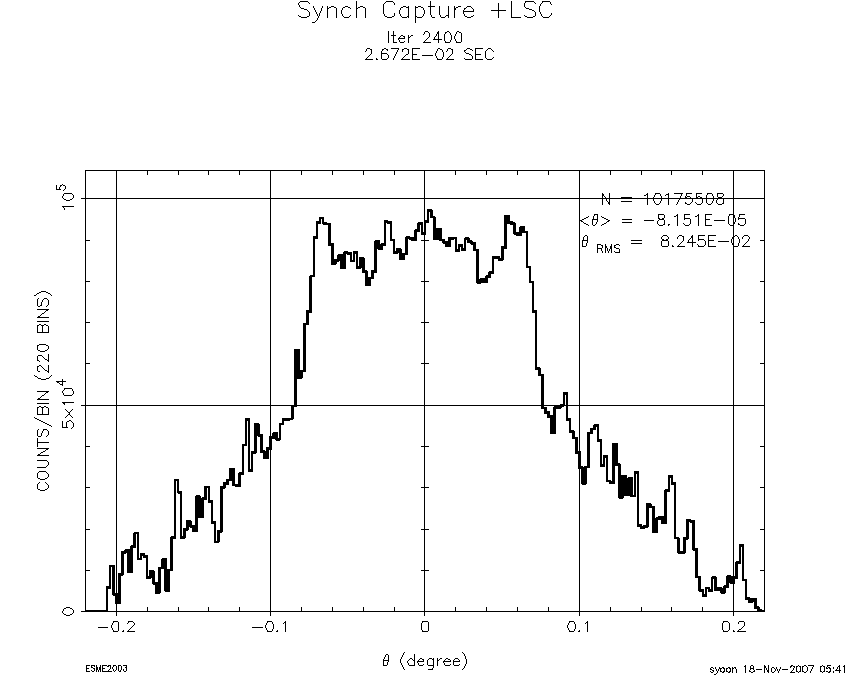
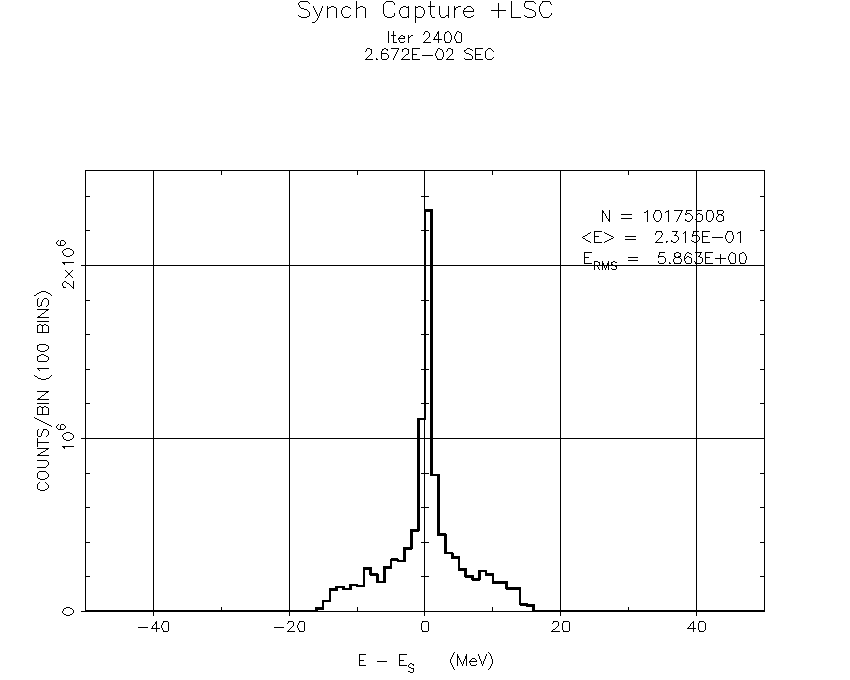
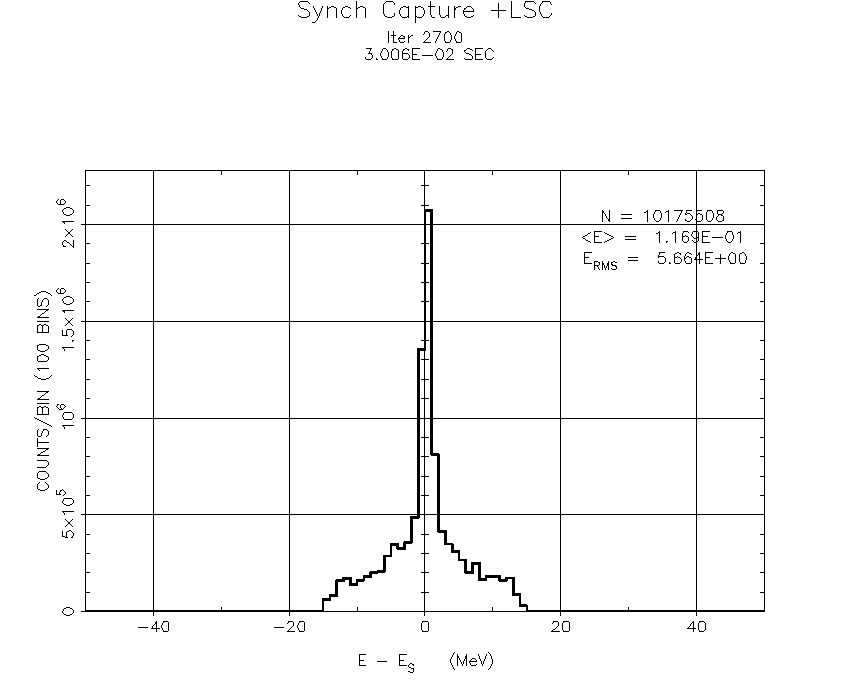
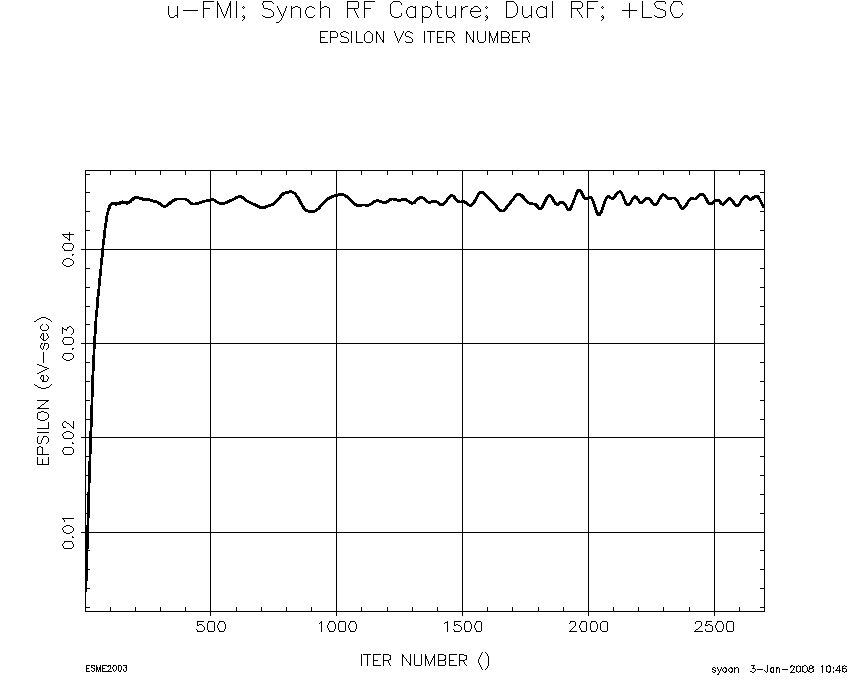
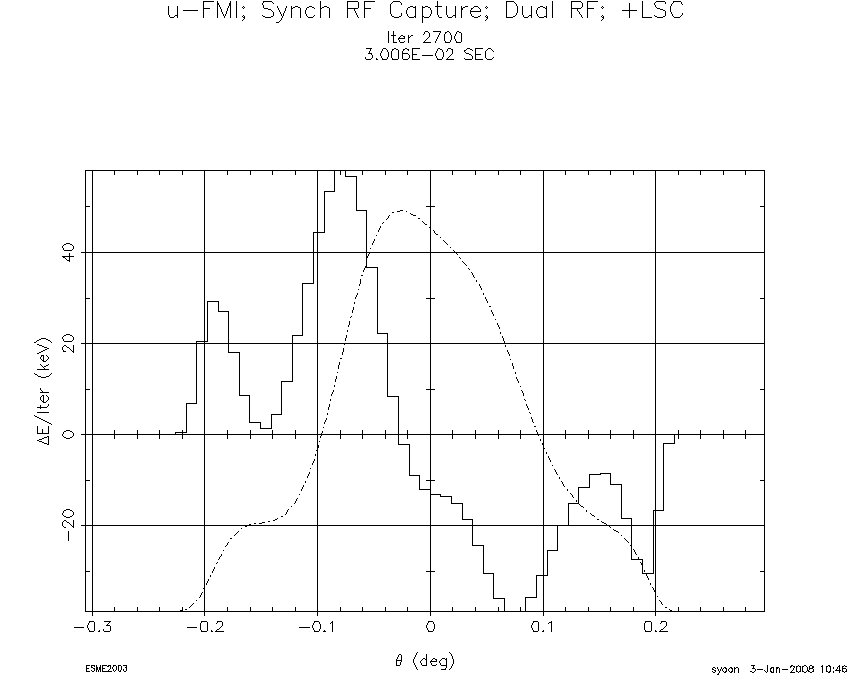
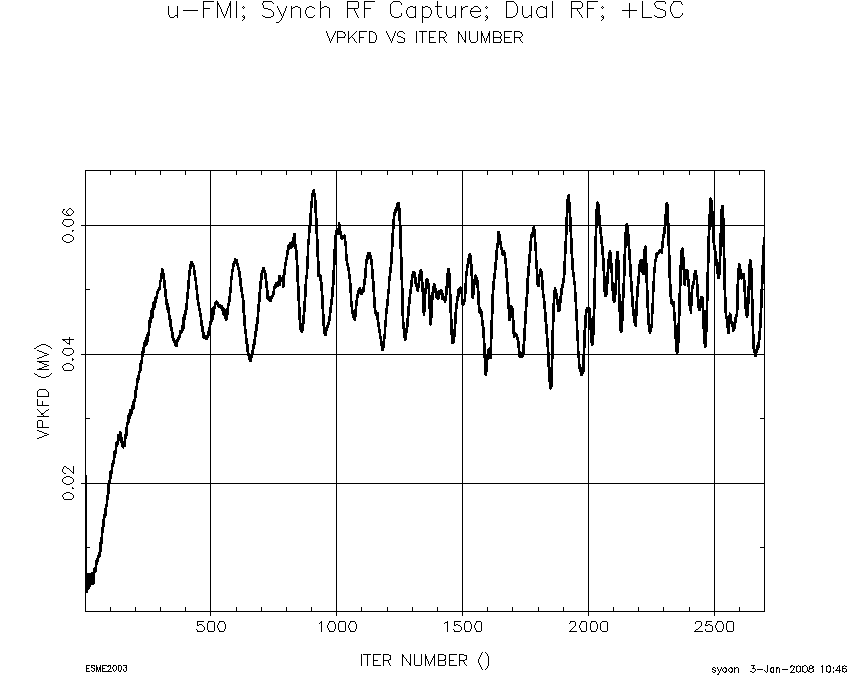
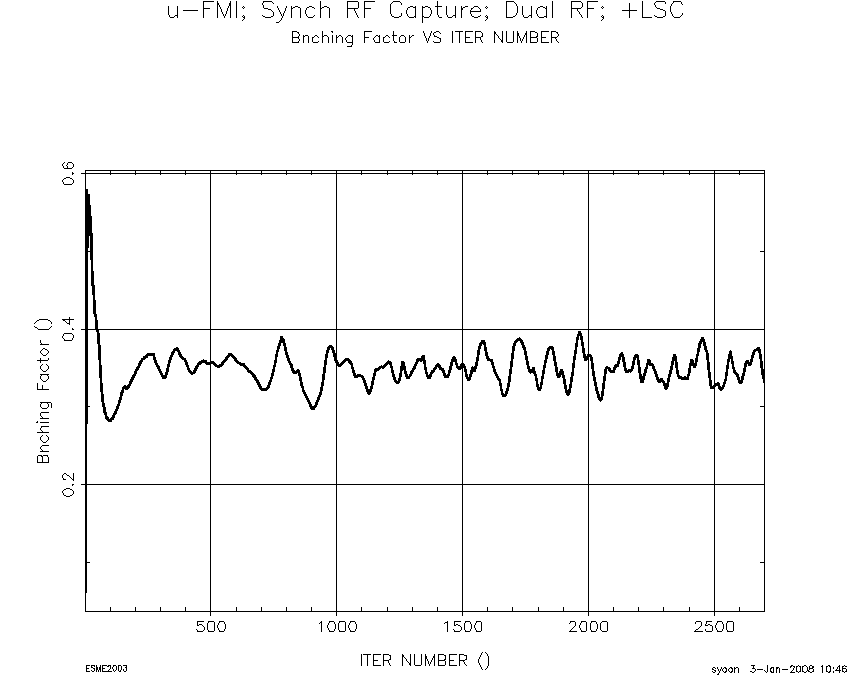
Scenario IV is under the same conditions as Scenario III, except that the secondary RF voltage setting is 50 of the principal RF voltage setting. Scenario IV is more advantageous than Scenario III in that its optimized RF waveform has a nice plateau around the stable phase of 0 (deg) as seen in Figure 21(a). Through the parasitic longitudinal painting under the influence of space charge at each turn, a total of 1,080 (4 270) micro-bunches are injected over 270 turns. Afterwards, those injected micro-bunches are circulated for as long as 30 (ms), thereby transforming gradually into a continuous macro-bunch, or long bunch spanning over the region between -0.2 (deg) and +0.2 (deg) within the MI RF bucket. Unlike in Figure 16 (a) for Scenario III, localization of macro-particles at two positions is not observed in Figure 22 (a) when the injection over 270 turns is complete. After extended circulation of beams up to 2,700 turns with no further injection, the beam charge distribution becomes continuous and smoother in between -0.2 (deg) and +0.2 (deg). (see Figure 22). As a consequence, the bi-modal distribution of charge density observed from Scenario III (Figures 18 through 20) is not observed any longer (Figures 21 through 26). As the number of injected macro-particles increments, the process of longitudinal painting continues. Subsequently, the fine structure of charge distribution gradually vanishes, and the contour of charge distribution becomes smoother after 2,700 turns. With phase offsets alone without energy jitter, this painting effect stands out in charge distribution, rather than energy distribution as observed in Scenario III. As shown in Figures 27(a) and 27(b), an encouraging result is obtained with the dual RF harmonic system. The longitudinal emittance grows and reaches its equilibrium value, which is about a half of the emittance in the cases of the single RF harmonic system. The peak induced voltage () due to space charge was computed using asymmetric charge distributions seen in Figure 27(b). Its peak space-charge voltage rises up to 50 (kV) per turn according to Figure 27(b). Plotted in Figure 27(c) is the evolution of peak voltage induced by space charge. Using the phase modulation in a controlled fashion enables us to maneuver charge distribution, thus resulting in further lowering space-charge voltage.


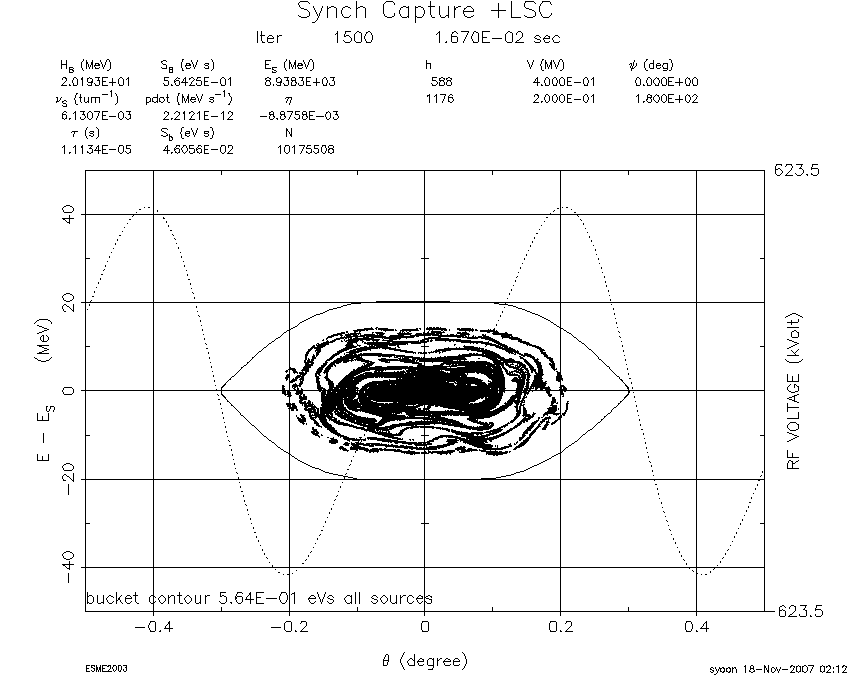
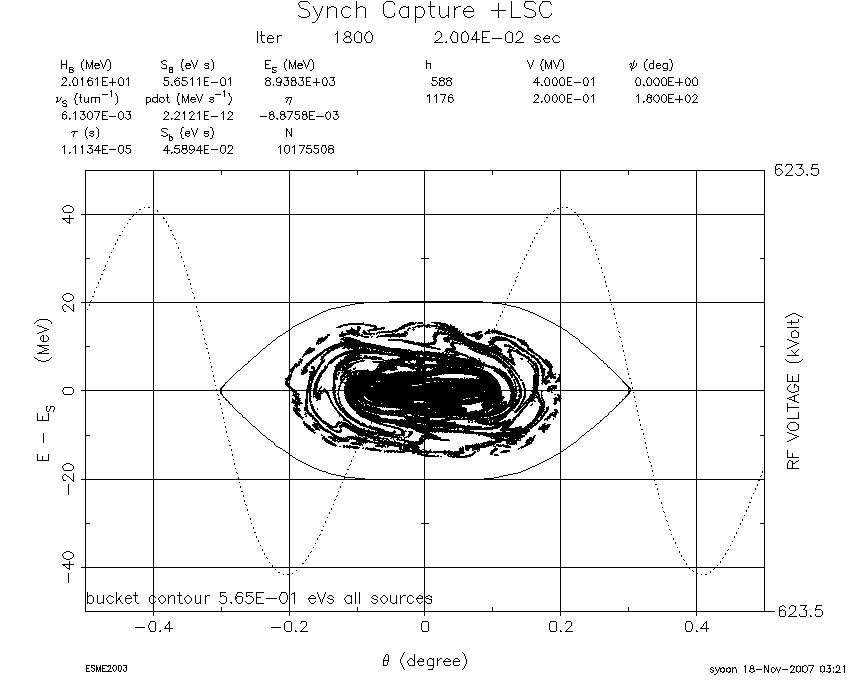
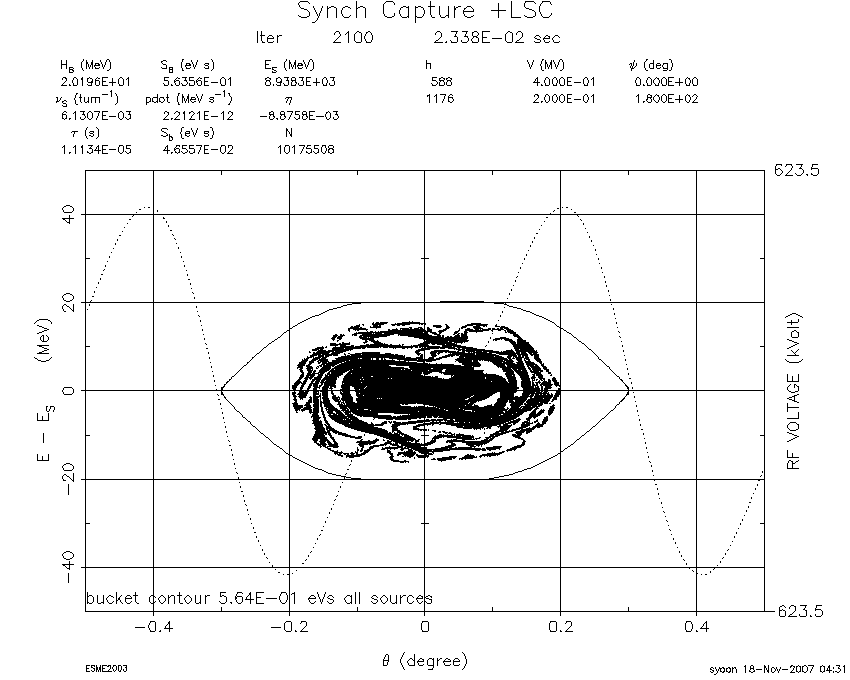
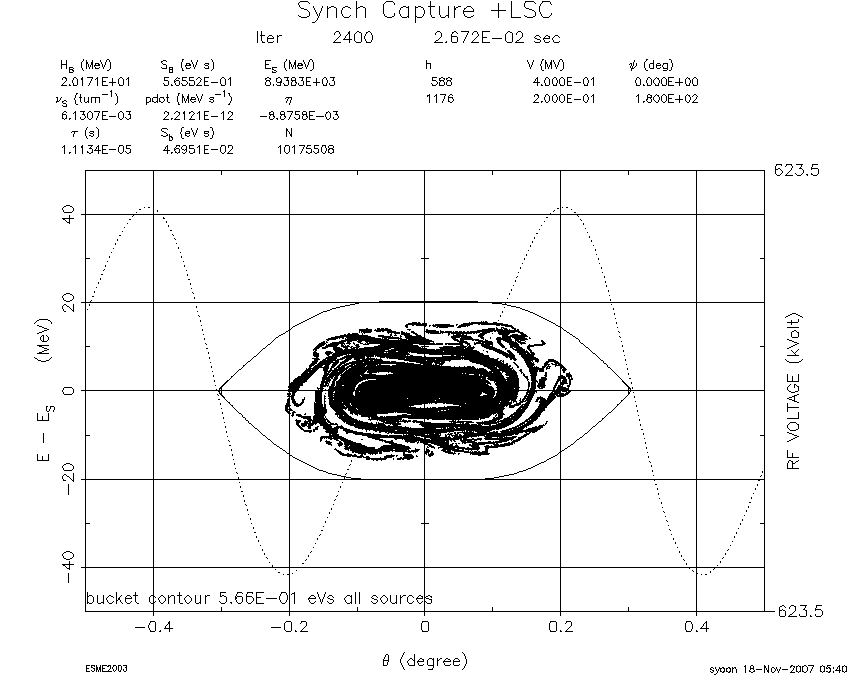














As presented in Figure 27(d), the bunching factor calculated at the completion of multi-turn injection in Scenario IV turns out to be close to that of Scenario I. It is worthwhile to note that the bunching factor (BF) calculations are important in that the BF gives us an idea of how large tune spreads will be prior to calculating 3-D space charge effects while tracking beams.
6 Concluding Remarks
We have investigated different scenarios of injecting micro-bunches from a SCRF linac into the MI ring under the influence of longitudinal space charge: from the 8-GeV linac Proton Driver to the Main Injector
The RF mismatch between a linac and a ring can induce phase slips with trains of micro-bunches, leading to the longitudinal painting phenomenon in an uncontrolled fashion. Thus, it is considered rather advantageous to use harmonics of non-integral ratio between a linac and the ring in order to increase proton intensity by benefiting from parasitic longitudinal painting. Besides, subsequent charge redistribution in longitudinal space can take place by circulating injected beams with no further injection. In other words, charge roaming within the RF bucket in longitudinal phase space can help lower the gradient of charge distribution, thereby reducing its induced voltage arising from the space-charge effect. In addition to longitudinal painting, future simulations are planned to include both phase and energy jitters due to errors in the SCRF linac. Because of the short bunch length of the linac beam, it is anticipated that the impact of the broad-band impedance may play an important role in the context of longitudinal dynamics[13]. An optimized dual RF system and longitudinal painting can overcome beam-intensity limits set by the space-charge effect in high-intensity and low-energy machines. Four different scenarios of injecting multi-bunches demonstrate that a double RF system with the harmonic ratio () of 2.0 and the voltage ratio () of 0.5 are most favored for minimizing the longitudinal space-charge effect. All of the scenarios for the time-structured multi-turn injection including animations are available on a Fermilab website [14].
7 Acknowledgment
Authors wish to thank J. Maclachlan of the Proton Source Department and J-P. Carneiro of Accelerator Physics Center (APC) of Fermilab. Authors had useful discussions with J. Maclachlan modeling multi-turn injection with macro-bunches at the outset. J-P. Carneiro provided us with an input file of the 8-GeV SCRF linac distribution that were generated by the TRACK code[8].
References
- [1] P. S. Yoon, Chapter 7, Ph.D. dissertation, Oct. 2007
- [2] G. W. Foster and J. A. MacLachlan, A multi-mission 8-GeV Injector Linac as a Fermilab Booster Replacement, Proceedings of LINAC 2002, Gyeongju, Korea, p. 826.
- [3] G. W. Foster, An 8-GeV Superconducting Injector Linac, Proceedings of PAC 2005, Knoxville, TN
- [4] G. W. Foster ed., An 8-GeV SC RF Linac Proton Driver Techinical Design Study, http://protondriver.fnal.gov/__ version 56-1, Nov. 2005.
-
[5]
Fermilab Steering Group, Fermilab Steering Group Report
Fermilab-Pub-07-672-DO, Dec. 2007 - [6] Agenda for the Transport and Injection Mini-Workshop, December 9-10, 2004, Fermilab, URL: http://www-bd.fnal.gov/pdriver/H-workshop/
-
[7]
D. E. Johnson, P. S. Yoon, C-J Liaw, D. Raperia, and J. Beebee-Wang
An 8-GeV Multi-turn Injection System for the Fermilab Main Injector Proc. of PAC 2007, Alberquque, NM; Fermilab-Conf-07-287-AD - [8] P. N. Ostroumov, Physics Design of the 8-GeV Linac, New Journal of Physics vol. 8 No.11 p. 281,
- [9] R. Madrak, Fast Beam Chopper for MEBT in the High Intensity Neutrino Source Fermilab Beams-Doc 2901, April 2007
- [10] J. A. MacLachlan, Multiparticle Dynacmics in the E- Tracking Code ESME, Fermilab-Conf-02102, 2002
- [11] J. A. MacLachlan, Presentation at the Proton Driver meeting, 2005
- [12] P. S. Yoon, Presentation at the Proton Driver meeting, 2005
- [13] G. P. Jackson, Impact of Microwave Impedance in Proton Driver Beams during Synchrotron Injection, ICFA Advanced Beam Dynamics Workshop on High Power Superconducting Ion, Proton, and Multispecies Ions, Naperville, IL May 2005
-
[14]
P. S. Yoon, The Injection Modeling for the Main Injector
URL: http://www-ap.fnal.gov/~syoon/SC/FMI.html