Limits on the X-ray and optical luminosity of the progenitor of the type Ia supernova SN2007sr
Abstract
We present HST/WFPC2, GALEX and Chandra observations of the position of the type Ia supernova SN2007sr in the Antennae galaxy, taken before the explosion. No source is found in any of the observations, allowing us to put interesting constraints on the progenitor luminosity. In total there is about 450 kilosecond of Chandra data, spread over 7 different observations. Limiting magnitudes of FUV (23.7 AB mag), NUV (23.8 AB mag), F555W (26.5 Vega mag) and F814W (24.5-25 Vega mag) are derived. The distance to the Antennae galaxy is surprisingly poorly known, with almost a factor of 2 difference between the latest distance based on the tip of the red giant branch (13.3 Mpc) and the distance derived from the 2007sr light curve (25 Mpc). Using these distances we derive limits on absolute optical and UV magnitudes of any progenitor but these are still above the brightest (symbiotic) proposed progenitors. From the Chandra data a 3 upper limit to the X-ray luminosity of 0.5 – 8.0 erg/s in the 0.3-1 keV range is found. This is below the X-ray luminosity of the potential progenitor of the type Ia supernova 2007on that we recently discovered and for which we report a corrected X-ray luminosity. If that progenitor is confirmed it suggests the two supernovae have different progenitors. The X-ray limit is comparable to the brightest supersoft X-ray sources in the Galaxy, the LMC and the SMC and significantly below the luminosities of the brightest supersoft and quasi-soft X-ray sources found in nearby galaxies, ruling out such sources as progenitors of this type Ia supernova.
keywords:
Supernovae – binaries: close – white dwarfs – X-ray: binaries1 Introduction
| Satellite | Instrument | ID | date | exp. time | mag limit |
|---|---|---|---|---|---|
| GALEX | NUV | NGA_Antennae | 2004-02-22/28 | 2365 | 23.7 (AB) |
| GALEX | FUV | NGA_Antennae | 2004-02-22/28 | 2365 | 23.7 (AB) |
| HST | WFP2/F814W | U54Q0201r–204r | 1999-02-22 | 1800 | 24.5-25 |
| HST | WFP2/F555W | U54Q0205r–208r | 1999-02-22 | 2000 | 26.5 |
| Chandra | ACIS-S | 0315 | 1999-12-01 | 73170 | |
| Chandra | ACIS-S | 3040 | 2001-12-29 | 69930 | |
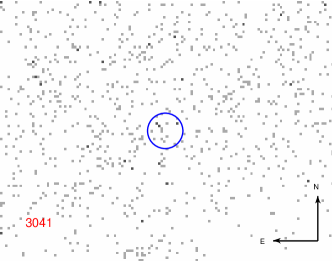
| Chandra | ACIS-S | 3041 | 2002-11-22 | 73850 | |
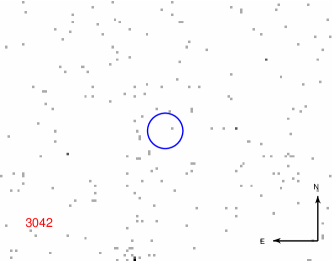
| Chandra | ACIS-S | 3042 | 2002-05-31 | 68140 | |
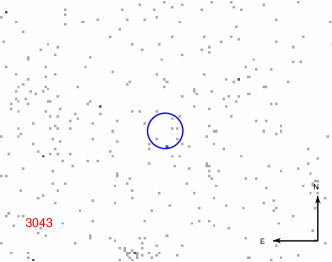
| Chandra | ACIS-S | 3043 | 2002-04-18 | 67960 | |
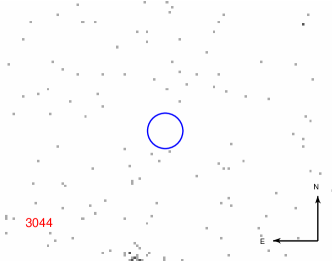
| Chandra | ACIS-S | 3044 | 2002-07-10 | 36970 | |
| Chandra | ACIS-S | 3718 | 2002-07-13 | 35160 |
Type Ia supernovae (SNIa) are currently thought to be thermonuclear explosions of white dwarfs reaching the Chandrasekhar mass, most likely in a binary system (see e.g. Hillebrandt & Niemeyer, 2000; Leibundgut, 2000) and are used to map the accelerating expansion of the Universe (Riess et al., 1998; Perlmutter et al., 1999). Exactly in what type of configuration the explosions occur is unclear, with proposed models roughly divided in two categories: white dwarfs accreting from a (hydrogen rich) companion star (Whelan & Iben, 1973; Nomoto, 1982) or two white dwarfs merging (Tutukov & Yungelson, 1981; Webbink, 1984; Iben & Tutukov, 1984). The accreting models are often identified with supersoft X-ray sources (e.g. Kahabka & van den Heuvel, 1997), which are believed to harbour white dwarfs that are burning the accreted hydrogen steadily (van den Heuvel et al., 1992). They are heavily absorbed in the Galaxy but are found (although not in the expected numbers111http://online.itp.ucsb.edu/online/snovae_c07/distefano/) in nearby galaxies (e.g. Di Stefano & Kong, 2004). Although it is unclear which models are correct (see Yoon et al., 2007, and references therein), the fact that the SNIa rate consists of a prompt and a tardy component and is very different in early and late type galaxies, might suggest both progenitor categories actually contribute (e.g. della Valle & Livio, 1994; Scannapieco & Bildsten, 2005; Mannucci et al., 2006; Sullivan et al., 2006). In recent years it has proved to be difficult to distinguish between the models based on theoretical arguments, so the most promising route at the moment for distinguishing between the different proposed models is via observations (e.g. Mattila et al., 2005; Patat et al., 2007).
We started a project to search for direct detections of progenitors of observed SNIa in archival images taken before the explosion. We recently reported the discovery of a possible progenitor of SNIa 2007on in archival Chandra images (Voss & Nelemans, 2008, but see Roelofs et al. 2008 for new results that show the X-ray source may be unrelated.). The X-ray luminosity of the possible progenitor of 2007on is erg/s (assuming a flat spectrum in each of the three [0.3-1, 1-2 and 2-8 keV] bands), or for a spectrum that only runs between 0.6 and 5 keV (where actual photons have been detected) for a distance of 20 Mpc and corrected for a numerical error in the conversion of hard X-ray counts to flux in Voss & Nelemans (2008). The previously reported upper limits to the X-ray luminosity SN2002cv, SN2004W and SN2006mr, corrected for the same numerical error, are erg/s, erg/s and erg/s respectively. Upper limits on the absolute -band magnitudes of the progenitors of SNIa SN2007on, SN2006dd and SN2006mr are about 5.5 (Voss & Nelemans, 2008; Maoz & Mannucci, 2008).
2 SN2007sr in the Antennae galaxy
Supernova 2007sr was discovered on Dec. 18 2007, as a transient object close to the Southern tidal tail of the Antennae galaxy by the Catalina Sky Survey 222http://www.lpl.arizona.edu/css/ (Drake et al., 2007). Low resolution spectra showed that the object is a type Ia supernova (Naito et al., 2007; Umbriaco et al., 2007). Pojmanski et al. (2008) report detection of the supernova in images obtained by the All-Sky Automated Survey (ASAS) for Nearby Supernovae before the discovery, starting on Dec. 7 2007 which shows that the light curve has peaked around Dec. 14. The supernova was detected in Swift observations in the optical and UV bands (Immler & Landsman, 2007) and PAIRITEL near-IR observations detected the supernova in , and band, at slightly redder colours than expected (Bloom et al., 2007). Both the near-IR peak magnitude and the optical peak using the scaling (Phillips, 1993) suggest a distance of 25-30 Mpc for the supernova (Bloom et al., 2007; Pojmanski et al., 2008), unless the supernova is underluminous or significantly reddened by extinction (see below). Shimada & Yamaoka (2007) report a non-detection of the progenitor of 2007sr in Subaru -band images, taken in Feb 2004, with an upper limit of 23.8, indicating a limit for a an assumed distance of the Antennae galaxy of 19 Mpc based on its velocity (but see below).
The Antennae galaxy (NGC 4038 and NGC4039) are the most well known pair of merging galaxies, showing extended tidal tails (Toomre & Toomre, 1972) and clear evidence for merger induced star formation and the formation of young star clusters (Whitmore & Schweizer, 1995). Hibbard et al. (2005) analyse GALEX data and conclude that in the tidal tails there is evidence for recent star formation with an age around the dynamical age of the tail (300 Myr), although most of the stars in the tails date from before that period. These populations of both merging galaxies are consistent with a star formation history that peaked very early (15 Gyr ago in the models of Kassin et al., 2003). The distance to the galaxy pair is estimated around 20 Mpc from its velocity of about 1650 km/s, which can be quite unreliable for such small distances due to anisotropies in the velocities. Saviane et al. (2004) determine a distance to the galaxies of 13.8 Mpc, based on scaling of the red giant branch tip in the old population observed at the very end of the southern tail using WFPC2 data and recently (Saviane et al., 2008) confirm their finding, with ACS data revising the distance estimate to 13.3 Mpc. We will return to the distance measurements in Sect. 4.3.
3 Observations
In order to determine its position, archival observations of Antennae galaxy and SN 2007sr were retrieved from the ESO archive. The observations were obtained with the Wide Field Imager (WFI) at the ESO 2.2 m telescope and the ESO Faint Object Spectrograph and Camera (EFOSC) at the 3.6 m telescope, both located on La Silla and operated by the European Southern Observatory. The EFOSC image is a 20-s, -band exposure taken on Jan 3, 2008, the WFI image is 3 min in the -band, taken on April 16, 2005.
In order to search for the progenitor of 2007sr we retrieved archival data in different wavebands. A list of the observations is given in Table 1. The Hubble Space Telescope observed the field of 2007sr with the Wide Field Planetary Camera 2 (WFPC2) in 1999 in two filters: F814W (-band like) and F555W (-band like). The Antennae galaxy are part of the Galaxy Evolution Explorer (GALEX) Nearby Galaxies Survey (NGS Bianchi et al., 2005) and have been observed 4 times in Feb. 2004, both with the far-UV filter (1400-1700Å) and the near-UV filter (1900-2700Å). Finally the Chandra X-ray observatory observed the field of 2007sr seven times between 1999 and 2002 at an off-axis angle of 5.8’.
The GALEX data comes fully reduced (Morrissey et al., 2005) from the archive and we analysed the data by visually inspecting the position of 2007sr. The FUV and NUV images of the region around 2007sr are shown in Fig. 1, top panels. There is no sign of a source at the position.
For the pipeline reduced WFPC2 data (Baggett et al., 2002), we extracted the WF2 chip images from the data cubes and aligned the exposures by a shift determined from the average of three clearly detected objects spread over the field. The four exposures in each filter where combined using the median, to get rid of cosmic rays. The resulting images are shown in Fig. 1, middle panels. A zoom in at the position of 2007sr is shown in the bottom panels.
The Chandra observations were analysed using the standard CIAO v3.4 data reduction333http://cxc.harvard.edu/ciao. For each of the observations we extracted photons in a region with 35 radius around the optical supernova position, and estimated the background from a nearby empty area with a radius of 15. Since we are primarily interested in upper limits to the soft X-rays that are expected from accreting white dwarfs, we limit the analysis to events with energies below 1 keV. From the point spread function estimated for a spectrum dominated by soft (0.3-1.0 keV) photons, 85% the flux from any X-ray source at the position of the supernova is expected to fall inside the 35 source region. To estimate the sensitivity of the observations, response matrices were extracted, and source spectra were modelled by Xspec v12.2444http://heasarc.nasa.gov/xanadu/xspec.
4 Results
4.1 Position
The 3 min -band WFI observation of the Antennae galaxy was used to astrometrically calibrate the EFOSC observation of the supernova. A total of 122 2MASS stars coincided with the field-of-view of a single WFI chip and 48 of these were not saturated and appeared stellar. After iteratively removing outliers we obtained an astrometric solution using 31 2MASS stars, yielding rms residuals of in right ascension and in declination.
A list of secondary astrometric standard stars was compiled by measuring the positions of stars on the WFI image. These calibrated positions were used to transfer the astrometry onto the 20 sec -band EFOSC image of the supernova. The final astrometric calibration used 57 stars common to both the WFI and the EFOSC image, with rms residuals of in right ascension and in declination.
Based on this astrometric calibration, we find that the position of the supernova in the EFOSC image is and . The uncertainty of the position on the EFOSC image is in right ascension and in declination, while the uncertainty on the absolute position is in right ascension and in declination (i.e. the quadratic sum of the uncertainties in the tie between the 2MASS catalog and WFI observation, the tie between the WFI and the EFOSC observations and the uncertainty of the supernova position on the EFOSC observation).
4.2 Upper limits to the X-ray counts and optical/UV magnitudes
We use the accurate position of 2007sr to search for its progenitor in the HST, GALEX and Chandra images. In none of them we find a source at the position of 2007sr. Upper limits to the flux of any progenitor in the different bands are determined as follows.
For the F814W HST image the zero-point in the WF2 chip is 21.665 (Baggett et al., 2002), the faintest objects that can still be recovered are between magnitudes 24.5 and 25. In order to determine these upper limits, we used the mkobjects tool in IRAF555IRAF is distributed by the National Optical Astronomy Observatories, which are operated by the Association of Universities for Research in Astronomy, Inc., under cooperative agreement with the National Science Foundation. to simulate sources of different magnitude. SExtractor (Bertin & Arnouts, 1996), as implemented in GAIA666Graphical Astronomy and Image Analysis Tool, as well as the built-in aperture photometry and psf-photometry were used to determine which objects could still be recovered. For the F555W filter the zero-point is 22.571 and the faintest magnitudes that could be recovered are around mag 26.5.
For GALEX in the NUV filter the faintest objects, simulated with mkobjects in IRAF as before, that we could recover were around mag 23, but in GALEX catalogue sources to 23.7 are reported. In the FUV we could recover objects up to mag 23.5 but again the GALEX catalogue lists object to magnitudes of 23.7.
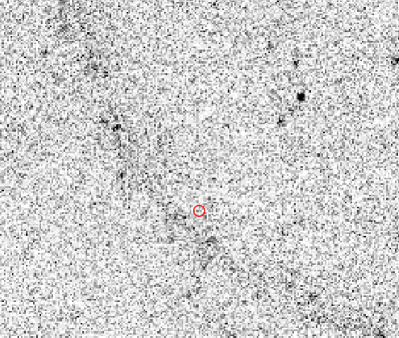
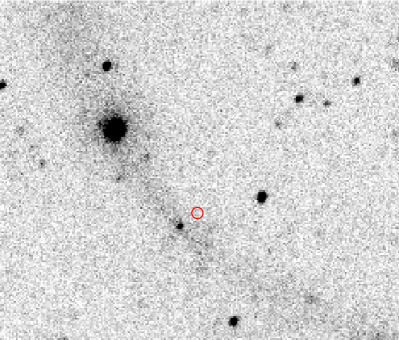
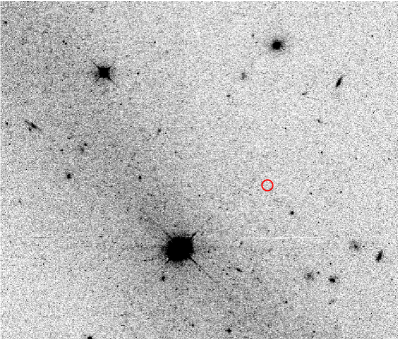
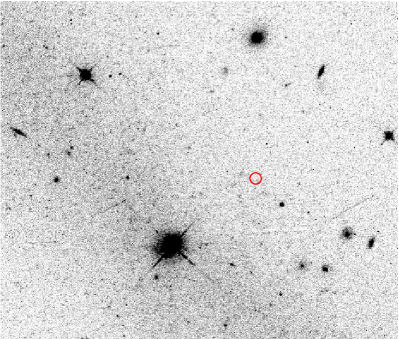
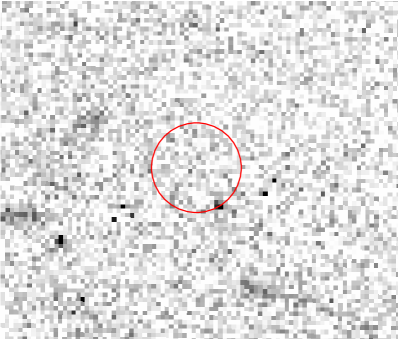
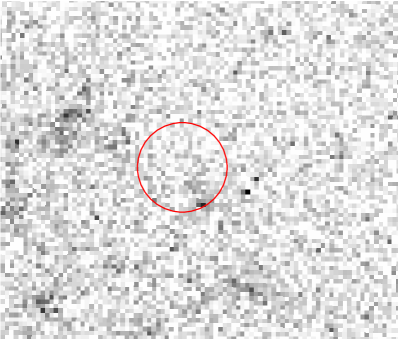
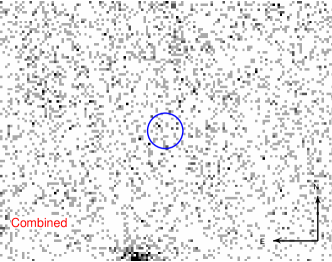
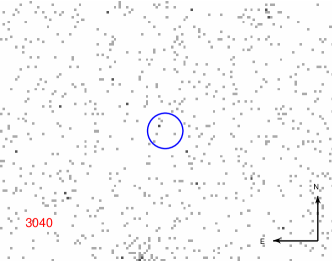
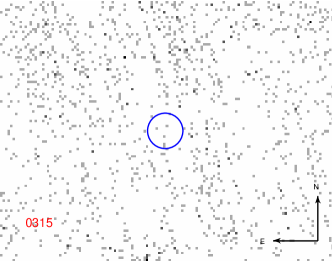
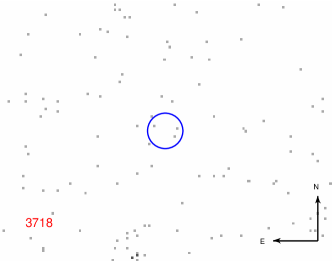
The individual Chandra images, as well as the combined image, showing the non-detection of the progenitor of 2007sr are shown in Fig. 2 (note that these images show all events in the complete 0.3-8 keV Chandra band, not only the soft photons). Because of the non-detection and the good alignment we did not calculate individual boresight corrections for the individual images. The upper limits in counts in the soft band only, for the individual images are between 6.2 and 13.2. In order to determine upper limits, we convert these to X-ray fluxes, assuming black body spectra of 50, 100 and 150 eV below.
 |
 |
 |
 |
 |
 |
 |
 |
4.3 Limits on absolute magnitudes and X-ray luminosity
In order to translate the Chandra upper limits to upper limits on the X-ray luminosity of any progenitor, two things need to be discussed in detail: the absorption along the line of sight and the distance to the galaxy. As we discussed above the distance to the Antennae galaxy is surprisingly uncertain. On the one hand there is the most recent distance determination, based on the identification of the tip of the giant branch in the old population of stars found at the end of the southern tail, which gives a best estimate of 13.3 Mpc (Saviane et al., 2008). Although the earlier claim for a small distance was based on the detection of the tip of the giant branch at the detection limit (Saviane et al., 2004), the new ACS data go some 2 magnitudes deeper. However, with such a distance modulus, 2007sr would have a peak -band absolute magnitude of 17.8. This is very low for a SNIa and would make it underluminous, like the 1991bg types (e.g. Filippenko, 1997). Indeed the near-IR colours reported by Bloom et al. (2007) (H Ks = 0.15, J H = 0.29) are redder than normal SNIa, as is the case for 1991bg. However, the decline of the light curve is slow and the measured value of = 0.8-0.9 implies an absolute magnitude of 19.2 (Pojmanski et al., 2008). The latter value would put the Antennae galaxy at 25 Mpc. The measured value of combined with an absolute magnitude of 17.8 would make 2007sr similar to the very peculiar SNIa 2002cx (e.g. Branch et al., 2004; Li et al., 2003), but there is no report of any of the peculiar features seen in the spectrum and lightcurve of 2002cx.
Alternatively, the redder colours and fainter absolute magnitude could point to significant reddening along the line of sight. Bloom et al. (2007) mention this possibility, but conclude that it is an unlikely explanation of the low brightness of the explosion for such a short distance. Indeed although the NIR colours are somewhat redder than typical SNIa, the reported magnitude of 13.99 (Bloom et al., 2007) around the time that the magnitude was 12.9 (Pojmanski et al., 2008) yields a of , rather blue compared to the updated Nugent et al. (2002) templates777http://supernova.lbl.gov/ nugent/nugent_templates.html (around soon after the peak). Also, the Swift observations (Immler & Landsman, 2007) have detected 2007sr in both and the filter, at roughly the same colour as SN 2007on around the peak.
We further investigated if there is any evidence for more than the Galactic hydrogen column to the supernova. The most useful data available is a detailed study of the HI and stellar colours of the Antennae galaxy by Hibbard et al. (2001). The position of the supernova falls at a HI column density that corresponds to cm-2 using the scaling of Arabadjis & Bregman (1999). This corresponds to a very modest optical absorption (Predehl & Schmitt, 1995) and would hardly influence the near-IR colours. In addition, their optical photometry shows that the local colours are not particularly red. Conversely, to make the absolute -band magnitude consistent with the short distance an hydrogen column of cm-2 is needed ( cm-2 in order to get the average near-IR colours).
Unfortunately at this moment, no other independent distance measurements are available. A good distance to the Antennae galaxy seems now a crucial test of the SNIa scaling used for cosmology. For the moment there is no other option than to consider the distance uncertain in the range 13.3-25 Mpc. We do not need to consider the option of a short distance combined with extinction separately, as that would give similar upper limits to the ones we derive for the long distance.
With these assumptions, the distance modulus to the galaxy is between 30.6 and 32. Thus the absolute magnitude limits are between 8.3 and 6.9 for the UV magnitudes and between 7.5 and 5.6 for the F814W filter and between 5.5 and 4.1 for the F555W filter.
| ObsID | |||
|---|---|---|---|
| ( erg/s) | ( erg/s) | ( erg/s) | |
| 3040 | 3.3-12 | 1.4-5.1 | 1.0-3.7 |
| 3041 | 5.5-20 | 2.4-8.3 | 1.7-5.9 |
| 3042 | 17-60 | 4.3-15 | 2.2-7.9 |
| 3043 | 22-78 | 5.6-20 | 2.9-10 |
| 3044 | 35-124 | 8.7-31 | 4.5-16 |
| 0315 | 19-66 | 6.3-22 | 3.7-130 |
| 3718 | 53-186 | 13-46 | 6.7-24 |
| Combined | 2.3-8.0 | 0.84-3.0 | 0.5-1.9 |
| ObsID | |||
| ( erg/s) | ( erg/s) | ( erg/s) | |
| 3040 | 23-83 | 2.4-8.5 | 1.4-5.1 |
| 3041 | 40-140 | 3.9-14 | 2.3-8.1 |
| 3042 | 120-424 | 7.2-25 | 3.1-11 |
| 3043 | 157-556 | 9.4-33 | 4.1-14 |
| 3044 | 252-889 | 15-51 | 6.2-22 |
| 0315 | 134-473 | 10-37 | 5.1-18 |
| 3718 | 377-1331 | 22-77 | 9.3-33 |
| Combined | 16-57 | 1.4-5.0 | 0.74-2.6 |
In order to compare the X-ray upper limits with proposed SNIa progenitors, in particular the supersoft sources, we derive upper limits to the luminosities of any progenitor in two different ways. The first is to determine the upper limit to the X-ray luminosity in the 0.3-1.0 keV band only, corrected for the foreground Galactic absorption. Because of the energy-dependent sensitivity, these limits depend on the assumed X-ray spectrum. In Table 2, top half, we report the upper limits for blackbody spectra of 50, 100 and 150 eV, both for the individual observations and for the combined data. These numbers will later be used to compare with extragalactic sources for which there are often not enough data to determine the bolometric luminosity.
The second way is to apply a bolometric correction corresponding to the same range in assumed blackbody temperatures. The upper limits to the bolometric luminosity are shown in the bottom half of Table 2 and will later be compared with those supersoft sources for which accurate bolometric luminosities have been determined.
Table 2 shows the strong dependence of the sensitivity on background and position on the Chandra CCDs. The limits are primarily set by observation 3040 and 3041, in particular for soft assumed spectra. In observation 0315, the supernova region is heavily contaminated by photon streaks on the ACIS-S4 detector (Fig. 2), therefore this observation was not used to determine the upper limit for the combined observations.
5 Discussion, implication for progenitor models
We can now compare the limits on the UV and optical brightness of the progenitor of 2007sr with limits from the literature as well as proposed progenitors and progenitor models. Our limits are comparable to the optical limit we derived for 2007on Voss & Nelemans (2008) and the limits derived by Maoz & Mannucci (2008) for 2006dd and 2006mr (5.4 and 6 in the F555W and F814W bands respectively). The optical limits do not rule out the classical supersoft sources, which have absolute magnitudes around 2 (Cowley et al., 1998). The brightest progenitor models in the optical would be white dwarfs in wide binaries with very evolved intermediate mass companions, such as symbiotic stars. Šimon (2003) list the absolute magnitudes of classical supersoft sources as well as related objects such as symbiotic binaries and novae. The brightest absolute magnitudes (of V Sge and some symbiotics) are between 3.5 and 4. We can also compare the limits with theoretical stellar evolution models, as is done in detail in Maoz & Mannucci (2008, see their figure 3). Our limits for the short distance to the Antennae galaxy and low absorption, rule out the evolved stages of stars more massive than 6 . However, single degenerate models typically predict companion stars with masses below 2.5 (e.g. Han, 2008).
For the UV limits, we can compare to e.g. the limit on the supersoft source RX J0513.9-6951 from the XMM optical monitor, yielding an absolute UV (AB) mag of 1.5 to 2 (McGowan et al., 2005). Alternatively, converting the UV magnitudes to energies in the respective bands we find 1.2-4.4 erg/s in the NUV and 1-3.6 is the FUV band, in the range of the bolometric luminosities expected for steady burning on a white dwarf (e.g. van den Heuvel et al., 1992)
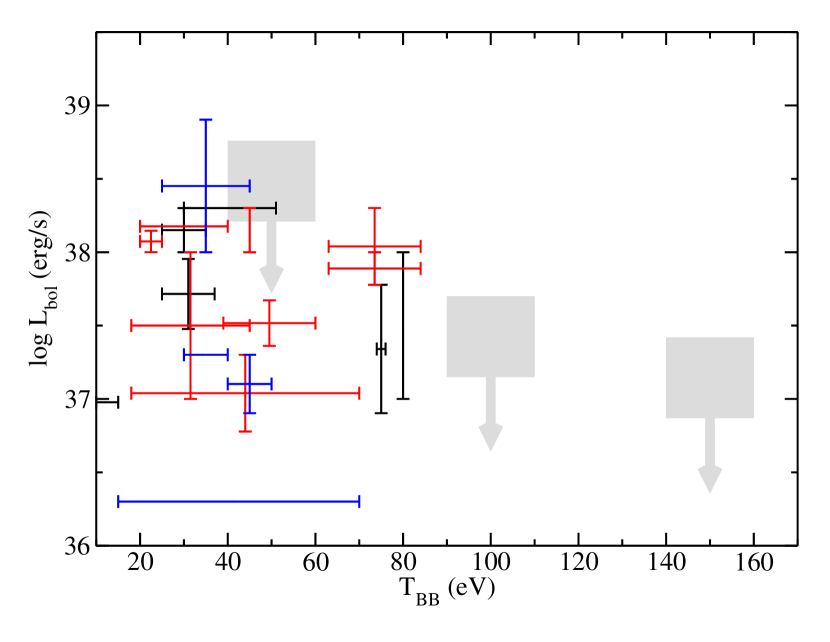
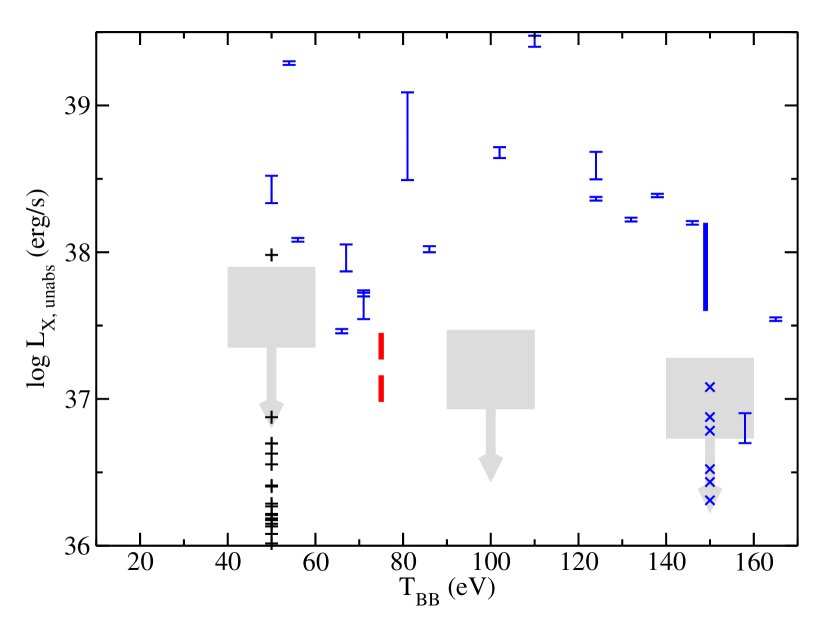
The most interesting comparison is with the X-ray luminosities of accreting white dwarfs and related objects with the upper limits shown in Table 2. In Fig. 3 we compare our limits on X-ray and bolometric luminosity with some relevant sources. The limits shown in Table 2 are shown as the grey boxes with arrows, where the vertical extent of the box represents the luminosity limit range for the range of distances (13.3 - 25 Mpc) assumed. In the top plot we compare with the derived bolometric luminosities of supersoft X-ray sources in the Galaxy, the LMC and the SMC. The data are taken from Greiner (2000), with updates from Lanz et al. (2005); McGowan et al. (2005). Theoretically the supersoft sources are expected to have bolometric luminosities between and erg/s (e.g. van den Heuvel et al., 1992), which matches the observations. Because of the very soft character of these sources, most of the flux is outside the Chandra band, and the upper limit we derive is not constraining any of the objects. In the bottom panel, we compare our upper limits with soft X-ray sources in nearby galaxies. The plusses and crosses are the supersoft and quasi-soft sources in M31 as observed with Chandra by Di Stefano et al. (2004). We converted the count rates given in their paper to fluxes and luminosities using the CIAO software, where for simplicity we assumed the blackbody temperature of supersoft sources to be 50 eV and for quasi-soft sources to be 150 eV. With the Galactic absorption towards M31 we find a translation factor from counts/ksec to flux of and erg/s for a 50 and 150 eV black body spectrum respectively. With a distance to M31 of 780 kpc, this translates into the luminosities shown, which are somewhat lower than the ones shown in figure 4 of Di Stefano et al. (2004). In the same plot we show the brightest soft sources in the nearby galaxies NGC 4697, M51, M83 and M101 as given in Di Stefano & Kong (2004). Most of the M31 sources have lower luminosities than the limits we derive, but there are a significant number of soft sources in nearby galaxies that are excluded as progenitor for 2007sr, although it is unclear how many of these objects are accreting white dwarfs.
In addition we can compare the limits to the object found in pre-SN archival images at the position of 2007on. The luminosity reported in Voss & Nelemans (2008) is incorrect due to a numerical error in the conversion of the count rate in the hard band to flux. With a corrected X-ray luminosity of erg/s it is well above the limiting luminosities for an 150 eV model, even for an assumed large distance to the Antennae galaxy. The object is shown as the thick vertical bar in the bottom plot of Fig. 3, shown at black body temperature of 150 eV. However, as is discussed in Roelofs et al. (2008), there is some evidence for two components in the spectrum. In addition, although low-number statistics, 4 of the 5 hard photons are detected in the last 10 ks of one of the two observations that have been combined for the pre-SN Chandra image. We therefore also investigate the possibility that the hard photons are somehow unrelated to the progenitor. Counting only the soft photons, the X-ray luminosity of the proposed progenitor of 2007on would be erg/s. This is plotted as the thick broken bar shown at 75 eV in Fig. 3 and is comparable to the upper limits derived for 2007sr.
So if the association with 2007on would be confirmed by future Chandra observations (see Roelofs et al., 2008), this suggests the progenitor of 2007on may be different from that of 2007sr. It is therefore interesting to compare the stellar populations of the two galaxies in which these two SNIa exploded. 2007on exploded in the elliptical galaxy NGC 1404 with an old stellar population, estimated to at 6-9 Gyr (Bregman & Lloyd-Davies, 2006; Li et al., 2007), while in the Antennae galaxy’s tidal tails a combination of a young (300 Myr) and an old (15 Gyr) population is found. Although Hibbard et al. (2005) conclude that the majority of stars belong to the old population, the SNIa rate per unit mass is about a factor 10 higher in young populations than in old ones (e.g. Sullivan et al., 2006), suggesting 2007sr may originate in a young population.
6 Conclusions
We have presented upper limits for the progenitor of the SNIa 2007sr that was recently discovered in the southern tail of the Antennae galaxy. The optical limits are close to some of the brightest Galactic accreting white dwarf binaries, but not yet deep enough to put constraints on the progenitor models. The X-ray limits are clearly probing the X-ray luminosities of the nearby supersoft X-ray sources, ruling out the brightest soft X-ray sources observed in external galaxies as progenitors of 2007sr. In addition, the limits rule out an object like the X-ray object found close to the position of the SNIa 2007on before the explosion unless that somehow is contaminated by hard photons from an unrelated source. If confirmed, this would lend support to the idea that there are different types of progenitors for these two SNIa, which together with the fact that the two SNIa exploded in completely different galaxies (merger versus elliptical) would support the suggestion that different aged stellar populations provide different progenitors. Our studies have shown that archival studies can put interesting constraints on the progenitors of for individual SNIa, but more importantly show the possibility to apply this method in a statistical way to a significant sample of SNIa.
Acknowledgments
We thank the Central Bureau for Astronomical Telegrams for providing a list of supernovae. This research has made use of data obtained from the Chandra Data Archive and software provided by the Chandra X-ray Center in the application package CIAO. Based on observations made with the NASA/ESA Hubble Space Telescope, obtained from the data archive at the Space Telescope Science Institute. STScI is operated by the Association of Universities for Research in Astronomy, Inc. under NASA contract NAS 5-26555. STSDAS is a product of the Space Telescope Science Institute, which is operated by AURA for NASA. Based on data obtained from the ESO Science Archive Facility. Based on observations made with ESO Telescopes at the La Silla or Paranal Observatories under programme ID 080.A-0516. We thank the referee, Filippo Mannucci, for comments that helped improve the paper. GN is supported by the Netherlands Organisation of Scientific Research. This research was supported by the DFG cluster of excellence “Origin and Structure of the Universe”. GR is supported by NWO Rubicon grant 680.50.0610 to G.H.A. Roelofs.
References
- Arabadjis & Bregman (1999) Arabadjis J. S., Bregman J. N., 1999, ApJ, 510, 806
- Baggett et al. (2002) Baggett S., et al., 2002, Technical Report v. 4.0, HST WFPC2 Data Handbook. STScI, Baltimore
- Bertin & Arnouts (1996) Bertin E., Arnouts S., 1996, A&AS, 117, 393
- Bianchi et al. (2005) Bianchi L., Thilker D. A., Burgarella D., et al., 2005, ApJ, 619, L71
- Bloom et al. (2007) Bloom J. S., Poznanski D., Modjaz M., Wood-Vasey M., Friedman A., Kirshner R. P., 2007, The Astronomer’s Telegram, 1343, 1
- Branch et al. (2004) Branch D., Baron E., Thomas R. C., Kasen D., Li W., Filippenko A. V., 2004, PASP, 116, 903
- Bregman & Lloyd-Davies (2006) Bregman J. N., Lloyd-Davies E. J., 2006, ApJ, 644, 167
- Cowley et al. (1998) Cowley A. P., Schmidtke P. C., Crampton D., Hutchings J. B., 1998, ApJ, 504, 854
- della Valle & Livio (1994) della Valle M., Livio M., 1994, ApJ, 423, L31
- Di Stefano & Kong (2004) Di Stefano R., Kong A. K. H., 2004, ApJ, 609, 710
- Di Stefano et al. (2004) Di Stefano R., Kong A. K. H., Greiner J., Primini F. A., Garcia M. R., Barmby P., Massey P., Hodge P. W., Williams B. F., Murray S. S., Curry S., Russo T. A., 2004, ApJ, 610, 247
- Drake et al. (2007) Drake A. J., Djorgovski S. G., Williams R., Mahabal A., Graham M. J., Christensen E., Beshore E. C., Larson S. M., 2007, Central Bureau Electronic Telegrams, 1172, 1
- Filippenko (1997) Filippenko A. V., 1997, ARA&A, 35, 309
- Greiner (2000) Greiner J., 2000, New Astronomy, 5, 137
- Han (2008) Han Z., 2008, ApJ, in press, ArXiv:0803.1986
- Hibbard et al. (2005) Hibbard J. E., Bianchi L., Thilker D. A., et al., 2005, ApJ, 619, L87
- Hibbard et al. (2001) Hibbard J. E., van der Hulst J. M., Barnes J. E., Rich R. M., 2001, AJ, 122, 2969
- Hillebrandt & Niemeyer (2000) Hillebrandt W., Niemeyer J. C., 2000, ARA&A, 38, 191
- Iben & Tutukov (1984) Iben Jr I., Tutukov A. V., 1984, ApJS, 54, 335
- Immler & Landsman (2007) Immler S., Landsman W., 2007, The Astronomer’s Telegram, 1342, 1
- Kahabka & van den Heuvel (1997) Kahabka P., van den Heuvel P. J., 1997, ARA&A, 35, 69
- Kassin et al. (2003) Kassin S. A., Frogel J. A., Pogge R. W., Tiede G. P., Sellgren K., 2003, AJ, 126, 1276
- Lanz et al. (2005) Lanz T., Telis G. A., Audard M., Paerels F., Rasmussen A. P., Hubeny I., 2005, ApJ, 619, 517
- Leibundgut (2000) Leibundgut B., 2000, A&A Rev., 10, 179
- Li et al. (2003) Li W., Filippenko A. V., Chornock R., Berger E., Berlind P., Calkins M. L., Challis P., Fassnacht C., Jha S., Kirshner R. P., Matheson T., Sargent W. L. W., Simcoe R. A., Smith G. H., Squires G., 2003, PASP, 115, 453
- Li et al. (2007) Li Z., Han Z., Zhang F., 2007, A&A, 464, 853
- Mannucci et al. (2006) Mannucci F., Della Valle M., Panagia N., 2006, MNRAS, 370, 773
- Maoz & Mannucci (2008) Maoz D., Mannucci F., 2008, MNRAS, submitted, ArXiv:0801.2898
- Mattila et al. (2005) Mattila S., Lundqvist P., Sollerman J., Kozma C., Baron E., Fransson C., Leibundgut B., Nomoto K., 2005, A&A, 443, 649
- McGowan et al. (2005) McGowan K. E., Charles P. A., Blustin A. J., Livio M., O’Donoghue D., Heathcote B., 2005, MNRAS, 364, 462
- Morrissey et al. (2005) Morrissey P., Schiminovich D., Barlow T. A., et al., 2005, ApJ, 619, L7
- Naito et al. (2007) Naito H., Sakane Y., Anan T., Kouzuma S., Yamaoka H., 2007, Central Bureau Electronic Telegrams, 1173, 1
- Nomoto (1982) Nomoto K., 1982, ApJ, 253, 798
- Nugent et al. (2002) Nugent P., Kim A., Perlmutter S., 2002, PASP, 114, 803
- Patat et al. (2007) Patat F., Chandra P., Chevalier R., Justham S., Podsiadlowski P., Wolf C., Gal-Yam A., et al., 2007, Science, 317, 924
- Perlmutter et al. (1999) Perlmutter S., Aldering G., Goldhaber G., et al., 1999, ApJ, 517, 565
- Phillips (1993) Phillips M. M., 1993, ApJ, 413, L105
- Pojmanski et al. (2008) Pojmanski G., et al., 2008, Central Bureau Electronic Telegrams, 1213, 1
- Predehl & Schmitt (1995) Predehl P., Schmitt J. H. M. M., 1995, A&A, 293, 889
- Riess et al. (1998) Riess A. G., Filippenko A. V., Challis P., et al., 1998, AJ, 116, 1009
- Roelofs et al. (2008) Roelofs G., Bassa C., Voss R., Nelemans G., 2008, MNRAS, submitted, arXiv:0802.2097
- Saviane et al. (2004) Saviane I., Hibbard J. E., Rich R. M., 2004, AJ, 127, 660
- Saviane et al. (2008) Saviane I., Momany Y., Da Costa G. S., Rich R. M., Hibbard J., 2008, ApJ, in press, ArXiv:0802.1045
- Scannapieco & Bildsten (2005) Scannapieco E., Bildsten L., 2005, ApJ, 629, L85
- Shimada & Yamaoka (2007) Shimada M., Yamaoka H., 2007, Central Bureau Electronic Telegrams, 1180, 1
- Sullivan et al. (2006) Sullivan M., Le Borgne D., Pritchet C. J., et al., 2006, ApJ, 648, 868
- Toomre & Toomre (1972) Toomre A., Toomre J., 1972, ApJ, 178, 623
- Tutukov & Yungelson (1981) Tutukov A. V., Yungelson L. R., 1981, Nauchnye Informatsii, 49, 3
- Umbriaco et al. (2007) Umbriaco G., Pietrogrande T., di Mille F., Agnoletto I., Harutyunyan A., Benetti S., 2007, Central Bureau Electronic Telegrams, 1174, 1
- Šimon (2003) Šimon V., 2003, A&A, 406, 613
- van den Heuvel et al. (1992) van den Heuvel E. P. J., Bhattacharya D., Nomoto K., Rappaport S. A., 1992, A&A, 262, 97
- Voss & Nelemans (2008) Voss R., Nelemans G., 2008, Nature, 451, 802
- Webbink (1984) Webbink R. F., 1984, ApJ, 277, 355
- Whelan & Iben (1973) Whelan J., Iben I. J., 1973, ApJ, 186, 1007
- Whitmore & Schweizer (1995) Whitmore B. C., Schweizer F., 1995, AJ, 109, 960
- Yoon et al. (2007) Yoon S.-C., Podsiadlowski P., Rosswog S., 2007, MNRAS, 380, 933