A Long Look at the Be/X-Ray Binaries of the Small Magellanic Cloud
Abstract
We have monitored 41 Be/X-ray binary systems in the Small Magellanic Cloud over 9 years using PCA-RXTE data from a weekly survey program. The resulting light curves were analysed in search of orbital modulations with the result that 10 known orbital ephemerides were confirmed and refined, while 10 new ones where determined. A large number of X-ray orbital profiles are presented for the first time, showing similar characteristics over a wide range of orbital periods. Lastly, three pulsars: SXP46.4, SXP89.0 and SXP165 were found to be misidentifications of SXP46.6, SXP91.1 and SXP169, respectively.
1 Introduction
The Small Magellanic Cloud (SMC) has become a fertile orchard of High-Mass X-ray Binaries (HMXBs), with 49 confirmed systems (Coe et al., 2005; McGowan et al., 2007). Given that, from extrapolation of the Milky Way’s population (and even correcting for the higher Be/B ratio in the SMC (Maeder et al., 1999)), one would expect to find only 3–4 systems, it is clear that the SMC is a special place where recent star formation has provided an abundance of HMXBs; indeed, the SFR/M (Star Formation Rate/Mass) of the SMC is 150 times that of the Milky Way (Grimm et al., 2003). Of particular significance is the fact that only one of these binary systems is not a Be/X-ray binary (SMC X-1 is the sole supergiant system discovered so far). This large number of Be/X-ray binary systems, conveniently located within the 3∘ 3∘area of the SMC, provides an unrivaled opportunity to study this population as a whole, as well as individually. With a 2∘ FWZI field of view, high timing resolution (1 s), and sensitive enough to detect the 1036 – 1038 luminosities typical of these systems when in outburst, the PCA instrument (Jahoda et al., 1996; Jahoda et al., 2005) on board RXTE is well suited for a long-term monitoring survey of the SMC.
The different types of X-ray activity displayed by Be/X-ray transient systems were classified by Stella et al. (1986) into the following categories:
-
–
Persistent low-luminosity X-ray emission (Lx 1036) or none detectable (in which case the system is said to be in quiescence).
-
–
Type I outbursts: Outbursts of moderate intensity (Lx 1036 – 1037) and short duration (a few days) generally recurring with the orbital period of the system and taking place at, or close to the time of periastron passage.
-
–
Type II outbursts: Giant X-ray outbursts (Lx 1037) lasting for weeks or months that generally show no correlation with orbital phase.
The data presented in this paper spans November 1997 – November 2006, and builds upon the work of Laycock et al. (2005), who analysed the first 4 years of data. Following is a brief description of the survey so far, which is still ongoing as of June 2007.
1.1 The survey
The initial observations of the SMC with RXTE began in 1997. The first observation took place in November of that year when an outburst detected by the ASM was missidentified as SMC X-3. It was RXTE’s second year of operation, and only SMC X-1, 2 and 3, SXP2.76 and SXP8.88 were known. From these initial observations it soon became apparent that there were more than 5 X-ray pulsars in the SMC. The observations carried out within the next year brought about the discovery of 5 new systems: SXPs 46.6, 59.0, 74.7, 91.1 and 169. Other pulsars were also discovered or detected with EINSTEIN, ASCA, BeppoSAX and ROSAT.
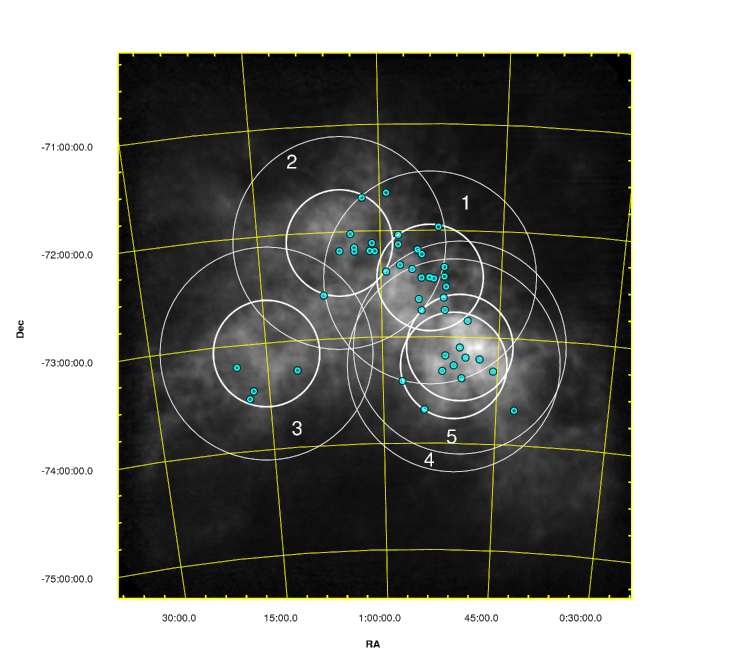
1999 marked the beginning of a coordinated survey of the SMC using the PCA. The PCA’s 2∘ field of view provides coverage of a wide area of the SMC, which allows many pulsars to be monitored with just one pointing. A number of different pointing positions have been used throughout the years and are given in Table 1 (see also Fig. 1); some of the less observed ones never received a name and are omitted from the table. The most frequently observed is Position 1 (later renamed to A), which has been the main pointing position since AO4, except during AO6 and AO7, when Position 5 was the main target. In total, the collected data spans 9 years.
| Name | RA (∘) | Dec (∘) |
|---|---|---|
| 1a | 00 52 07.8 | 72 25 43.3 |
| 1b | 00 51 04.0 | 72 13 44.0 |
| 1c (SMC X-3) | 00 54 54.8 | 72 26 40.9 |
| 1/A | 00 53 53.0 | 72 26 42.0 |
| 2 | 01 05 00.0 | 72 06 00.0 |
| 3 | 01 15 00.0 | 73 06 00.0 |
| 4 | 00 50 44.6 | 73 16 04.8 |
| 5 | 00 50 00.0 | 73 06 00.0 |
| B | 01 05 00.0 | 72 06 21.6 |
| C | 01 15 00.0 | 73 24 59.8 |
| D | 00 50 00.0 | 73 06 00.0 |
| X | 01 05 00.0 | 72 06 00.0 |
| SMC X-2 | 00 54 33.3 | 73 41 04.2 |
The survey has gone through various phases characterised by different observing positions and/or observing modalities. Phases 1 – 4 have already been described in Laycock et al. (2005) but they are outlined here again, together with the two latest phases not included in previous studies.
- Phase 1
- Phase 2
-
(AO4): Positions 1 – 4 were defined; Position 1 overlaps most of Positions 1a – c and contained the new pulsars, Positions 2 and 4 cover the rest of the bar of the SMC while Position 3 covers the area of the wing containing SMC X-1. A continued survey began at this point in time, with 3 ks observations being made once a week, mostly of Position 1, with some occasional looks at the other positions.
- Phase 3
-
(AO5 – AO6): Only Position 5 was monitored, and was done weekly so as not to create gaps in the data; the majority of the most active systems located in Position 1 also fell within the field of view of Position 5. Time allotted for the project was increased to an average of 5 ks per observation, thus providing better sensitivity to longer period pulsations.
- Phase 4
-
(AO7 – AO9): Weekly monitoring returned to Position 1, now renamed Position A, with additional observations of the other positions (B, C and D, which are very close to 2, 3 and 4, respectively) being made once a month. These monthly pointings were 15 ks, while the weekly ones were increased to 6 – 7 ks.
- Phase 5
-
(AO10): The time available for the monthly observations of alternate positions was invested into increasing the length of the weekly observations of Position A to 10 ks, this being the only monitored position.
- Phase 6
-
(AO11): Having mainly monitored the central bar of the SMC, it was decided to move to another location at the northeastern tip of the bar, near position B. This new location, Position X, was monitored for 10 ks weekly for 18 weeks, but was abandoned due to lack of pulsar activity. Observations then changed to Position D.
1.2 Data reduction
Cleaning of the raw light curves was achieved via a pipeline employing various FTOOLS111http://heasarc.gsfc.nasa.gov/ftools/ routines (Blackburn, 1995). Initial filtering required the data to come from observations offset from the target no more than 0.004∘, with an elevation above the Earth’s horizon of more than 5∘, and not taken during times of high background. Good Xenon mode data from the top anode layer only were used, within an energy range of 3–10 keV. Data were binned at 0.01 s intervals, while background files were generated in 16 s bins. For each time-step, the net flux was divided by the number of active PCUs to give the counts PCU. Then, the light curves time tags were corrected to the Solar System barycenter, removing timing variations caused by the satellite’s motion around the Earth and Sun. Finally, short light curves belonging to the same observation (which had been split up due to SAA passage, Earth occultation or flares) were pieced together into a long light curve spanning the whole observation.
1.3 Collimator correction
The collimator of each PCU consists of a number of hexagonal cells joined in a honeycomb structure. The hexagonal tubes are not perfectly parallel with the result that all the PCUs are slightly off center. Hence, the resulting collimator response pattern has an elliptical hexagon shape with the maximum throughput being slightly off center.
In order to account for differences in observed flux from a pulsar when observed at different pointing positions, a collimator correction was applied a posteriori to each pulsar’s count rate. A look-up table approach was used, where each pulsar had a collimator response calculated for each of the pointing positions used in the survey (see Table 1).
A pulsars with unknown position cannot be collimator corrected, so significant detections may not rise above the noise level in the long-term light curve unless the outbursts are very bright and/or the pulsar is located close to the center of the field of view. Type I outbursts may only appear bright when the pulsar is close to the center of the field of view (as with SXP59.0 in Position 1/A, Fig. 17), in which case the collimator correction is small anyway. To overcome this limitation pulsars with unknown positions had coordinates “guessed” for them on the basis of which observing positions they had been detected in throughout the mission; the coordinates assigned were approximately at the center of the region formed by the overlap of the observing positions in which it had been previously detected.
1.4 Data analysis
Once the cleaned light curve for an observation was obtained, it was run through a timing analysis package using the Lomb-Scargle method (Lomb, 1976; Scargle, 1982) and numerically implemented following the prescription by Press & Rybicki (1989). Two different power spectra were generated for each light curve, each spanning different period spaces (from to ), at different timing resolutions (), and pulsars were later searched for in their corresponding group according to their pulse period. The parameters used for each group are listed in Table 2. The reason for creating two groups was to obtain densely sampled periodograms at long periods without creating excessively large files. The parameters were chosen such that both groups would contain approximately the same number of independent frequencies, .
| Group 1 | Group 2 | |
|---|---|---|
| (s) | 0.5 | 10 |
| (s) | 1000 | 3000 |
| (Hz) | 10-5 | |
| Search range (s) | 0.5 – 40 | 40 – 3000 |
Once the periodograms were calculated, it was necessary to establish an objective way to determine which peaks in the power spectra were real; this is covered in Appendix A.
1.4.1 Pulsar Detection
Pulsars were searched for within the data using an algorithm specifically created for the task. Each light curve’s two power spectra were scanned to look for the pulsars in groups 1 and 2; the steps used were as follows:
-
Step
1: The highest peak (at a period ) above 90% global significance in the power spectrum is found and, either identified as a known pulsar, or flagged as an “unknown”.
-
Step
2: The light curve is folded at period to produce a pulse profile.
-
Step
3: Using the pulse profile as a template, the pulsations are then subtracted from the light curve and a power spectrum of the cleaned light curve is produced.
-
Step
4: This power spectrum is subtracted from the previous one to create a pulsar-specific power spectrum (or P2S2), which shows only the contribution of the individual pulsar to the power spectrum. This method allows one to see the possible harmonics that may have been lost in the noise or confused with the fundamental of another pulsar. The power of the fundamental and harmonic(s) peaks in the P2S2 is measured and a pulse amplitude estimated using Eq. (A5). The significance of the detection is taken to be the local significance of a peak of power equal to that which the detected signal would have if the power in the harmonics were concentrated in the fundamental.
-
Step
5: Repeat previous steps until all signals with peaks above 90% significance have been removed.
-
Step
6: To account for the remaining, dim pulsars, a stretch of the power spectrum centered on each pulsar’s nominal frequency, and with a total width which is different for each pulsar (and depends on the pulsar’s past period history), is searched for a peak. If no peak is found, then the significance of the detection is set to 0% and the amplitude to that of the average power within the region. If there is a peak, then the significance of the detection is set to the local significance and the amplitude of the pulsar calculated from the power in the peak according to Eq. (A4). No harmonics are searched for in this case.
1.4.2 Light Curve Generation and Porb Calculations
Once the amplitude of the pulsed flux for every pulsar in every observation had been measured, a long-term light curve was created for each system showing its X-ray activity over the course of the survey. It is important to note that these light curves do not show the absolute flux, but rather the pulsed flux. Without knowing the pulsar’s pulse fraction for each observation it is impossible to convert the pulsed flux amplitude into an absolute flux value. These light curves were then searched for periodicities, as the X-ray emission could show orbital modulations. Again, the Lomb-Scargle technique was employed, searching for periods in the appropriate range for each pulsar. In cases where Type II outbursts contaminated the Lomb-Scargle periodogram, these were removed from the data. In general, all bright outbursts were initially removed and only added back into the light curve if they coincided with the calculated ephemerides and their inclusion increased the significance of the calculated orbitla period. It is important to note that the collimator response correction was only applied to the data points whose local significance upon detection was , anything below this detection threshold was considered noise, and as such was not collimator corrected. § 2 shows the results of these analyses.
1.4.3 Orbital Profile Generation
Based on the ideas of de Jager et al. (1988) and Carstairs (1992), we used the Phase-Independent Folding (PIF) technique to create the orbital profiles. The method is as follows: the folded light curve is obtained from sets of -binned folded light curves. To begin with, the light curve is folded at the desired period and the time values converted to phase space (ranging from 0 to 1). This “raw” folded light curve is then binned into bins (of width ) in the standard way, with each bin starting at phase (with ). This step is repeated again, but this time the bins start at phase . In this way we create folded light curves from the same data, each consisting of bins, and only differing in the starting phase of these bins222We define at the time of the first data point in each observation.. The general expression for the phase at which each bin begins is . Now each folded light curve is further divided into sub-bins, such that in each light curve there will be groups of consecutive bins with the same flux value. The final folded light curve will have bins, each of which is the average of the bins from the sets of light curves. The error in each bin will be given by the standard error calculated from the values that were averaged for each -bin. In the present work we have used .
The PIF method provides an efficient way of generating folded light curves from poorly sampled data as their shape will not depend on the starting point at which they are folded and, although only every mth bin will be independent, spurious flux values within bins will be evened out while real features will remain. Thus, we obtain the benefits of both wide bins (sufficient counts in each bin for good statistics) and narrow bins (sensitivity to narrow features in the profile).
2 Results
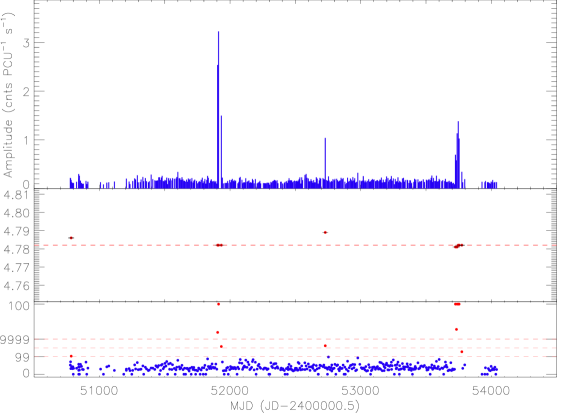
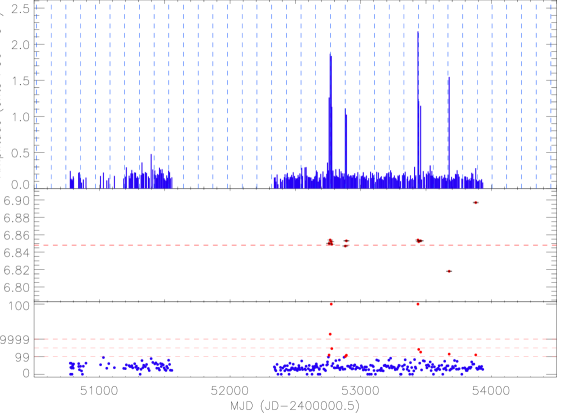
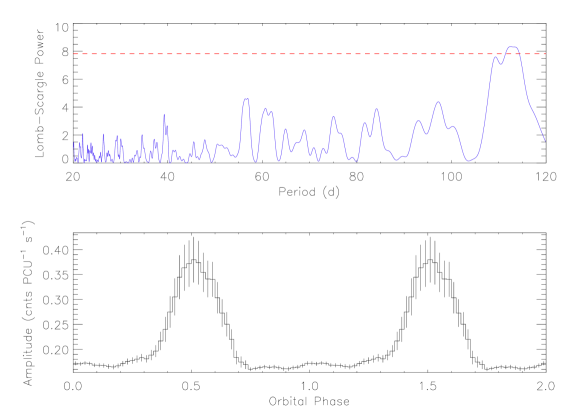
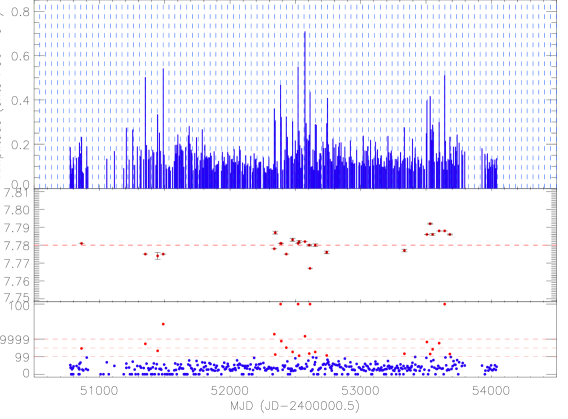
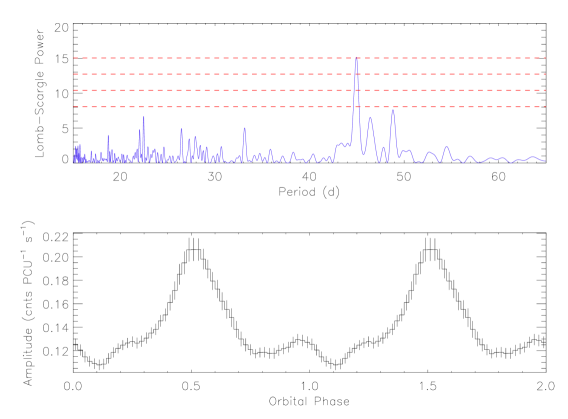
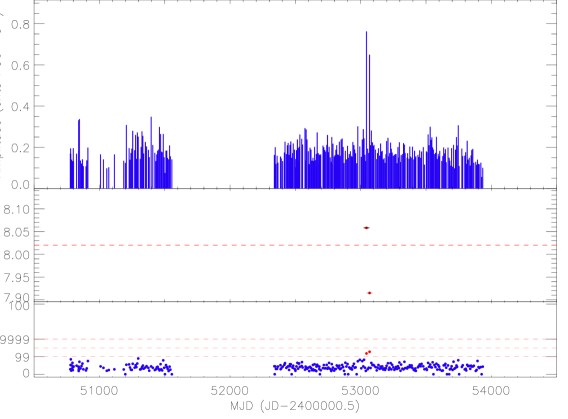
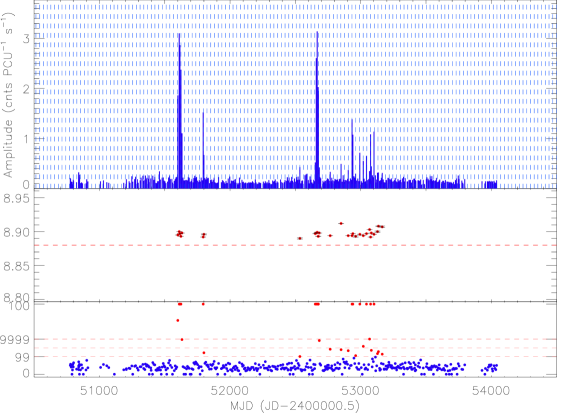
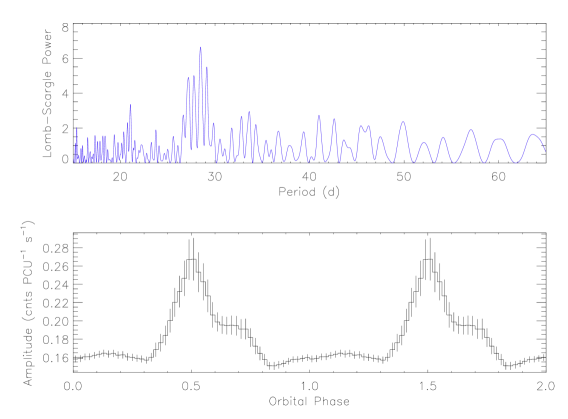
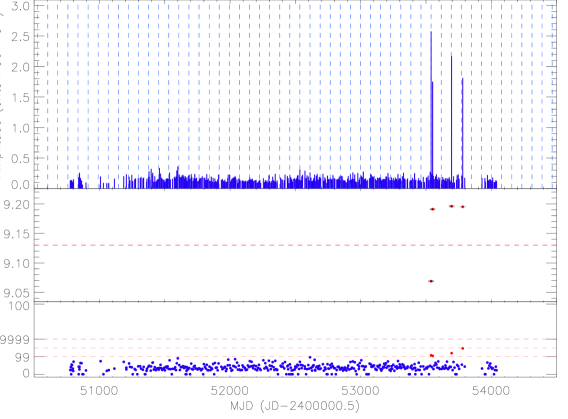
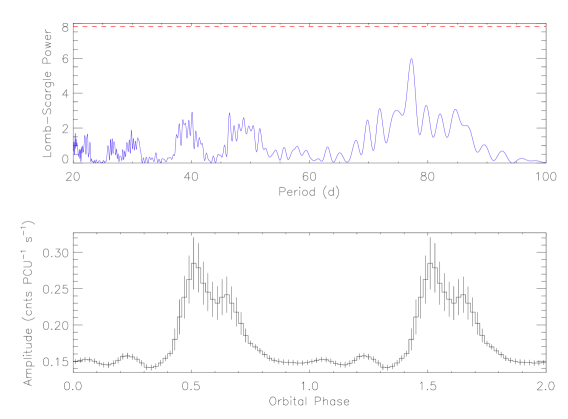
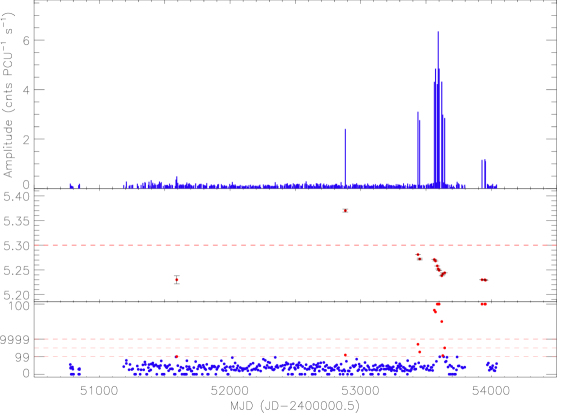
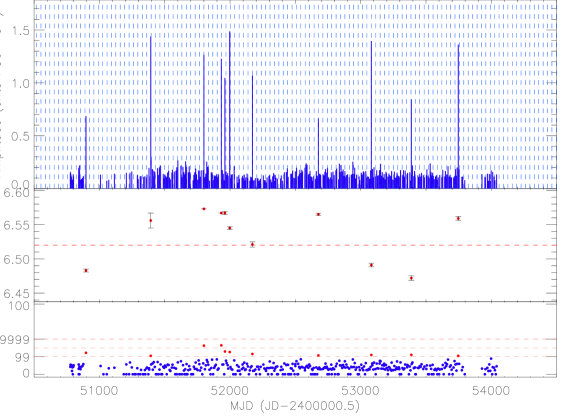
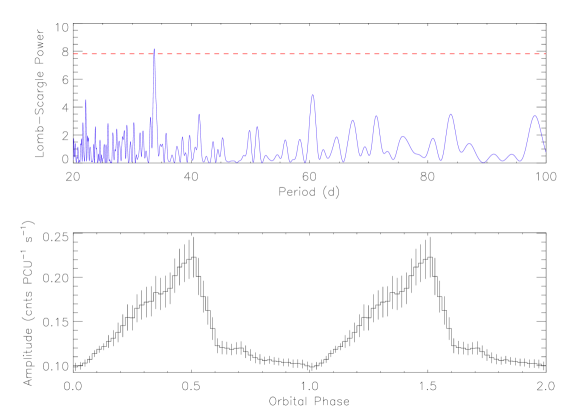
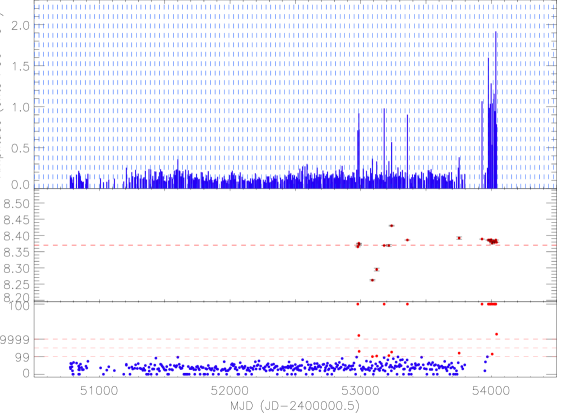
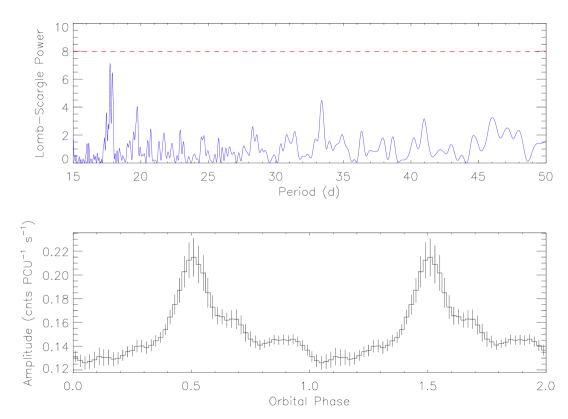
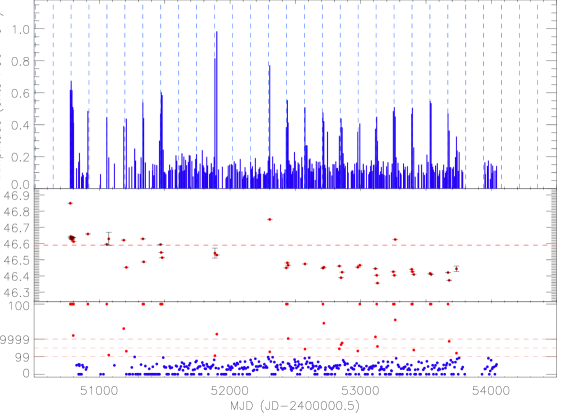
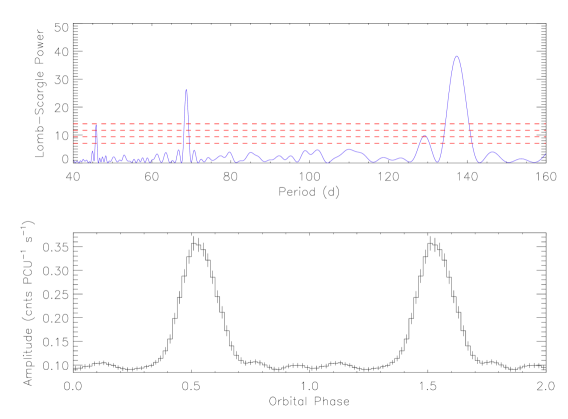
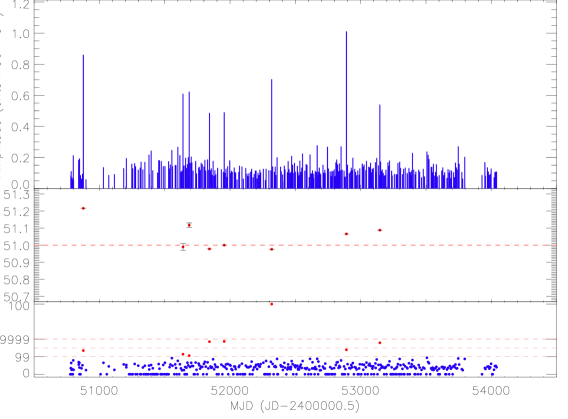
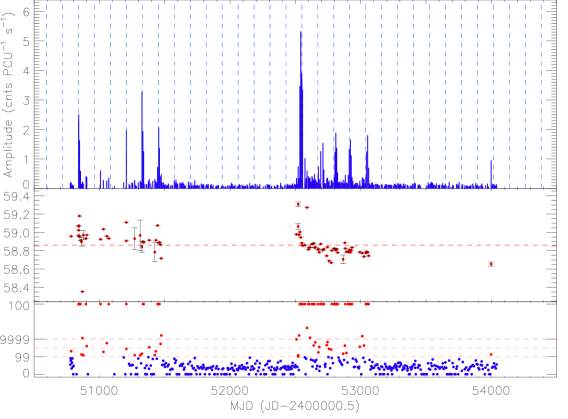
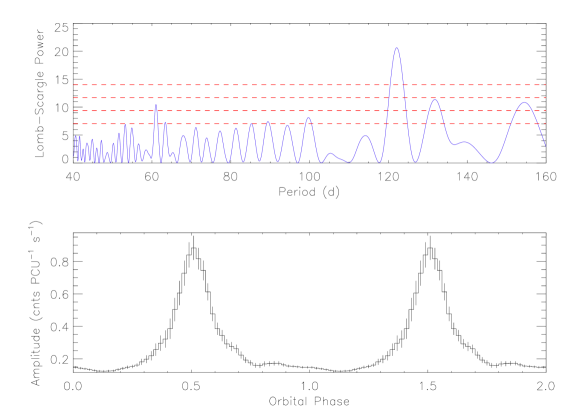
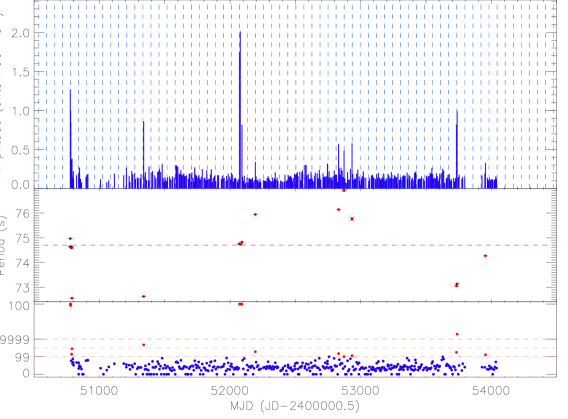
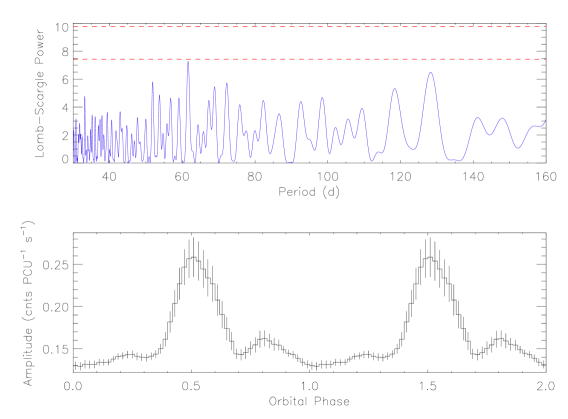
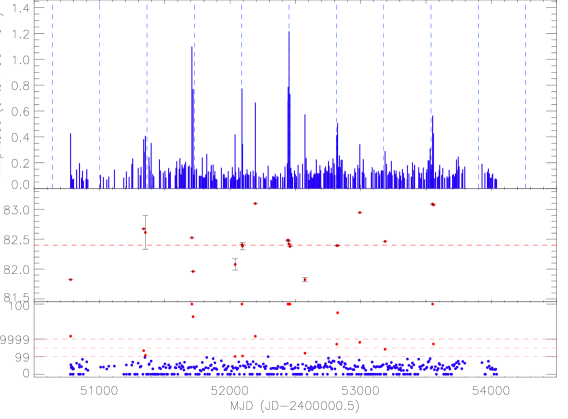
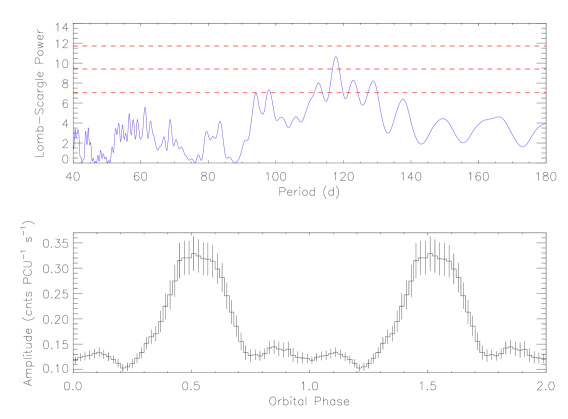
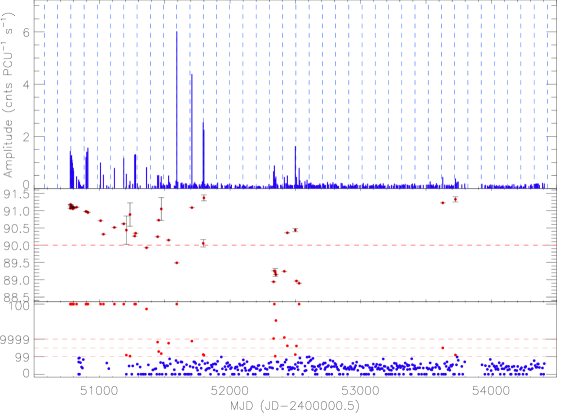
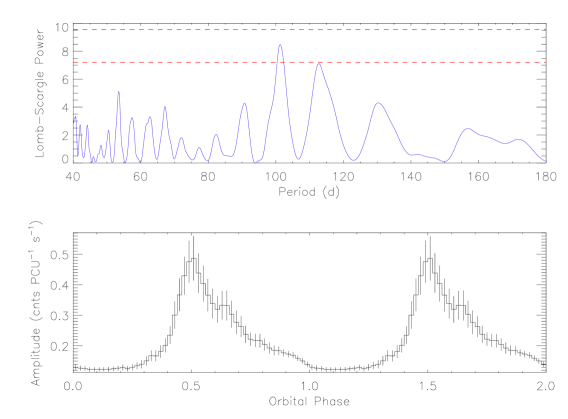
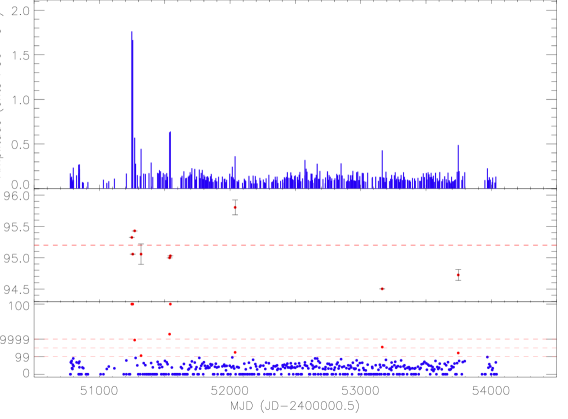
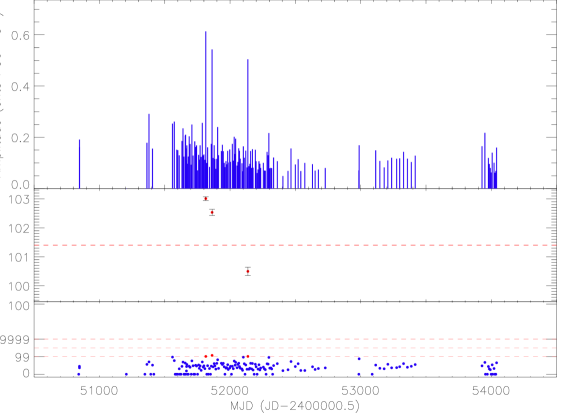
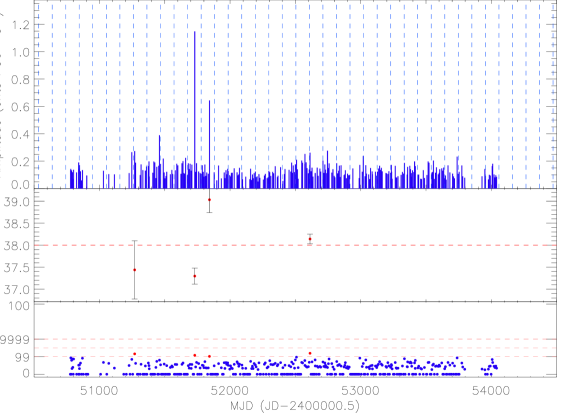
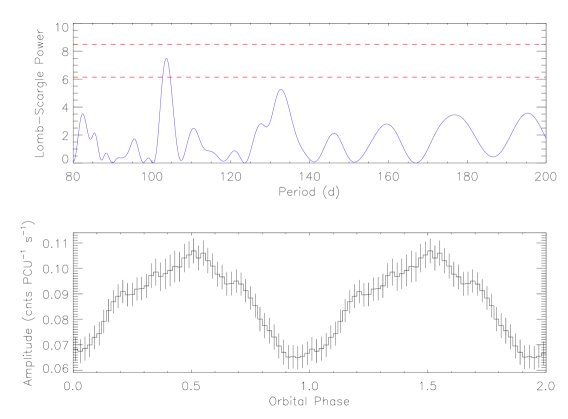
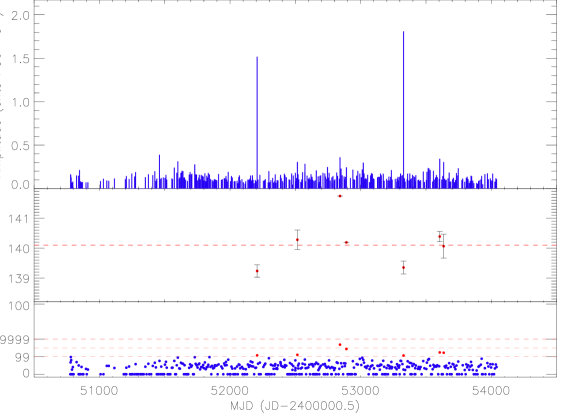
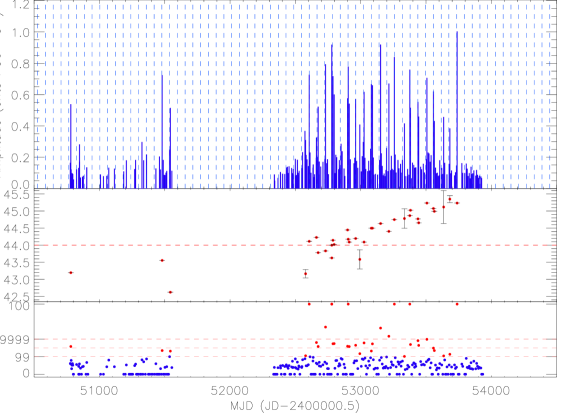
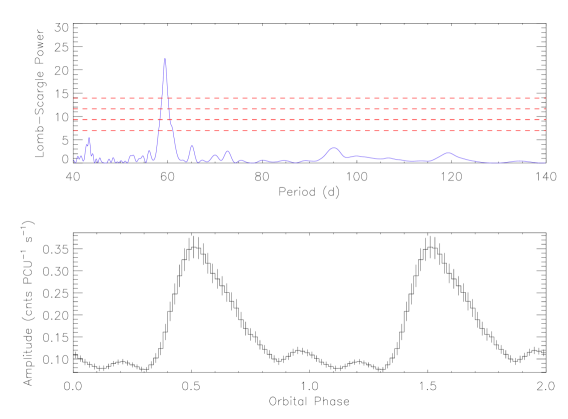
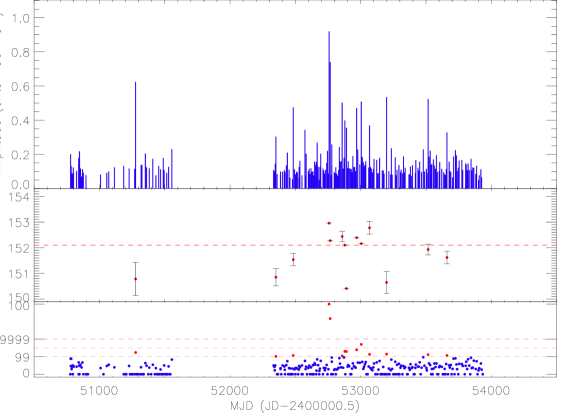
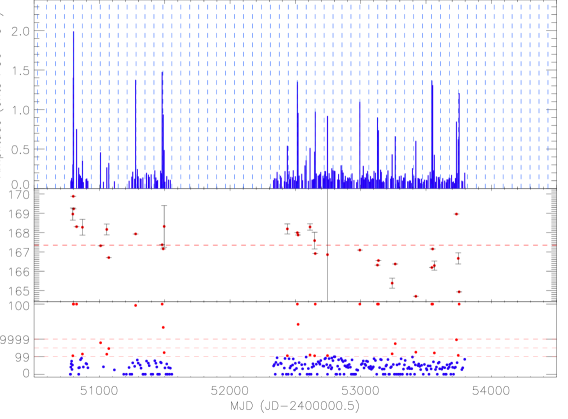
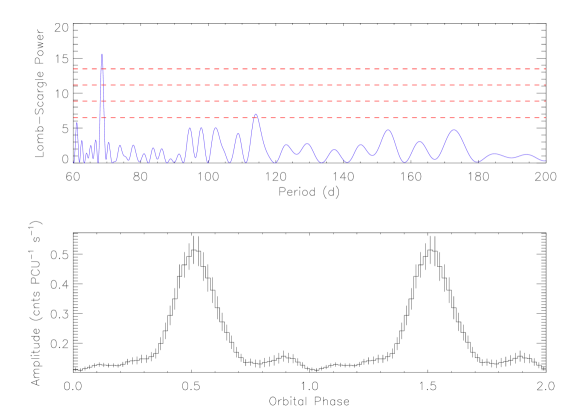
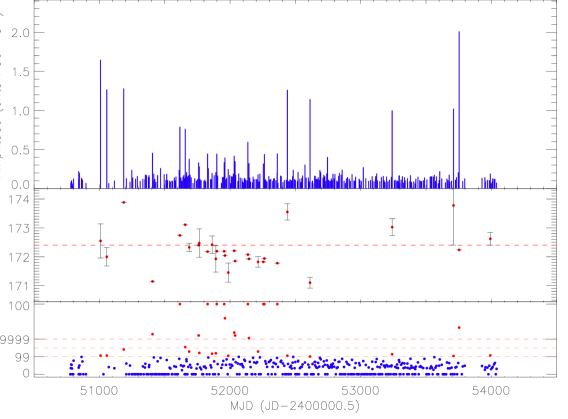
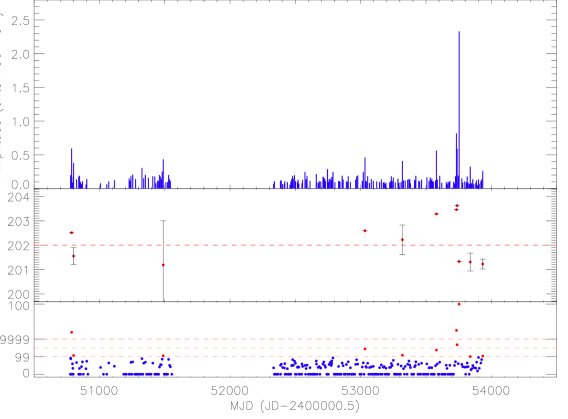
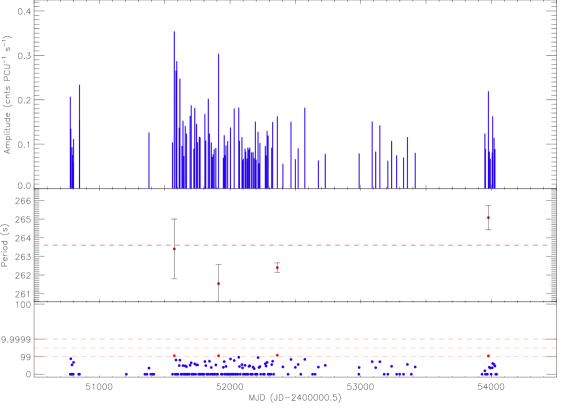
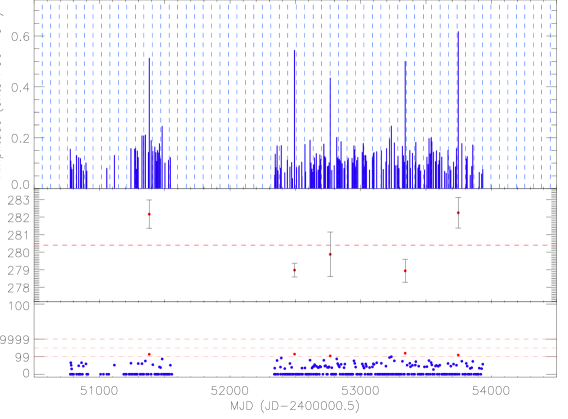
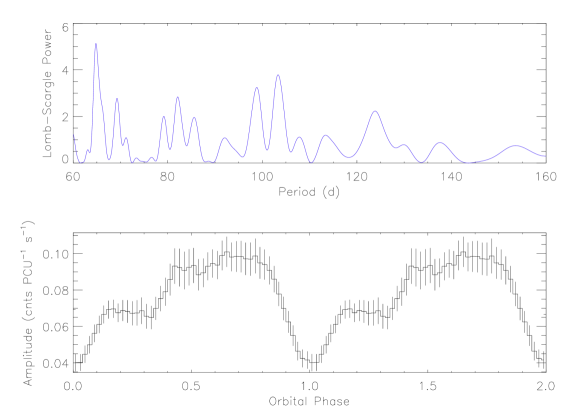
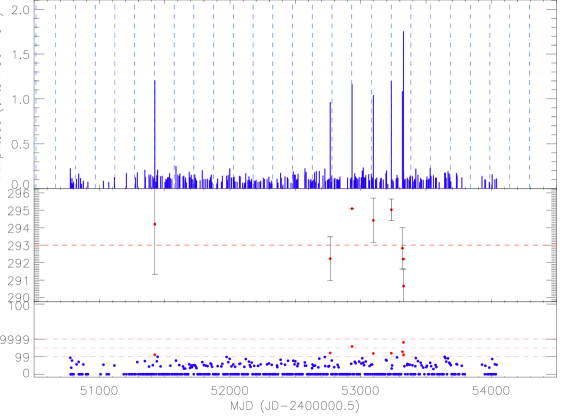
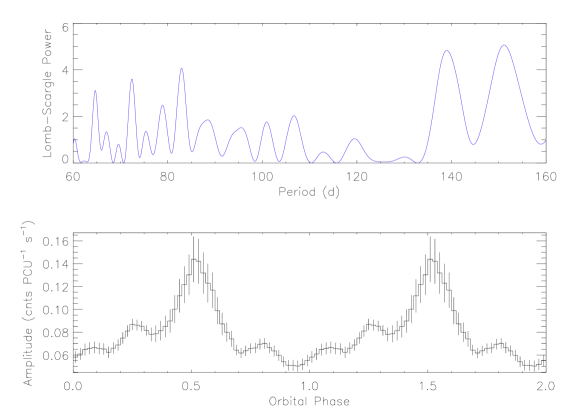
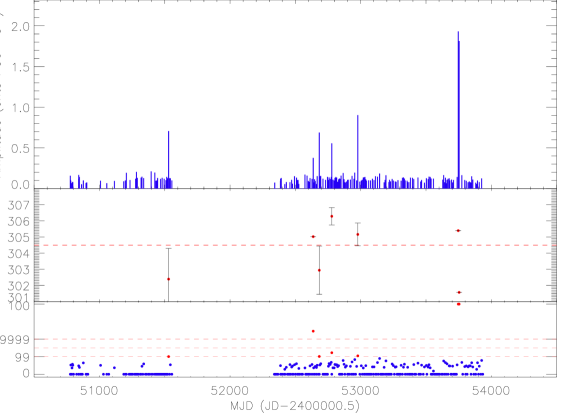
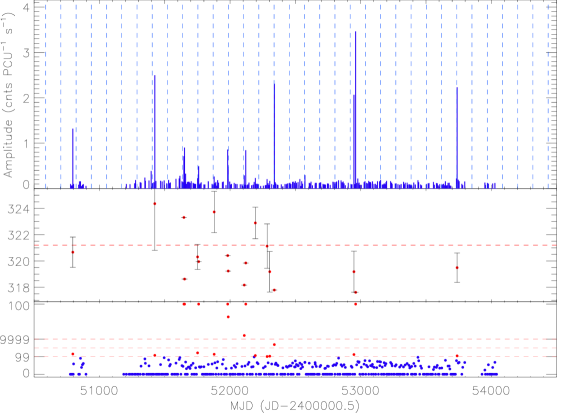
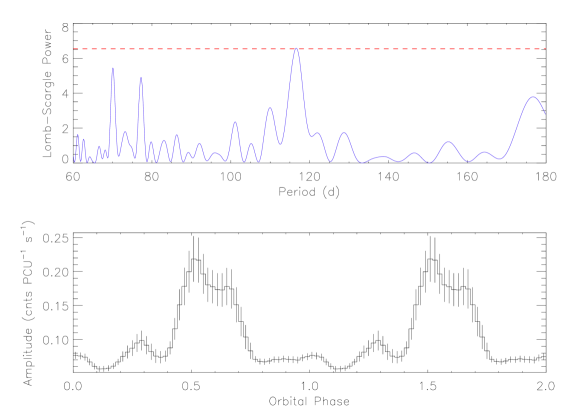
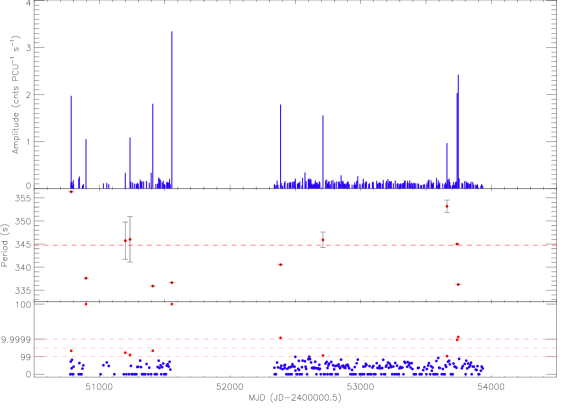
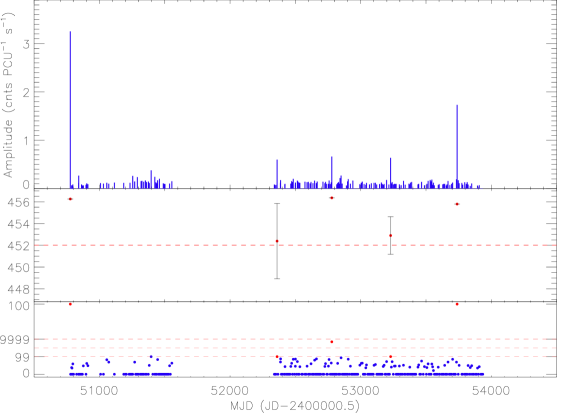
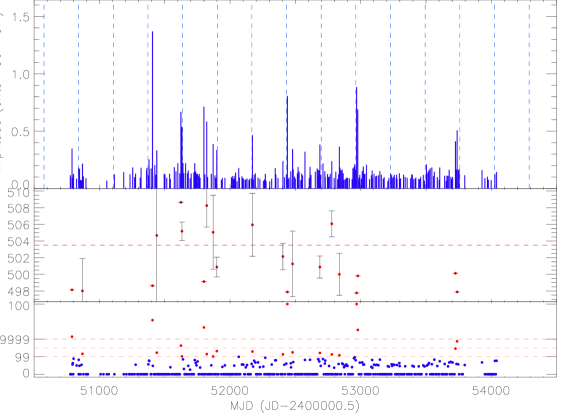
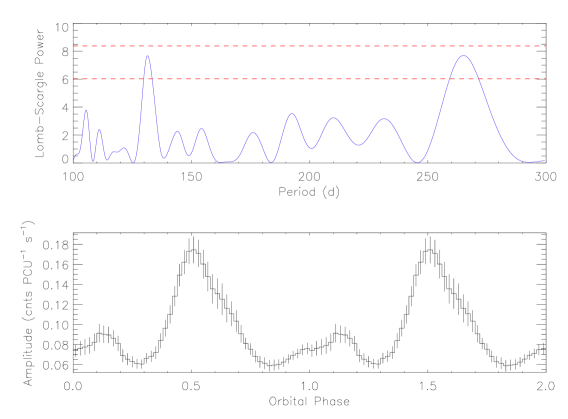
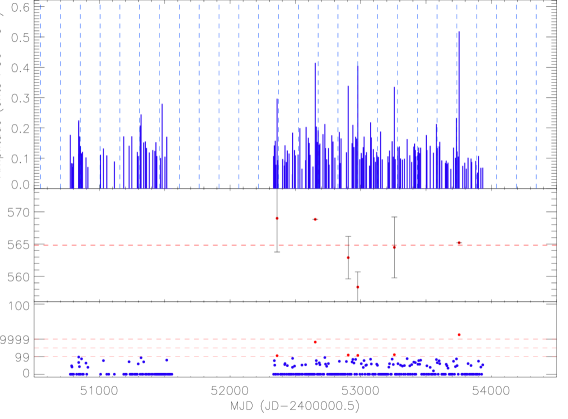
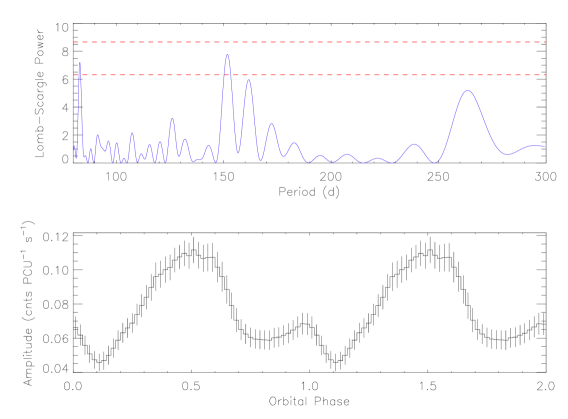
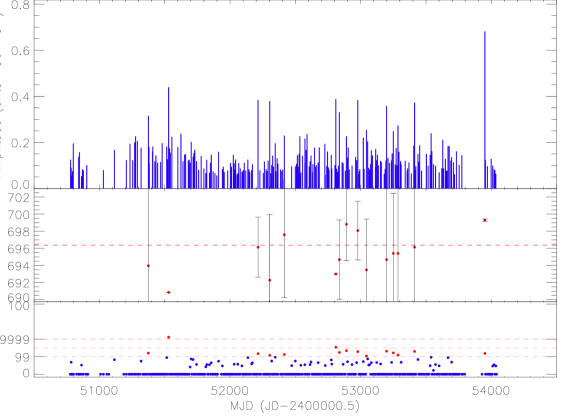
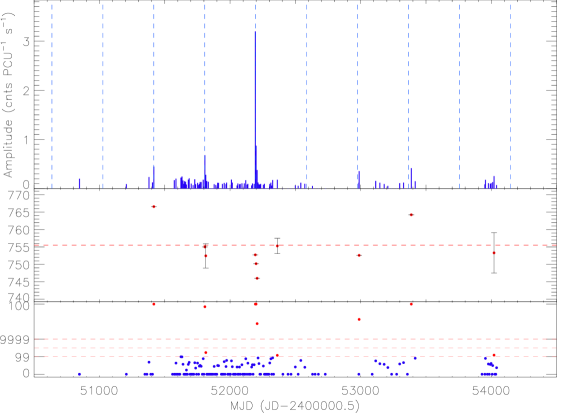
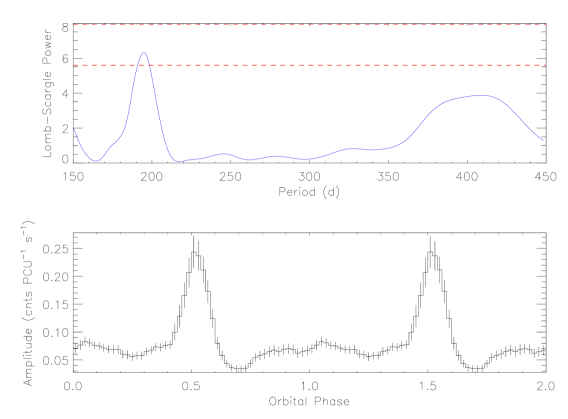
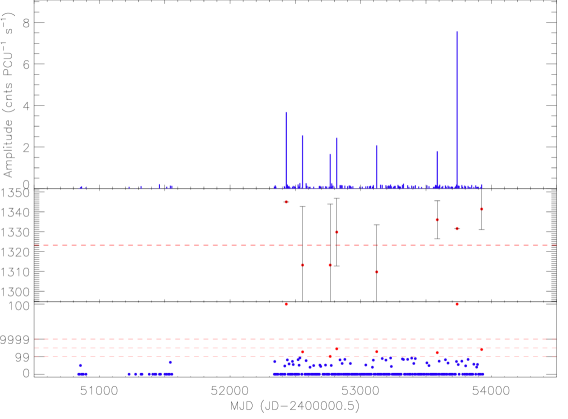
Following are the results obtained from the light curves of the observed SMC X-ray pulsars. In the triple-panel plots (generally the (a) plots), the top panel shows the X-ray activity of each pulsar through the amplitude of the pulsed flux, with each solid line representing one observation. When an orbital period has been found, the ephemerides for the dates of maximum flux are over plotted as dashed vertical lines; where the orbital period is less than 25 days, only every other line is plotted for clarity. The middle panel shows the period at which the pulsar was detected, with the horizontal dashed line denoting the center of the pulsar’s search range (note that only significant detections have their periods plotted). Finally, the bottom panel displays the significance of the neutron star’s pulsations for each observation, with the three horizontal dashed lines marking, from bottom to top, the levels of 99, 99.99 and 99.9999% local significance. We considered a pulsar had been detected when its local significance was . In the (b) plots we show the Lomb-Scargle periodogram of the pulsed flux light curve (top) and the light curve folded at the orbital period (bottom). When horizontal dashed lines are plotted on the periodogram, these represent different levels of significance, which are (from bottom to top) 99, 99.9, 99.99, and 99.999%. The coordinates given for each system are the most accurate at time or writing. When a Be/X-ray system has a confirmed optical counterpart, the coordinates of the counterpart are used. When no optical counterpart is known, but the system has been detected by Chandra and/or XMM, then it is the X-ray coordinates that were given. For some of the pulsars without an exact position, the coordinates provided by scans with RXTE are given; these are the least precise and have errors of up to several arc minutes.
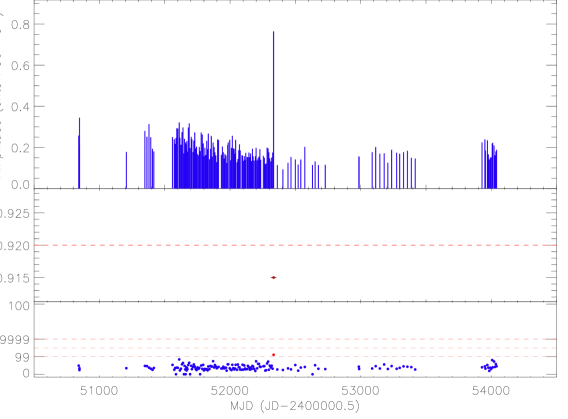
2.1 SXP0.92
PSR J00457319
RA 00 45 35, dec 73 19 02
History: First discovered as a radio pulsar by Ables et al. (1987) with a period of 0.926499 0.000003 s using the Parkes 64 m radio telescope. Kaspi et al. (1993) observed Doppler shifts in the pulse period which where consistent with a 51 d binary orbit with a companion star having mass . Optical observations of the field revealed a 16th magnitude, 11 M⊙, B1 main-sequence star, which is likely the companion (Bell, 1994).
Survey Results: SXP0.92 received 2 years of uninterrupted coverage during AO5 and AO6 (see Fig. 2), during which time it was only once detected above 99% local significance (MJD 52334). The power spectrum does not show any significant periods.
2.2 SXP2.16
XTE SMC2165 RA 01 19 00, dec 73 12 27
History: Discovered during the course of this survey by Corbet et al. (2003a) at 2.1652 0.0001 s.
Survey Results: Due to its position near SMC X-1 it has only been within the field of view on 3 occasions: MJD 51220, 51263 and 51310. It was on this last date that it was discovered (its only significant detection).
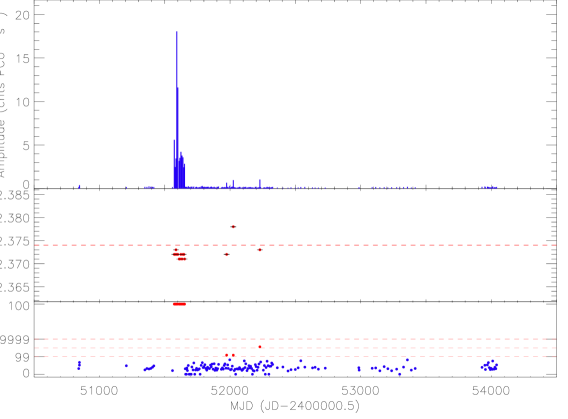
2.3 SXP2.37
SMC X-2
RA 00 54 34, dec 73 41 03
History: SMC X-2 was discovered in SAS-3 observations of the SMC carried out by Clark et al. (1978). Further outbursts were also observed by HEAO 1 and ROSAT, but no pulsations were detected until it was observed in the present survey by RXTE during a long outburst lasting from January through to May, 2000 (Corbet et al., 2001; Laycock, 2002).
Survey Results: After the aforementioned outburst, SMC X-2 was only detected on 3 further occasions (MJD 51974, 52025 and 52228), but at a much lower flux of F 1 counts PCU(see Fig. 3). Lomb-Scargle analysis of the data following the major outburst shows no clear periods.
2.4 SXP2.76
RX J0059.27138
RA 00 59 11.7, dec 71 38 48
History: First reported by Hughes (1994) from a ROSAT observation showing 2.7632 s pulsations that varied greatly with energy. In the low-energy band of the ROSAT PSPC (0.07 – 0.4 keV) the source appears almost unpulsed while in the high-energy band (1.0 – 2.4 keV) the flux is 50% pulsed. Its optical counterpart was confirmed as a 14th magnitude Be star by Southwell & Charles (1996). Schmidtke et al. (2006) report a period of 82.1 d with a maximum at MJD 52188.9 from analysis of OGLE III data.
Survey Results: This source is near the edge of the field of view of Position 1/A so we would expect to detect only the brighter outbursts. Only 2 detections were made (MJD 52527 and 53327) and no orbital period can be extracted from the X-ray data (see Fig. 4). We find no power at the reported optical period and note that the two X-ray detections occured 10 days after and 11 days before the optical ephemeris’s predicted maximum.
2.5 SXP3.34
AX J0105722, RX J0105.37210
RA 01 05 02, dec 72 11 00
History: Was reported as an ASCA source with 3.34300 0.00003 s pulsations by Yokogawa & Koyama (1998c). Its optical counterpart is proposed to be [MA93] 1506 (Coe et al., 2005), who also find an 11.09 d modulation in MACHO data. Although this could be the orbital period of the system (as it falls within the expected range on the Corbet diagram (Corbet, 1984)), Schmidtke & Cowley (2005a) report the find of a strong 1.099 d period in MACHO data and that the 11.09 d value is an alias of this main period. They attribute the modulation to non-radial pulsation in the Be star.
Survey Results: There have been no significant detections of the pulsar during this survey and timing analysis of the light curve reveals no clear periodicities.
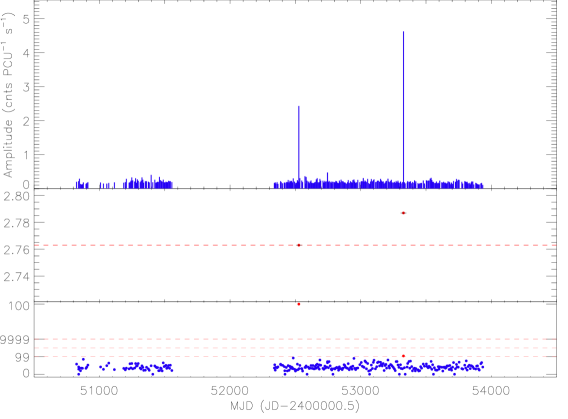
2.6 SXP4.78
XTE J0052723
RA 00 52 06.6, dec 72 20 44
History: Was discovered by the present survey in late December 2000 and reported in Laycock et al. (2003), where [MA93] 537 was proposed as the optical counterpart. Another possible counterpart is suggested in Coe et al. (2005) as the star AzV129 is found to have a 23.9 0.1 d period in both MACHO colours, which would agree with the expected orbital period inferred from the Corbet diagram.
Survey Results: SXP4.78 was detected on one occasion after its initial outburst (MJD 52729) at a much weaker F 0.8 counts PCU. It then began a relatively long, bright (peaking at 1.2 counts PCU) outburst on December 21, 2005 (MJD 53725) that lasted 7 weeks (see Fig. 5). Despite the long outburst, no orbital modulation is apparent. Timing analysis using all the data finds no periods, while analysis of the data outside the two bright outbursts suggests a weak period at 34.1 d
A 1 ks observation with Chandra was carried out on March 3rd 2006 in an attempt to establish the pulsar’s coordinates. Unfortunately, the outburst had ended and no source was detected within the RXTE error box provided by Laycock et al. (2003).
2.7 SXP6.85
XTE J0103728
RA 01 02 53.1, dec = 72 44 33
History: First detected in April 2003 with a pulse period of 6.8482 0.0007 s (Corbet et al., 2003b). It was detected in outburst with XMM on October 2nd 2006, which provided a more accurate position (Haberl et al., 2007). This allowed its optical counterpart to be identified as a Be star with V = 14.59, with a possible 24.82 d periodicity (Schmidtke & Cowley, 2007).
Survey Results: It has been detected on 3 other occasions (circa MJD 52885, 53440 and 53677) at varying fluxes (F 0.8 – 1.8 counts PCU), but high above the noise level (see Fig. 6). Lomb-Scargle analysis of the data outside the 4 bright detections shows no significant period. When including these outbursts, we find a significant period of 112.5 d; this is the minimum time lapse between any two outbursts and probably drives the result. Given its pulse period, and based on the spin-orbit relation, we do not discard the possibility that the real orbital period be or of this value. The current X-ray ephemeris is MJD 52318.5 7.9 + n 112.5 0.5 d. We note that the outburst detected on October 2nd 2006 (MJD 54010) is consistent with the proposed ephemeris.
2.8 SXP7.78
SMC X-3
RA 00 52 05.8, dec 72 26 03.2
History: Originally detected by Clark et al. (1978), it was not identified with the previously detected RXTE 7.78 s source until 2004 (Edge et al., 2004a). Corbet et al. (2003c, 2004b) proposed an orbital period from a series of recurrent X-ray outbursts (in the present survey) of 45.1 0.4 d. An optical modulation in MACHO data was reported by Cowley & Schmidtke (2004) (44.86 d) and Coe et al. (2005) (44.6 0.2 d); Edge (2005d) also found a strong 44.8 0.2 d modulation in the OGLE counterpart, present even when there was no significant X-ray activity.
Survey Results: It has displayed in the past 10 years 3 distinct periods of outbursts (F 0.3 counts PCU), lasting 200 – 400 d (see Fig. 7(a)). Timing analysis of the complete light curve reveals a clear period at 44.92 d; the ephemeris we derive is MJD 52250.9 1.4 + n 44.92 0.06 d. The folded light curve may show evidence of detections at apastron. During the longer of the outburst episodes (circa MJD 52500) the pulsar shows some spin up, about s s-1, implying Lx 2.3 1037 (B 3.6 1012 G). This pulsar is unique in that, despite the spin up observed during each of the individual outburst episodes, the overall spin evolution seems to show a long-term spin down.
2.9 SXP8.02
CXOU J010042.8721132
RA 01 00 41.8, dec 72 11 36
History: Proposed as the first anomalous X-ray pulsar (AXP) in the SMC by Lamb et al. (2002), they found the source to have displayed little variability in the past 20 years. It is characterised by a very soft spectrum and low luminosity ( 1.5 1035).
Survey Results: During AO5 and AO6 it was outside the field of view of our observations. Coverage from AO7 onwards has been good and timing analysis of these dates shows a possible periodicity at 23.2 d, which is likely driven by the only two clear detections, separated by that time range (see Fig. 8). This period disappears when removing these two detections from the data. If SXP8.02 is truly an anomalous pulsar, it is not expected to show periodicity in its X-ray emission. The two significant detections were observed at around Lx = 5.0 1036 (unabsorbed, assuming a 50% pulse fraction and a power law spectrum of ).
2.10 SXP8.88
RX J0051.87231, 1E0050.17247, 1WGA J0051.87231
RA 00 51 52.0, dec 72 31 51.7
History: Israel et al. (1997) detected this source several times between 1979 and 1993. A number of optical counterparts have been proposed, and Haberl & Sasaki (2000) believe [MA93] 506 to be the correct one. From a number of outbursts during July 2003 – May 2004 Corbet et al. (2004a) derived an orbital ephemeris of MJD 52850 2 + n 28.0 0.3 d. Schmidtke & Cowley (2006) find an optical period of 33.4 d in OGLE and MACHO data. Note: This system was incorrectly named SXP8.80 in Coe et al. (2005).
Survey Results: Two Type II outbursts together with the aforementioned series of Type I outbursts have been detected (see Fig. 9). A period of 28 d is found using Lomb-Scargle analysis on the data not containing the Type II outbursts, similar to the value from Corbet et al. (2004a). The new ephemeris from the survey data is MJD 52392.2 0.9 + n 28.47 0.04 d. We note that the two Type II outbursts began roughly at the times of expected maximum flux, lasted about 1 orbit, and peaked 0.5Porb later. This could be explained by a number of scenarios: a) The neutron star forms an accretion disc around periastron, which it consumes throughout the orbit; b) an accretion disc is formed around periastron which is accreted onto the neutron star along the orbit at the same time as wind accretion (which would peak around apastron) is taking place; c) the Be star ejects matter forcefully enough that it moves outwards as an annulus and the neutron star is able to capture material along its orbit as it moves away from the Be star, but capture decreases as soon as it passes apastron.
None of these scenarios completely explain the behaviour of the X-ray emission during the Type II outbursts. If a) is correct, then why would accretion become greatest at apastron on both occasions. Scenario c) suffers a similar drawback as it would require the annulus to move at similar speeds on both outbursts in order for the outburst to peak precisely at apastron. Scenario b) would require a very dense wind in order for its accretion to be comparable to disc accretion. Simultaneous observations of this system in the X-ray and the optical during an outburst would help clarify this behaviour.
2.11 SXP9.13
AX J0049732, RX J0049.27311
RA 00 49 13.6, dec 73 11 39
History: Discovered during an ASCA observation in November 1997 (MJD 50765), pulsations were detected at 9.1321 0.0004 s and Lx = 3.3 1035 (Imanishi et al., 1998). There has been much debate as to which is the correct optical counterpart to this source, Schmidtke et al. (2004) and Filipović et al. (2000) identify it with the ROSAT source RX J0049.57310 but Coe et al. (2005) conclude that it is a H source coincident with RX J0049.27311. Timing analysis of the OGLE data shows a peak at 40.17 d and its probable harmonic at 20.08 d (Edge, 2005d). It should be noted that Schmidtke et al. (2004) find a 91.5 d or possibly an 187 d period for RX J0049.57310. It was detected by ASCA on one further occasion on MJD 51645 at Lx = 1.9 1035 (Yokogawa et al., 2003).
Survey Results: Although coverage of this source has been very complete, it has only been detected in outburst 3 times (circa MJD 53545, 53700 and 53780). Lomb-Scargle analysis of data prior to this date shows power at a period of 77.4 d; when analysing the whole data set, the most significant peak is at 77.2 d (Fig. 10(b)). In both cases the ephemerides agree with the 3 outbursts (Fig. 10(a)), which strongly suggests this could be the orbital period of the system. However, it should be noted that this value is different from the reported optical periods. The ephemeris we derive is MJD 52380.5 2.3 + n 77.2 0.3 d. The above reported ASCA detections did not find the system in outburst and cannot be used to ratify this ephemeris.
2.12 SXP15.3
RX J0052.17319
RA 00 52 14, dec 73 19 19
History: Lamb et al. (1999) found 15.3 s pulsations in ROSAT and BATSE data from 1996. They estimate the luminosity to be 1037 with a pulse fraction of 27%. Edge (2005d) finds an ephemeris of MJD 50376.1 + n 75.1 0.5 d describes the modulation in the MACHO and OGLE light curves. It should be noted that this ephemeris is likely driven by the large 1996 X-ray outburst which is clearly visible in the OGLE data; this Type II outburst peaked around MJD 50375.
Survey Results: There was a very minor detection of SXP15.3 in February 2000 (MJD 51592), and a more significant one in August 2003 (MJD 52883) at F 1.6 counts PCU (see Fig. 11). Two more bright detections separated by 13 days occurred in March 2005 (circa MJD 53445); then, on July 12th (MJD 53564) a very bright outburst began, lasting until October 17th (MJD 53661, 100 days long). During this time the pulsed flux oscillated between 2.0 and 5.6 counts PCU. A clear spin up is detected up until September 15th, when the period started increasing. The maximum period change was over the course of 56.68 d, giving a s s-1. We derive the expected luminosity (see Appendix B for method) from such a level of spin up (if it were all intrinsic with no orbital contribution) to be Lx 8.6 1037 (B 1.5 1013 G).
It is likely this outburst lasted for more than one orbital cycle (expected to be 30 – 50 d from the Corbet diagram) so some orbital modulation might be visible in the period data. An attempt was made to fit these data to an orbital model with constant global spin up, and also with a piece-wise approach where the spin up varies throughout the outburst (following the method outlined in Wilson et al. (2003)). Although no definite value was found, variations in the period curve suggest a period of 28 d.
Timing analysis of the data outside the long outburst revealed no periodicities. Furthermore, the optical ephemeris proposed by Edge (2005d) does not agree with any of the detections for this source.
2.13 SXP16.6
XTE J0050731
No position available
History: Discovered with a deep 121 ks observation taken for this survey in September 2000. It was initially misidentified as RX J0051.87310 but later disproved Yokogawa et al. (2002), and so SXP16.6 remains unassociated with any known source, although it is often still mistakenly referred to as RX J0051.87310.
Survey Results: There have been a large number of detections of SXP16.6, and Lomb-Scargle analysis finds a strong modulation at 33.72 d (see Fig. 12(b)), which we propose as the orbital period of the system. The ephemeris is MJD 52373.5 1.0 + n 33.72 0.05 d.
2.14 SXP18.3
XTE J0055727
RA 00 50, dec 72 42
History: Reported by Corbet et al. (2003e) from observations in November/December 2003. An approximate position was established from scans with RXTE’s PCA (Corbet et al., 2003e). No optical counterpart has yet been identified. A number of further outbursts between May – October 2004 provide an ephemeris of MJD 53145.7 1.3 + n 34.6 0.4 d from O-C (observed vs. calculated) orbital calculations (Corbet et al., 2004d).
Survey Results: A long, bright outburst began around MJD 53925 (July 2006), which was ongoing as of January 2007 (see Fig. 13(a)). Lomb-Scargle analysis of data prior to this outburst finds a peak at 17.73 d, which is the period proposed by Corbet et al. (2004d). We find no significant power at this period and note that some of the significant detections do not agree with it. Thus, the new ephemeris for this system is MJD 52275.6 0.9 + n 17.73 0.01 d.
2.15 SXP22.1
RX J0117.67330
RA 01 17 40.5, dec 73 30 52.0
History: Discovered with ROSAT as an X-ray transient in September 1992 (Clark et al., 1996), its companion was identified as a 14.2 magnitude OB star by Charles et al. (1996). It was observed with ROSAT again in October, but no pulsations were detected (Clark et al., 1997) The companion’s classification as a Be (B1-2) star was confirmed by Coe et al. (1998). 22 s pulsations were finally detected in ROSAT and BATSE data by Macomb et al. (1999).
Survey Results: There are only 3 observations of this pulsar’s region and it was not significantly detected in any of them.
2.16 SXP31.0
XTE J0111.27317, AX J0111.17316
RA 01 11 09.0, dec 73 16 46.0
History: Was simultaneously discovered by RXTE and BATSE during a giant outburst that began late October 1998 (Chakrabarty et al., 1998; Wilson & Finger, 1998). Schmidtke et al. (2006) report a 90.4 d periodicity in OGLE III data.
Survey Results: Being in the same field as SMC X-1, it was only observed 3 times, the first during the end of the aforementioned giant outburst. The two detections are 43 days apart and a spin up of 0.4 s is measured, which implies a luminosity of Lx 2.7 1038. As Laycock et al. (2005), in an in depth spectral analysis of these observations, derive a value of Lx 4.6 1037, we can assume we are seeing Doppler shifted periods due to orbital motion. No further information can be derived from these observations.
2.17 SXP34.1
RX J0055.47210
RA 00 55 26.9, dec 72 10 59.9
History: Discovered in archival Chandra data at 34.08 0.03 s and lying 0.6 arcsec from a known ROSAT source (Edge et al., 2004d; Edge et al., 2004c).
Survey Results: Only two significant detections are seen (MJD 50777 and 53690) and no clear periods can be found with timing analysis (see Fig. 14).
2.18 SXP46.6
XTE J0053724, 1WGA 0053.87226
RA 00 53 58.5, dec 72 26 35
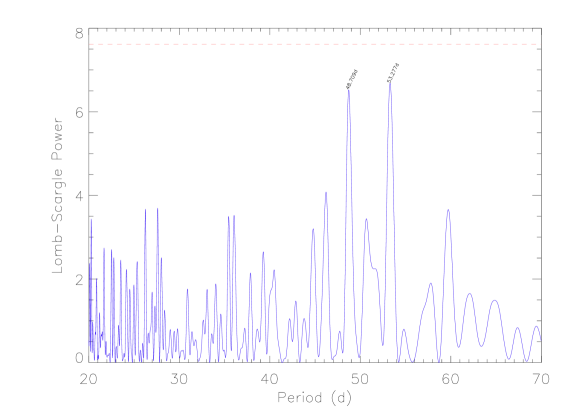
History: Discovered in the first observation of this survey (November 25th 1998) with a period of 46.63 0.04 s while it was undergoing a long outburst (Corbet et al., 1998). Laycock et al. (2005) derive a period of 139 6 d from 6 X-ray outbursts in the earlier part of this survey. Two candidates for the optical counterpart were proposed by Buckley et al. (2001). Schmidtke et al. (2007) confirm it is star B and find two periods in OGLE data: 69.2 0.3 d and 138.4 0.9 d; they suggest the possibility that the orbital period is the shorter or the two values.
Survey Results: The source was thought to be inactive after January 2002. In the meantime a new SMC pulsar with a 46.4 s period was announced (Corbet et al., 2002). Lomb-Scargle analysis of both pulsars revealed the same orbital periods and very similar ephemeris, suggesting they were the same pulsar which has been slowly spinning up (Galache et al., 2005). The estimated luminosity required for a spin up of s s-1 during MJD 50800 – 51900 is Lx 9.9 1035 (B 6.0 1012 G), and for a s s-1 during MJD, Lx 4.4 1035 (B 4.0 1012 G). The ephemeris of the outbursts is now best described by MJD 52293.9 1.4 + n 137.36 0.35 d (see Fig. 15(a)). Although the folded light curve shows a small increase in flux half a phase away from maximum, we do not believe this is evidence that the orbital period is half the calculated value. Given the clear, regular outbursts experienced by this system throughout the survey we believe the true orbital period is 137 d.
2.19 SXP51.0
SMC 51
No position available
History: Was erroneously proposed as a new 25.5 s pulsar in Lamb et al. (2002) from a deep 121 ks observation. Laycock (2002) identifies the 25.5 s peaks in the power spectrum as harmonics of SXP51.0’s true pulse period. No position is available; it lies within Position 4, and most likely in the overlap between Positions 1/A and 4.
Survey Results: Despite numerous significant detections (see Fig. 16), timing analysis finds no strong periodicities in the light curve.
2.20 SXP59.0
XTE J0055724, RX J0054.97226, 1WGA J0054.97226
RA 00 54 56.6, dec 72 26 50
History: Discovered in RXTE observations of the vicinity of SMC X-3 (Marshall et al., 1998), it showed 4 bright, very similar, outbursts during January 1998 – September 1999 from which Laycock et al. (2005) derived an orbital period of 123 1 d. The optical counterpart was established by Stevens et al. (1999); Schmidtke & Cowley (2005b) found a 60.2 0.8 d period from timing analysis of OGLE and MACHO data which they propose as the orbital period.
Survey Results: SXP59.0 remained undetected from September 1999 until a bright outburst in mid 2002 (circa MJD 52520) kicked off a series of 5 outbursts (see Fig. 17(a)). From the whole data range we extract an ephemeris of MJD 52306.1 3.7 + n 122.10 0.38 d. We note that this period is twice the optical period but we detect no significant flux half a phase from maximum that would suggest the orbital period is not 122 days.
During the 1998 – 99 outbursts a spin up was detected of s s-1 and again throughout the 5 outbursts of 2002 – 2003, with a value of s s-1. The luminosities associated with these spin ups are, respectively, Lx 2.6 1036 (B 1.3 1013 G) and Lx 3.3 1036 (B 1.4 1013 G). In between both groups of outbursts SXP59.0 was observed to have spun down during the 1100 days it was undetected. The average spin down was s s-1, which would be associated with an estimated Lx 2.9 1036. Although SXP59.0 was further away from the center of the field of view during AO5 – AO6 (MJD 51600 – 52300), it should have been picked up as a number of the detections during the second outburst season were made when RXTE was pointing at Position D (essentially the same coordinates as Position 5). In view of this, the spin down mechanism for SXP59.0 must be something other than reverse accretion torque and is likely due to the propeller effect.
2.21 SXP65.8
CXOU J010712.6-723533
RA 01 07 12.63, dec 72 35 33.8
History: Discovered as part of a Chandra survey of the SMC wing that is reported in McGowan et al. (2007). They detected a source at Lx = 3 1036 (37 5% pulse fraction) with pulsations at 65.78 0.13 s. Its position was found to coincide with the emission line star [MA93] 1619, a Be star. A 110.6 d period has been observed in the MACHO data for this object (Schmidtke & Cowley, 2007b).
Survey Results: Due to its location outside the heavily observed positions, this pulsar has very little data. We find no significant detections and no periodic modulation is apparent in the X-ray light curve.
2.22 SXP74.7
RX J0049.17250, AX J0049729
RA 00 49 04, dec 72 50 54
History: Discovered in the first observation of this survey with a period of 74.8 0.4 s (Corbet et al., 1998). Kahabka & Pietsch (1998) identified it with the ROSAT source RX J0049.17250 and Stevens et al. (1999) found a single Be star within the ROSAT error radius which they proposed as the optical counterpart. Only 3 X-ray outbursts where observed in the early stages of this survey (before MJD 52300), from which Laycock et al. (2005) derived a possible orbital period of 642 59 d based on the separation between the outbursts. Schmidtke & Cowley (2005b) and Edge (2005d) find a 33.4 d periodicity in OGLE data.
Survey Results: Lomb-Scargle analysis of the data finds a period at 62 d, which although not strong, shows a convincing profile (see Fig. 18(b)); its ephemeris is MJD 52319.0 3.1 + n 61.6 0.2 d. There is a weak peak in the power spectrum at 33.2 d, close to the reported optical period, but folding the light curve at this period does not produce a clear modulation.
2.23 SXP82.4
XTE J0052725
RA 00 52 09, dec 72 38 03
History: First observed by RXTE in this survey (Corbet et al., 2002), its position was determined from archival Chandra observations (Edge et al., 2004b). OGLE data show a strong modulation at 380 d (Edge 2006, private communication).
Survey Results: The Lomb-Scargle periodogram for the light curve shows a very significant peak at 362 d with a number of harmonics (see Fig. 19(b)); the ephemeris derived is MJD 52089.0 3.6 + n 362.3 4.1 d. Although this period is longer than would be expected given its Ps position in the Corbet diagram, its similarity to the optical period would seem to confirm it is the actual orbital period of the system. We note that in the aforementioned Chandra observation of this puslar on MJD 52459, it was detected at Lx = 3.4 1036 (Edge et al., 2004c); this date is 8 days after our predicted periastron passage and the luminosity exhibited is consistent with a Type I outburst (which was also detected with RXTE see Fig. 19(a)).
2.24 SXP89.0
XTE SMC pulsar
No position available
History: Reported by Corbet et al. (2004b) from observations in March 2002, it is located within the field of view of Position 1/A.
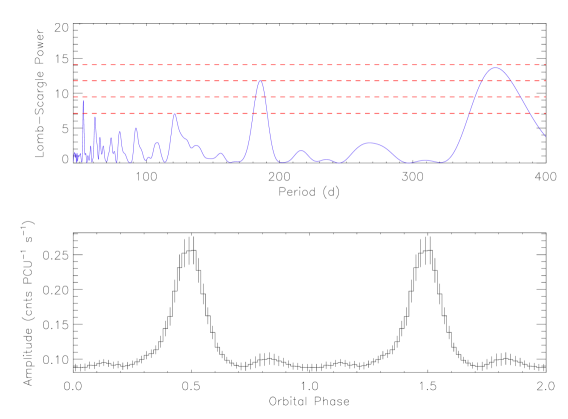
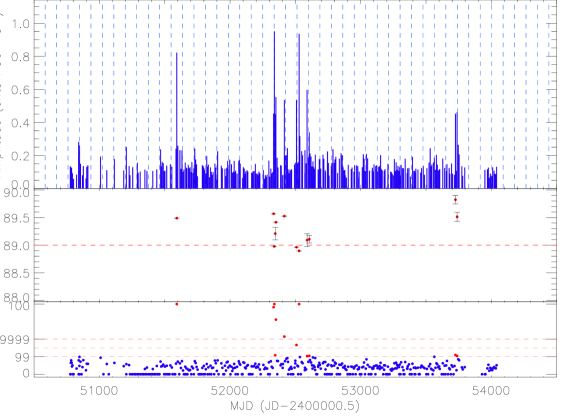
Survey Results: The first outburst is a single detection in February 2000 (MJD 51592), 2 years before the official discovery; 4 others occurred 2 years later in a short space of time–within 260 days (see Fig. 20(a)). They follow a high-low-high-low brightness pattern, with very similar high/low countrates. The separation between them is 88 d which could be expected to be the orbital period. In fact, timing analysis finds a strong period at 87.6 d, with an ephemeris of MJD 52337.5 6.1 + n 87.6 0.3 d.
2.25 SXP91.1
AX J0051722, RX J0051.37216
RA 00 50 55, dec 72 13 38
History: Discovered in the first observation in this survey with a period of 92 1.5 s (Marshall et al., 1997), further analysis improved this measurement to 91.12 0.05 s (Corbet et al., 1998). An orbital period of 115 5 d was derived by Laycock et al. (2005) from early survey data (before MJD 52200). Stevens et al. (1999) identified the optical counterpart; Schmidtke et al. (2004) find an 88.25 d period in their analysis of MACHO data for this star.
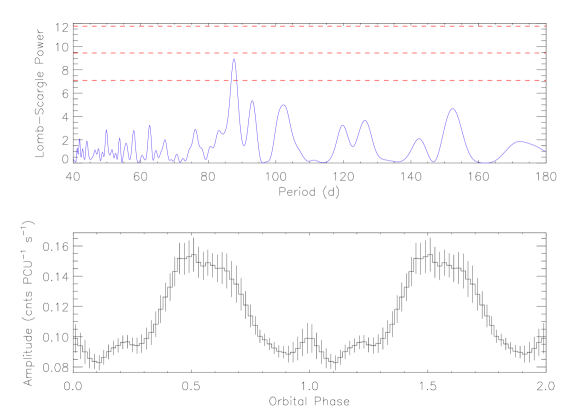
Survey Results: Corbet et al. (2004b) reported the discovery of a new 89 s pulsar from XTE observations in March 2002, it was located within the field of view of Position 1/A. After studying the long-term lightcurves of these two pulsars, we believe SXP89.0 is actually SXP91.1 after having spun up (see Fig. 21(a)). The Lomb-Scargle periodogram of the whole light curve returns a period of 101 d, which is slightly shorter than the period found by Laycock et al. (2005). Timing analysis of the light curve post MJD 52300 shows no clear periods. The ephemeris we derive is MJD 52197.9 8.2 + n 117.8 0.5 d. The average spin up during MJD 50750 – 51550 is calculated to be s s-1, with a luminosity of Lx 3.6 1036 (B 2.5 1013 G).
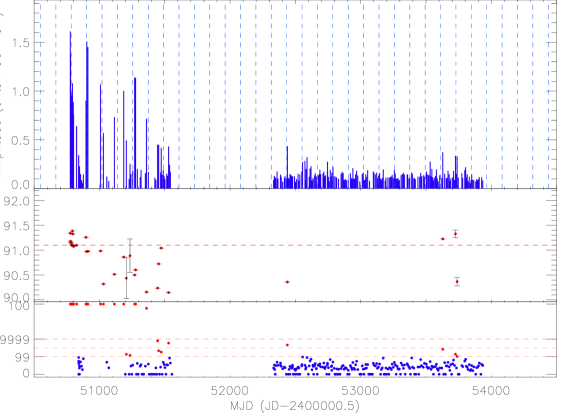
Given the proximity in spin period between SXP91.1 and SXP89.0, and the fact that the optical orbital period of SXP91.1 is so similar to the X-ray period of SXP89.0, it is possible that they may be one and the same pulsar. In Fig. 22(a) we show the consolidated light curve for both pulsars showing the possibility that SXP91.1 spun up sufficiently to be later detected as a separate pulsar. We are hesitant to claim they are one single system because the orbital ephemeris of this consolidated data set does not coincide with either system’s ephemeris: MJD 52301.2 3.0 + n 101.3 0.4 d. However, the orbital profile (see Fig. 22(b)) is convincing and appears similar to that of SXP8.88 (Fig. 9(b)) or SXP18.3 (Fig. 13(b)).
2.26 SXP95.2
SMC 95
RA 00 52, dec 72 45
History: Was discovered in March 1999 in data from this survey (Laycock et al., 2002); an approximate position was obtained with PCA scans over the source and has a large uncertainty. The X-ray orbital period suggested from the two bright outbursts before MJD 52300 is 283 8 d (Laycock et al., 2005).
Survey Results: Only 3 other marginal detections are available in the data (see Fig. 23). Lomb-Scargle analysis does not return any clear period, either including or excluding the two bright outbursts, although the former has its highest power at 71.3 d, an ephemeris that is consistent with the source’s significant detections and may reflect its orbital period.
2.27 SXP101
RX J0057.37325, AX J0057.47325
RA 00 57 26.8, dec 73 25 02
History: Discovered in an ASCA observation at a period of 101.45 0.07 s (Yokogawa et al., 2000a), and identified also as a ROSAT source. Two optical counterparts were suggested by Edge & Coe (2003); from a Chandra observation McGowan et al. (2007) pinpoint the counterpart as a star that exhibits a 21.9 d periodicity in both OGLE III and MACHO data. Schmidtke & Cowley (2007b) find the same period.
Survey Results: This pulsar lies in the SE edge of the wing and was in the field of view of Positions 4 and 5, so coverage is only continuous throughout AO5 and AO6 (see Fig. 24); during this time only 3 outbursts of low brightness were observed (MJD 51814, 51863 and 52137). Timing analysis returns no significant periods, although the highest peak in the periodogram is at 25.2 d, similar to the optical period.
2.28 SXP138
CXOU J005323.8722715
RA 00 53 23.8, dec 72 27 15.0
History: Discovered in archival Chandra data (Edge et al., 2004b), the optical counterpart is [MA93] 667 (Edge, 2005d). The MACHO light curves for the companion star reveal peaks at 125.1 d intervals (stronger in the red band). Schmidtke & Cowley (2006) report finding a weak periodicity in the 122 – 123 s region in MACHO data.
Survey Results: X-ray data from this survey show two brighter detections 112 d apart (see Fig. 25(a)). Lomb-Scargle analysis finds no significant periods; however, if these two detections are removed from the data, a period of 103.6 d appears in the power spectrum. Its ephemerides (shown by the vertical, dashed lines in Fig. 25(a)) do not correspond with the two detections, and the profile (see bottom panel of Fig. 25(b)) looks almost sinusoidal, unlike the profiles exhibited by other systems in the SMC. The maxima for this period occur at MJD 52400.2 5.2 + n 103.6 0.5 d.
2.29 SXP140
XMMU J005605.2722200, 2E0054.47237
RA 00 56 05.7, dec 72 22 00
History: Discovered in XMM observations by Sasaki et al. (2003). The optical counterpart is believed to be [MA93] 904 (Haberl & Pietsch, 2004). Schmidtke & Cowley (2006) find a 197 5 d period in MACHO data.
Survey Results: None of the detections has been longer than 1 week, with only 2 of them showing significant brightness (see Fig. 26). Timing analysis returns no clear periods, although the periodogram of the data, excluding the two bright detections, does show some power at 197 d. As a number of different periods have similar power, this may only be coincidence. The folded light curve at 197 d does not show a typical orbital profile.
2.30 SXP144
XTE SMC pulsar
No position available
History: Detected in observations from this survey in April 2003 by Corbet et al. (2003b), who later reported an ephemeris of MJD 52779.2 2.9 + n 61.2 1.6 d (Corbet et al., 2003d).
Survey Results: Although there are a few minor detections before the initial discovery, April 2003 ( MJD 52750) saw the beginning of a regular pattern of outbursts which continued until February 2006 ( MJD 53800, see Fig. 27(a)). The neutron star has displayed an extremely linear and constant spin down during this time, with an average s s-1, from which we derive a Lx 1.1 1036 (B 2.4 1013 G). The improved outburst ephemeris from Lomb-Scargle analysis is MJD 52368.9 1.8 + n 59.38 0.09 d. This period is shorter than might have have expected from the pulse-orbit relationship, but what is most unusual about this pulsar is that it is spinning down, moving it even further away from the Be group on the Corbet diagram.
2.31 SXP152
CXOU J005750.3720756
RA 00 57 49, dec 72 07 59
History: Haberl & Sasaki (2000) suggested that this object is a Be binary pulsar based on the H-emitting object [MA93] 1038, although ROSAT observations of this source had not detected any pulsations. These were found in a long Chandra observation by Macomb et al. (2003) at a period of 152.098 0.016 s (they report a very high pulse fraction of 64 3% and a Lx = 2.6 1035), and in an XMM observation by Sasaki et al. (2003) at 152.34 0.05 s.
Survey Results: The observational history is shown in Fig. 28. The periodogram of the light curve shows no clear orbital period, although the highest power peak is at 107 d, which would agree with the expected value from the Corbet diagram. The lack of periodic outbursts, despite its clear X-ray activity, may point towards a low eccentricity system. This would limit accretion onto the neutron star to times when the Be star ejecta are dense enough, and would be independent of the orbital phase. Analysis of the optical light curve of the companion Be star is needed.
2.32 SXP169
XTE J0054720, AX J0052.97158, RX J0052.97158
RA 00 52 54.0, dec 71 58 08.0
History: First detected by RXTE in December 1998 at a period of 169.30 s (Lochner et al., 1998). Laycock et al. (2005) suggested a possible orbital period of 200 40 d. Galache et al. (2005) reported an orbital period of 68.6 0.2 d based on data from this survey while Schmidtke et al. (2006) found a period of 67.6 0.3 d in OGLE -III data.
Survey Results: Corbet et al. (2004b) announced a new SMC pulsar at 164.7 s, with an unknown position. After comparing the long term light curves and the ephemerides from timing analysis it became apparent that SXP165 and SXP169 were the same source. A consolidated light curve is presented here (Fig. 29(a)), where the spin up of SXP169 throughout the survey is apparent. The estimated spin up during MJD 50800 – 51500 is s s-1, implying Lx 1.2 1036 (B 3.0 1013 G); for the remaining data the spin up is s s-1, implying Lx 9.6 1035 (B 2.6 1013 G). Lomb-Scargle analysis provides a clear period, and the outbursts are described by the ephemeris MJD 52240.1 2.1 + n 68.54 0.15 d, in agreement with the reported optical period.
2.33 SXP172
AX J0051.67311, RX J0051.97311
RA 00 51 52, dec 73 10 35
History: Found in an ASCA observation (Torii et al., 2000), it was identified with the ROSAT source RX J0051.97311, which has a Be optical counterpart (Cowley et al., 1997). Laycock et al. (2005) suggest a possible orbital period of 67 d based on the X-ray activity up until MJD 52350. Schmidtke & Cowley (2006) report an optical period of 69.9 0.6 d in OGLE II data. This pulsar has been detected on 17 occasions by EINSTEIN, ROSAT and ASCA, but never above Lx = 7.8 1035 (Yokogawa et al., 2000c).
Survey Results: SXP172 underwent a phase of intense, semi-regular, activity during MJD 51600 – 52400 (see Fig. 30). Lomb-Scargle analysis was carried using only data from this period, and also the whole data set, with no conclusive outcome. However, it is clear that the series of outbursts during the aforementioned dates are separated by 70 days (consistent with the optical period). It is possible we are seeing contamination from another pulsar of similar pulse period, maybe located within a different pointing position. As past missions did not detect this pulsar in outburst, it is hard to confirm an X-ray ephemeris.
2.34 SXP202
XMMU J005920.8722316
RA 00 59 20.8, dec 72 23 16
History: Detected in a number of archival XMM observations and reported in Majid et al. (2004); the authors found an early B type star at the X-ray coordinates and classified it as a HMXB.
Survey Results: This source has shown little bright activity throughout the survey except for the outburst in January 2006 (circa MJD 53740, see Fig. 31). Lomb-Scargle analysis of the data returns no clear period, but we note that a 91 d orbital period would agree with the 6 outburst detections since MJD 53000.
2.35 SXP264
XMMU J004723.7731226, RX J0047.37312, AX J0047.37312
RA 00 47 23.7, dec 73 12 25
History: It was initially reported by Yokogawa et al. (2003) from ASCA observations, although it had previously been detected (yet remained undiscovered) in earlier XMM observations (Ueno et al., 2004). It had originally been proposed as a Be/X-ray binary candidate by Haberl & Sasaki (2000) based on its X-ray variability. Edge et al. (2005a) identified the companion as the emission line star [MA93] 172 and found an optical period of 48.8 0.6 d, which they propose as the orbital period of the system. Further analysis of the OGLE light curve finds an ephemeris of MJD 50592 2 + n 49.2 0.2 d (Edge, 2005d). Schmidtke & Cowley (2005b) found a 49.1 d period in OGLE data.
Survey Results: Due to its location this pulsar was only observed consistently during AO5 and AO6 (see Fig. 32). No major outbursts were detected and the power spectrum shows no significant peak at the optical period, nor at any other. We note that the optical ephemeris does not agree with the X-ray activity.
2.36 SXP280
RX J0057.87202, AX J005872.0
RA 00 57 48.2, dec 72 02 40
History: Discovered in March 1998 in an ASCA observation by Yokogawa & Koyama (1998a) at a period of 280.4 0.3 s. It is identified with the Be star [MA93] 1036, and Schmidtke et al. (2006) find a 127.3 d period in its OGLE data with an epoch of maximum brightness at MJD 52194.7. This pulsar was observed on 15 occasions by EINSTEIN, ROSAT and ASCA, but never detected above Lx = 6.0 1035 (Tsujimoto et al., 1999).
Survey Results: There are only 5 clear detections of this source throughout the survey, and the power spectrum shows no significant periods, although the highest peak is at 64.8 d, which is of the optical period. For this reason, the ephemeris lines and folded light curve are shown in Fig. 33. The tentative ephemeris of the X-ray period is MJD 52312 6 + n 64.8 0.2 d, which is within 12 d of the epoch of peak optical flux. A lack of earlier detections of this system in outburst makes it difficult to firmly establish an X-ray ephemeris.
2.37 SXP293
XTE J0051727
No position available
History: Reported by Corbet et al. (2004c) from observations during this survey of the outburst at MJD 53097.
Survey Results: Only one of the 6 outbursts lasts longer than one week (Fig. 34(a)), which could imply this is a Type II outburst, and thus not expected to coincide with periastron passage. For this reason, it was removed from the data after initial timing analysis produced no results. The resulting power spectrum, while not showing any significant periods, does have its strongest peak at 151 d, an ephemeris that agrees well with the remaining 5 detections. We suggest this is the likely orbital period of the system, with an ephemeris of MJD 52327.3 4.5 + n 151 1 d.
2.38 SXP304
RX J0101.07206, CXOU J010102.7720658
RA 01 01 01.7, dec 72 07 02
History: Discovered in Chandra observations at 304.49 0.13 s, the optical counterpart is identified as the emission line star [MA93] 1240 (Macomb et al., 2003). The authors measured an unusually high pulse fraction of 90 8% at a luminosity of Lx = 1.1 1034. Schmidtke & Cowley (2006) suggest there may be a 520 12 d period in MACHO data of the optical counterpart [MA93] 1240.
Survey Results: This source was out of the field of view during AO5 and AO6, so it has only been adequately covered from AO7 onwards. A number of small outbursts were detected during MJD 52600 – 53000 (see Fig. 35), and it was not detected again until recently, in MJD 53747, when it began a 2 – 3 week outburst, the longest and brightest observed so far in this survey. Lomb-Scargle analysis of the data outside of this outburst finds moderate power at 50 d and no significant power at the optical period. It should be noted that this source displays X-ray activity on timescales much shorter than the reported 520 d optical period.
2.39 SXP323
RX J0050.77316, AX J0051733
RA 00 50 44.8, dec 73 16 06.0
History: Pulsations at 323.2 0.4 s were detected in November 1997 (Yokogawa & Koyama, 1998a) at the coordinates of the ROSAT source RX J0050.77316. Cowley et al. (1997) identified the optical counterpart as a Be star. This system has been found to exhibit optical and IR variability at periods of 0.7 and 1.4 d (Coe et al., 2002) and 1.695 d (Coe et al., 2005). These periods are too short to be the orbital period of the system and are most likely non-radial pulsations in the Be star. Laycock et al. (2005) suggest an orbital period of 109 18 d from X-ray data earlier in this survey.
Survey Results: This pulsar showed quite regular, bright activity during the survey (see Fig. 36(a)). We found that the outburst circa MJD 52960 skewed the timing analysis results, which we attribute to it being a Type II outburst; for this reason it was excluded from the analysis. The ephemeris found for the remaining outbursts is MJD 52336.9 3.5 + n 116.6 0.6 d, which is consistent with the orbital period proposed by Laycock et al. (2005).
2.40 SXP348
RX J0102722, SAX J0103.2 7209, AX J0103.27209
RA 01 03 13.0, dec 72 09 18.0
History: Pulsations at 345.2 0.1 s were detected in BeppoSAX observations in July 1998 (Israel et al., 1998). Subsequently, pulsations at 348.9 0.1 s were found in archival ASCA data from May 1996 implying a s s-1 (Yokogawa & Koyama, 1998b). The ROSAT source lies in a supernova remnant with a Be counterpart; a weak 93.9 d periodicity has been reported from OGLE data (Schmidtke & Cowley, 2006). Israel et al. (2000) suggest this is a persistent, low luminosity X-ray system.
Survey Results: Although this source has been detected by a number of different instruments, it was always at low luminosities (1036), so it is not surprising that there are not many detections in the survey Fig. 37. Furthermore, it has also been detected at a wider range of periods than other pulsars (from 340 to 348 s), which makes it more difficult to pick out in the periodograms from weekly observations. Timing analysis reveals no significant periods.
2.41 SXP452
RX J0101.37211
RA 01 01 19.5, dec 72 11 22
History: Was initially proposed as an X-ray binary by Haberl et al. (2000). Pulsations were detected in XMM observations during 2001 at 455 2 s and in 1993 ROSAT data at 450 – 452 s (Sasaki et al., 2001), implying a s s-1; the optical counterpart was identified as a Be star Sasaki et al. (2001). Schmidtke et al. (2004) propose an orbital period of 74.7 d for this system based on its optical variability.
Survey Results: With only 5 detections throughout the survey (Fig. 38), this source’s periodogram shows no periodicities and there is no evidence for the reported 74.7 d optical period.
2.42 SXP504
RX J0054.97245, AX J0054.87244, CXOU J005455.6724510
RA 00 54 55.6, dec 72 45 10
History: Discovered in archival Chandra data with 503.5 6.7 s pulsations (Edge et al., 2004d; Edge et al., 2004c). Also reported by Haberl et al. (2004) from an XMM observation at 499.2 0.7 s and Lx = 4.3 1035. An orbital period of 268.0 1.4 d was determined from optical (OGLE) data, and corroborated by preliminary X-ray data from the present survey (Edge et al., 2005b). The optical ephemeris was later refined to MJD 50556 3 + n 268.0 0.6 d (Edge et al., 2005c). Schmidtke & Cowley (2005b) found a period of 273 d in OGLE data.
Survey Results: The light curve for this system can be seen in Fig. 39(a). Lomb-Scargle analysis of the entire survey (with or without the bright outbursts circa MJD 52440 and 52980) returns a slightly shorter orbital period to the optical one previously reported, but is consistent within errors. Furthermore, Edge et al. (2005c) find that the epochs of maximum X-ray flux are coincident with the optical outbursts. The ephemeris we find is MJD 52167.4 8.0 + n 265.3 2.9 d. This source displays a lot of activity in between periastron passages, which might be indicative of a low eccentricity orbit and makes timing analysis more difficult.
2.43 SXP565
CXOU J005736.2721934
RA 00 57 36.2, dec 72 19 34
History: Discovered in Chandra observations at 564.81 0.41 s with a pulse fraction of 48 5% (Lx = 5.6 1034), the optical counterpart is idenified as the emission line star [MA93] 1020 (Macomb et al., 2003). An optical period of 95.3 d has been reported for this system (Schmidtke et al., 2004), but this period is not seen in OGLE data (Edge, 2005d).
Survey Results: This source shows a lot of variability, but no clear outbursts (see Fig. 40(a)). The power spectrum returns two significant peaks, with only the higher one providing a convincing orbital profile. The ephemeris for this period is MJD 52219.0 13.7 + n 151.8 1.0 d. We note there is no power at the reported optical period nor does the optical ephemeris agree with the brightest X-ray detections of this source. In view of this, it is possible that the optical counterpart has been misidentified; however, there is no other bright candidate star within 10 arcsec of the very precise Chandra position. The folded light curve has a unique shape, showing significant activity around periastron. The asymmetry of the periastron peak is likely due to the presence of an accretion disk around the neutron star that is not completely consumed by the time it reaches apastron, where its lower orbital velocity allows it to “top up” its disk from the Be star’s wind.
2.44 SXP700
CXOU J010206.6-714115
RA 01 02 06.69, dec 71 41 15.8
History: Discovered as part of the aforementioned Chandra survey of the SMC wing reported in McGowan et al. (2007). They detected a source with Lx = 6.0 1035 (35 5% pulse fraction) with pulsations at 700.54 34.53 s and found its position to coincide with the emission line star [MA93] 1301, a O9 star. The OGLE data available for this object show a periodic modulation at 267.38 15.10 d (McGowan et al., 2007).
Survey Results: Due to its proximity in period to SXP701, limitations of the current analysis script (which cannot work on two pulsars of such similar spin periods) have not allowed the extraction of an X-ray light curve for this pulsar. However, it has not contaminated the data presented for SXP701 because, even though they are 66 – arcmin away from each other, they were never within the same field of view.
2.45 SXP701
RX J0055.27238, XMMU J005517.9723853
RA 00 55 17.9, dec 72 38 53
History: First observed during an XMM TOO observation at 701.6 1.4 s and located within the error circle of a ROSAT object (Haberl et al., 2004). Fabrycky (2005) finds optical periods of 6.832 and 15.587 h, which are attributed to stellar pulsations. A weak 412 d period has been seen in MACHO data (Schmidtke & Cowley, 2005b).
Survey Results: Similar to SXP565, it displays much X-ray variability with no bright outbursts (see Fig. 41). Unfortunately, timing analysis provides no clear periodicities.
2.46 SXP756
RX J0049.67323, AX J0049.47323
RA 00 49 42.42, dec 73 23 15.9
History: Pulsations at 755.5 0.6 s were detected in a very long ( 177 ks) ASCA observation of the SMC in April 2000, the source was detected at a luminosity of Lx = 5 1035 (Yokogawa et al., 2000b). The optical counterpart was later established as a V = 15 Be star (Edge & Coe, 2003). Laycock (2002) and Laycock et al. (2005) find an X-ray period of 396 5 d while Cowley & Schmidtke (2003); Schmidtke et al. (2004) report recurring outbursts at 394 d intervals in R and V MACHO data.
Survey Results: Coverage of this pulsar has been sparse due to its southern location in the SMC, only visible to observations of Positions 4 and 5. Despite this, it has been detected various times in outburst, the brightest of which was a 3 week outburst (Fig. 42(a)). We decided to remove the brightest point from this outburst so as not to skew the Lomb-Scargle power spectrum. A strong period is found at 194.9 d which we believe to be the first harmonic of the orbital period. Looking at the light curve it is evident that the bright detections are spaced 400 d apart333Also note that only one peak appears in the orbital profile in Fig. 42(b). If 194.9 d were the actual orbital period, the plot would show two peaks per orbital cycle.. Moreover, this would be in agreement with the optical period of the system, so we use twice the value of the harmonic as the orbital period and derive the ephemeris MJD 52196.1 3.9 + n 389.9 7.0 d. This ephemeris places the first outburst in the data at MJD 51416, which is consistent with the last optical outburst available in the MACHO data (Cowley & Schmidtke, 2003).
2.47 SXP1323
RX J0103.67201
RA 01 03 37.5, dec 72 01 33.2
History: This is the source with the longest known pulse period in the SMC, SXP1323 was reported by Haberl & Pietsch (2005) in a number of archival XMM observations. The authors identify the emission line star [MA93] 1393 (V 14.6) as the optical counterpart. Schmidtke & Cowley (2006) report three strong periods for this source from OGLE II data: 0.41 d, 0.88 d and 26.16 d; they attribute the first two to non-radial pulsations of the Be star but suggest the latter might be the orbital period.
Survey Results: This source is difficult to detect due to its long period (requiring observations with a baseline longer than 4 ks) and its location near the edge of Position 1/A. Despite these limitations, a number of bright outbursts have been detected but no periodicities can be found in the sparse data (see Fig. 43).
3 Discussion
Table 3 presents a summary of the timing analysis results for the SMC pulsars, providing orbital periods and ephemerides where available, together with periods observed at other wavelengths. In cases when there is only weak evidence for an orbital period in the X-ray data, the number is given in parentheses.
Those systems with unequivocal orbital periods have allowed us to study and compare a selection of well-defined orbital profiles. In particular, we consider the profiles of the following systems that have shown regular activity at, or around, periastron pasage: SXP6.85, SXP7.78, SXP46.6, SXP59.0, SXP82.4, SXP144, SXP169 and SXP756. It is notable that their profiles all share a similar shape, even though their orbital periods cover a wide range (from 45 – 390 d): they are relatively narrow (except for SXP756, all widths are between 0.40 and 0.55 wide in orbital phase), and they are very symmetrical in shape (suggesting accretion takes place fluidly and increases smoothly as the neutron star approaches the deccretion disk, to decrease in an equally smooth manner after periastron). Other systems display different characteristics, some show sharp rises with long declines (e.g.,SXP323, Fig. 36(b)), the opposite (e.g., SXP16.6, Fig. 12(b)), or even long, plateau-like profiles (e.g.,SXP280, Fig. 33(b)).
A number of profiles show a small increase in flux half an orbital phase away from the maximum (e.g., SXP7.78, SXP89.0, SXP144, SXP504 and SXP565), suggesting that accretion is taking place on a smaller scale, possibly from the Be star’s wind, when the neutron star is travelling slowly enough to accrete from it. Given the range of orbit sizes in the systems that exhibit this behaviour (judging from the orbital periods), it may be the eccentricity of the orbit that determines whether apastron accretion takes place (because the more eccentric the orbit, the slower the neutron star will be travelling at apastron).
Throughout the length of the survey there have been some pulsars whose spin periods have undergone slow, persistent evolution, e.g., SXP7.78 (spin down), SXP46.6 (spin up), SXP59.0 (spin up) or SXP144 (spin down), while others have changed their pulse period over the course of a few weeks, e.g., SXP15.3 (spin up). And still, some other systems have not changed their spin periods significantly despite bright and/or persistent activity, e.g., SXP2.37, SXP4.78 or SXP8.88. This suggests there are a number of pulsars that must be rotating close to, or at, their equilibrium spin periods, as suggested by Corbet (1984). A lack of modulation in the spin period throughout a long outburst (as in SXP18.3’s outburst circa MJD 54000) further reveals systems that are likely being observed at a low inclination (face on). Unfortunately, despite the number of orbital periods known, it has still not been possible to calculate the complete set of orbital parameters of any SMC system (with the exception of SXP0.92 (Kaspi et al., 1993)), so orbital inclination angles and their effects on pulse arrival times remain a matter of speculation.
An interesting case is presented by SXP348; Israel et al. (2000) suggest this is a persistent, low luminosity system, and recent Chandra observations (McGowan et al., 2007) tend to support this notion after detecting the pulsar at its shortest recorded pulse period until then, 337.5 s. Given that it was observed in 1996 at 349 s in ASCA data, we can deduce that it has spun down 11.5 s in 10 years, implying a s s-1. An estimate for the accretion necessary to produce the required torque on this timescale implies a time-averaged X-ray luminosity of just Lx 3.3 1035, which would explain why it was rarely detected during the present survey. However, RXTE detected it a number of times at longer pulse periods than would have been expected; a clear occasion was during the short outburst circa MJD 53740, when the system was detected at a high significance on 2 consecutive weeks with periods of 345.0 s and 336.2 s, respectively. If this spin-up were all intrinsic, the expected luminosity would be Lx 1.1 1038, which is not inconceivable for a Type II outburst. McGowan et al. (2007) detected it 30 d later (MJD 53777) at Lx = 4.2 1037, but RXTE did not detect it 2 days prior to that (MJD 53774). So what is happening in this system? It is not clear whether we are detecting orbitally-induced Doppler-shifted pulse periods or if SXP348 is actually undergoing massive spin up every time it outbursts. Given the pulse periods of the detections in Fig. 37, it is unclear whether the pulsar is, in fact, spinning down (as proposed by Israel et al. (2000)); it could very well be spinning up.
Another case involving changes in spin is that of SXP59.0 (Fig. 17(a)). It went undetected by RXTE during MJD 51550 – 52500, during which time its pulse period increased 0.45 s. If this spin-down were a product of reverse accretion torques, we would have expected to see outbursts at Lx 2.6 1036, comparable in strength with those detected during the survey. Although SXP59.0 was not close to the center of the field of view during the spin-down period (as it was for most of the rest of the survey), it should still have been detectable. This suggests that SXP59.0 was spun down through mechanisms other than reverse accretion torques, possibly through the propeller effect.
Yet another example of strange spin behaviour is that of SXP144. Given its pulse period, and based on the Corbet diagram, its orbital period should be 90 d; so with its clear 59.4 d orbital period, the expectation is that it would spin up during outburst. However, quite the opposite is what RXTE has detected. This system went into outburst at least once every orbit over a period of 1160 d, during which time it spun down 1.7 s. It would seem that factors other than just the orbital and spin periods govern the behaviour and evolution of these binary systems, and they need to be taken into account. Orbital eccentricity and/or the magnetic field strength of the pulsar are likely to be important factors in determining the relationship between the spin and orbital periods.
4 Conclusion
We have presented the most comprehensive colection of pulsed light curves for 41 probable Be/X-ray systems in the SMC and have determined an X-ray (likely orbital) ephemeris for 21 of them while presenting possible periods for 6 others. 10 of these ephemerides are from new X-ray periods, while 6 others are improvements of previously known ephemerides. Of the systems exhibiting periodicities in the X-ray, 19 also show optical periodicities, although it is noteworthy that the optical and X-ray periods only agree on 7 occasions. Of the remaining 12, 3 show an optical period that is half the X-ray period while 1 exhibits an optical modulation that is twice the X-ray period. However, there are still 11 systems with a known optical period that show no modulation in X-rays. The systems exhibiting a large discrepancy between the optical and X-ray periods suggest the possibility that the optical counterpart to the X-ray system has been missidentified, or that the interaction between the Be star’s disk and the neutron star is more complicated than originally thought, although optical periods can be affected by pulsations of the primary star, and X-ray periods by Type II outbursts. Nonetheless, for extragalactic X-ray binaries, long-term monitoring has proven to be the most successful method of study.
| Object | Ps (s) | RA | dec | X-ray TP (MJD) | X-ray Porb (days) | Other Porb (days) |
|---|---|---|---|---|---|---|
| SXP0.09 | 0.087 | 00 42 35.0 | -73 40 30.0 | – | – | – |
| SXP0.72 | 0.716 | 01 17 05.2 | -73 26 36.0 | – | – | – |
| SXP0.92 | 0.92 | 00 45 35.0 | -73 19 02.0 | – | – | 51aaFrom radio observations (Kaspi et al., 1993). |
| SXP2.16 | 2.165 | 01 19 00 | -73 12 27 | – | – | – |
| SXP2.37 | 2.374 | 00 54 34.0 | -73 41 03.0 | – | – | – |
| SXP2.76 | 2.763 | 00 59 11.7 | -71 38 48.0 | – | – | 82.1bbFrom OGLE III data (Schmidtke et al., 2006). |
| SXP3.34 | 3.34 | 01 05 02.0 | -72 11 00.0 | – | – | – |
| SXP4.78 | 4.782 | 00 52 06.6 | -72 20 44 | – | (34.1) | 23.9ccFrom MACHO data of the possible optical counterpart (Coe et al., 2005). |
| SXP6.85 | 6.848 | 01 02 53.1 | -72 44 33 | 52318.5 7.9 | 112.5 0.5 | 24.82ddFrom OGLE and MACHO data (Schmidtke & Cowley, 2007). |
| SXP7.78 | 7.780 | 00 52 06 | -72 26 06 | 52250.9 1.4 | 44.92 0.06 | 44.86eeFrom MACHO data (Cowley & Schmidtke, 2004)., 44.6ffFrom MACHO data (Coe et al., 2005)., 44.8ggFrom OGLE data (Edge, 2005d). |
| SXP8.02 | 8.020 | 01 00 41.8 | -72 11 36 | – | – | – |
| SXP8.88 | 8.880 | 00 51 52.0 | -72 31 51.7 | 52392.2 0.9 | 28.47 0.04 | 33.4hhFrom OGLE and MACHO data (Schmidtke & Cowley, 2006). |
| SXP9.13 | 9.130 | 00 49 13.6 | -73 11 39 | 52380.5 2.3 | 77.2 0.3 | 40.17ggFrom OGLE data (Edge, 2005d)., 91.5iiFrom OGLE data (Schmidtke et al., 2004). |
| SXP15.3 | 15.30 | 00 52 14 | -73 19 19 | – | (28) | 75.1jjFrom OGLE and MACHO data (Edge, 2005d). |
| SXP16.6 | 16.52 | – | – | 52373.5 1.0 | 33.72 0.05 | – |
| SXP18.3 | 18.37 | 00 50 | -72 42 | 52275.6 0.9 | 17.73 0.01 | 34.6kkFrom RXTE data (Corbet et al., 2004d). |
| SXP22.1 | 22.07 | 01 17 40.5 | -73 30 52.0 | – | – | – |
| SXP31.0 | 31.01 | 01 11 09.0 | -73 16 46.0 | – | – | 90.4bbFrom OGLE III data (Schmidtke et al., 2006). |
| SXP34.1 | 34.08 | 00 55 26.9 | -72 10 59.9 | – | – | – |
| SXP46.6 | 46.59 | 00 53 58.5 | -72 26 35.0 | 52293.9 1.4 | 137.36 0.35 | 69.2llFrom OGLE data (Schmidtke et al., 2007)., 138.4llFrom OGLE data (Schmidtke et al., 2007). |
| SXP51.0 | 51.00 | – | – | – | – | – |
| SXP59.0 | 58.86 | 00 54 56.6 | -72 26 50 | 52306.1 3.7 | 122.10 0.38 | 60.2mmFrom OGLE and MACHO data (Schmidtke & Cowley, 2005b). |
| SXP65.8 | 65.78 | 01 07 12.63 | -72 35 33.8 | – | – | 110.6nnFrom MACHO data (Schmidtke & Cowley, 2007b). |
| SXP74.7 | 74.70 | 00 49 04 | -72 50 54 | 52319.0 3.1 | 61.6 0.2 | 33.4ooFrom OGLE data (Schmidtke & Cowley, 2005b; Edge, 2005d). |
| SXP82.4 | 82.40 | 00 52 09 | -72 38 03 | 52089.0 3.6 | 362.3 4.1 | 380ppFrom OGLE data (Edge 2006, private communication). |
| SXP89.0 | 89.00 | – | – | 52337.5 6.1 | 87.6 0.3 | – |
| SXP91.1 | 91.10 | 00 50 55 | -72 13 38 | 52197.9 8.2 | 117.8 0.5 | 88.25qqFrom MACHO data (Schmidtke et al., 2004). |
| SXP95.2 | 95.20 | 00 52 00 | -72 45 00 | – | (71.3) | – |
| SXP101 | 101.40 | 00 57 26.8 | -73 25 02 | – | (25.2) | 21.9rrFrom OGLE and MACHO data (McGowan et al., 2007; Schmidtke & Cowley, 2007b). |
| SXP138 | 138.00 | 00 53 23.8 | -72 27 15.0 | 52400.5 5.2 | 103.6 0.5 | 125ssFrom MACHO data (Edge, 2005d)., 122–123ttFrom MACHO data (Schmidtke & Cowley, 2006). |
| SXP140 | 140.99 | 00 56 05.7 | -72 22 00.0 | – | – | 197ttFrom MACHO data (Schmidtke & Cowley, 2006). |
| SXP144 | 144.00 | – | – | 52368.9 1.8 | 59.38 0.09 | – |
| SXP152 | 152.10 | 00 57 49 | -72 07 59 | – | – | – |
| SXP169 | 167.35 | 00 52 54.0 | -71 58 08.0 | 52240.1 2.1 | 68.54 0.15 | 67.6uuFrom OGLE data (Schmidtke et al., 2006). |
| SXP172 | 172.40 | 00 51 52 | -73 10 35 | – | (70) | 69.9vvFrom OGLE data (Schmidtke & Cowley, 2006). |
| SXP202 | 202.00 | 00 59 20.8 | -72 23 17 | – | (91) | – |
| SXP264 | 263.60 | 00 47 23.7 | -73 12 25 | – | – | 49.2ggFrom OGLE data (Edge, 2005d)., 49.1wwFrom OGLE data (Schmidtke & Cowley, 2005b). |
| SXP280 | 280.40 | 00 57 48.2 | -72 02 40 | 52312 6 | 64.8 0.2 | 127.3uuFrom OGLE data (Schmidtke et al., 2006). |
| SXP293 | 293.00 | – | – | 52327.3 4.5 | 151 1 | – |
| SXP304 | 304.49 | 01 01 01.7 | -72 07 02 | – | – | 520ttFrom MACHO data (Schmidtke & Cowley, 2006). |
| SXP323 | 321.20 | 00 50 44.8 | -73 16 06.0 | 52336.9 3.5 | 116.6 0.6 | – |
| SXP348 | 344.75 | 01 03 13.0 | -72 09 18.0 | – | – | 93.9vvFrom OGLE data (Schmidtke & Cowley, 2006). |
| SXP452 | 452.01 | 01 01 19.5 | -72 11 22 | – | – | 74.7xxFrom OGLE and MACHO data (Schmidtke et al., 2004). |
| SXP504 | 503.50 | 00 54 55.6 | -72 45 10.0 | 52167.4 8.0 | 265.3 2.9 | 268.0yyFrom OGLE and MACHO data (Edge et al., 2005c)., 273wwFrom OGLE data (Schmidtke & Cowley, 2005b). |
| SXP565 | 564.83 | 00 57 36.2 | -72 19 34.0 | 52219.0 13.7 | 151.8 1.0 | 95.3qqFrom MACHO data (Schmidtke et al., 2004). |
| SXP700 | 700.5 | 01 02 06.69 | -71 41 15.8 | – | – | 267zzFrom OGLE data (McGowan et al., 2007). |
| SXP701 | 696.37 | 00 55 17.9 | -72 38 53.0 | – | – | 412aaaaFrom MACHO data (Schmidtke & Cowley, 2005b). |
| SXP756 | 755.50 | 00 49 42.42 | -73 23 15.9 | 52196.1 3.9 | 389.9 7.0 | 394ababFrom MACHO data (Cowley & Schmidtke, 2003; Schmidtke et al., 2004). |
| SXP1323 | 1323.20 | 01 03 37.5 | -72 01 33.2 | – | – | 26.16vvFrom OGLE data (Schmidtke & Cowley, 2006). |
We thank A. Cowley for pointing out some glaring omissions in the final manuscript and also the anonymous referee for many useful comments that made this paper clearer.
Facilities: RXTE (PCA).
Appendix A Determining signal significance
Scargle (1982) proposes the normalisation of the periodogram to the variance, , of the signal-free data, where is the standard deviation; as such, Gaussian noise will have a power of 1444It is clear that most of the data from observations made by RXTE during the survey contain contributions from a number of sources in the field of view, and their variance should not be used in the calculations. However, after analysing a large number of observations, it was found that the average power within the calculated power spectra was essentially 1 (likely due to the low S/N), which justifies our use of the light curve variance (including all the pulsar signals) instead of the variance of the noise, which would have been difficult to obtain.. Furthermore, the probability function Prob associated with the periodogram will be exponentially distributed555It will be of the form Prob = , which is the probability of detecting a peak in the periodogram above a certain power, Z., and it can be shown that the probability that a periodic signal with power of Z is due to noise is
| (A1) |
which is the False Alarm Probability, with M being the number of independent frequencies, which we (rather conservatively) define as
| (A2) |
where is the number of scanned frequencies, is the frequency interval used when calculating the periodogram, and is the duration of the observation.
A more useful number may be the significance of a detection, or how sure we are that it is real; this is simply 1 FAP, expressed as a percentage. This is the value that will be used throughout this paper to estimate the importance and believability of a signal, and is given by
| (A3) |
In the Lomb-Scargle periodogram, the peak-to-trough amplitude A of the modulation in the signal is related to the power through
| (A4) |
where is the number of data points (Scargle, 1982).
If the signal detected has any harmonics, its total power will be divided between the individual harmonic peaks in the power spectrum. Using only the fundamental to estimate the amplitude of the signal’s pulsations could then severely underestimate it if there were considerable power in any of the harmonics (which is often the case). If the amplitude of all the harmonics is known, it can be shown that the total amplitude of the signal will be given by
| (A5) |
From the error in the angular frequency detected at a certain power in the Lomb-Scargle periodogram (Horne & Baliunas, 1986), we derive the error on the period as
| (A6) |
where A is the Lomb-Scargle amplitude given by Eq. (A5), and is the standard deviation of the noise, although the standard deviation of the actual data is used, as explained earlier.
Apart from the global significance of a detection, we define an additional quantity, the local significance, as the significance of a peak at frequency , within a region of frequency space extending 5% of to either side of it.
Appendix B Luminosity and magnetic field estimation
If all the matter accreting onto a neutron star is converted into energy, the luminosity that will result is simply the gravitational energy lost by the in-falling mass (Frank et al., 2002):
| (B1) |
where is the mass transfer rate. Some manipulation and substitution can provide a more manageable expression:
| (B2) |
which will give us the luminosity in terms of 1037, and where is the mass of the neutron star in units of M⊙, is the mass accretion rate in units of M⊙ yr-1, and is the radius of the neutron star in km.
The angular momentum of a neutron star is given by
| (B3) |
where Ps is the spin period, and the moment of inertia is given by
| (B4) |
with and being the mass and radius of the neutron star in standard units.
The torque experienced by a neutron star spinning up or down is given by
| (B5) |
with s being the rate of change of the spin period (Frank et al., 2002).
For an accreting pulsar undergoing steady spin up/down, the applied torque will depend on the mass accretion rate, , and the angular momentum of matter in the accretion disc at the magnetospheric radius, . This torque is given by
| (B6) |
The maximum torque possible will occur when , where the corotation radius666The corotation radius is defined as the radius at which matter in the disc is moving at the same speed as the neutron star’s surface. is given by
| (B7) |
Substituting this value in Eq. (B6) will provide the expression for the maximum torque possible:
| (B8) |
Clearly, , so using Eqs. B5 and B8, and substituting the expression for the moment of inertia from Eq. (B4), we find the accretion rate will be
| (B9) |
substituting this value in Eq. (B1) we finally obtain the lower limit on the luminosity that will be produced through accretion:
| (B10) |
which will be in units of 1037 if S.I. units are used (and the neutron star mass is in M⊙). This equation will allow the estimation of the luminosity associated with an outburst if the average spin up/down is measured.
One further value that can be estimated is the magnetic field of the neutron star. Rearranging Eq. (6.24) of Frank et al. (2002), and using the period in place of the frequency, a constraint can be placed on its value:
| (B11) |
where the magnetic field will be in units of 1012 G if is in M⊙ and in metres. In the present work we assume values for the neutron star’s radius and mass of and , respectively.
References
- Ables et al. (1987) Ables J. G., Jacka C. E., Hall P. J., Hamilton P. A., McConnell D., McCulloch P. M., 1987, IAU Circ., 4422, 1
- Bell (1994) Bell J. F., 1994, Proceedings of the Astronomical Society of Australia, 11, 81
- Blackburn (1995) Blackburn J. K., 1995, in Shaw R. A., Payne H. E., Hayes J. J. E., eds, Astronomical Data Analysis Software and Systems IV Vol. 77 of Astronomical Society of the Pacific Conference Series, FTOOLS: A FITS Data Processing and Analysis Software Package. pp 367–+
- Buckley et al. (2001) Buckley D. A. H., Coe M. J., Stevens J. B., van der Heyden K., Angelini L., White N., Giommi P., 2001, Mon. Not. R. Astron. Soc., 320, 281
- Carstairs (1992) Carstairs I. R., 1992, Ph.D. Thesis, University of Southampton
- Chakrabarty et al. (1998) Chakrabarty D., Levine A., Clark G., Takeshima T., Wilson C., Finger M., 1998, IAU Circ., 7048, 1
- Charles et al. (1996) Charles P. A., Southwell K. A., O’Donoghue D., 1996, IAU Circ., 6305, 2
- Clark et al. (1978) Clark G., Doxsey R., Li F., Jernigan J. G., van Paradijs J., 1978, Astrophys. J., Lett., 221, L37
- Clark et al. (1996) Clark G., Remillard R., Woo J., 1996, IAU Circ., 6282, 1
- Clark et al. (1997) Clark G. W., Remillard R. A., Woo J. W., 1997, Astrophys. J., Lett., 474, L111+
- Coe et al. (2005) Coe M. J., Edge W. R. T., Galache J. L., McBride V. A., 2005, Mon. Not. R. Astron. Soc., 356, 502
- Coe et al. (2002) Coe M. J., Haigh N. J., Laycock S. G. T., Negueruela I., Kaiser C. R., 2002, Mon. Not. R. Astron. Soc., 332, 473
- Coe et al. (1998) Coe M. J., Stevens J. B., Buckley D. A. H., Charles P. A., Southwell K. A., 1998, Mon. Not. R. Astron. Soc., 293, 43
- Corbet (1984) Corbet R. H. D., 1984, Astron. Astrophys., 141, 91
- Corbet et al. (1998) Corbet R., Marshall F. E., Lochner J. C., Ozaki M., Ueda Y., 1998, IAU Circ., 6803, 1
- Corbet et al. (2001) Corbet R. H. D., Marshall F. E., Coe M. J., Laycock S., Handler G., 2001, Astrophys. J., Lett., 548, L41
- Corbet et al. (2002) Corbet R., Markwardt C. B., Marshall F. E., Laycock S., Coe M., 2002, IAU Circ., 7932, 2
- Corbet et al. (2003a) Corbet R., Markwardt C. B., Marshall F. E., Coe M. J., Edge W. R. T., Laycock S., 2003a, IAU Circ., 8064, 4
- Corbet et al. (2003b) Corbet R. H. D., Markwardt C. B., Marshall F. E., Coe M. J., Edge W. R. T., Laycock S., 2003b, The Astronomer’s Telegram, 163, 1
- Corbet et al. (2003c) Corbet R. H. D., Edge W. R. T., Laycock S., Coe M. J., Markwardt C. B., Marshall F. E., 2003c, AAS/High Energy Astrophysics Division, 7, 1
- Corbet et al. (2003d) Corbet R. H. D., Laycock S., Marshall F. E., Markwardt C. B., Coe M. J., 2003d, The Astronomer’s Telegram, 209, 1
- Corbet et al. (2003e) Corbet R. H. D., Markwardt C. B., Coe M. J., Edge W. R. T., Laycock S., Marshall F. E., 2003e, The Astronomer’s Telegram, 214, 1
- Corbet et al. (2004a) Corbet R. H. D., Coe M. J., Edge W. R. T., Laycock S., Markwardt C. B., Marshall F. E., 2004a, The Astronomer’s Telegram, 277, 1
- Corbet et al. (2004b) Corbet R. H. D., Laycock S., Coe M. J., Marshall F. E., Markwardt C. B., 2004b, in AIP Conf. Proc. 714: X-ray Timing 2003: Rossi and Beyond Monitoring and Discovering X-ray Pulsars in the Small Magellanic Cloud. pp 337–341
- Corbet et al. (2004c) Corbet R. H. D., Markwardt C. B., Coe M. J., Edge W. R. T., Laycock S., Marshall F. E., 2004c, The Astronomer’s Telegram, 273, 1
- Corbet et al. (2004d) Corbet R. H. D., Markwardt C. B., Marshall F. E., Coe M. J., Edge W. R. T., Galache J. L., Laycock S., 2004d, The Astronomer’s Telegram, 347, 1
- Cowley & Schmidtke (2003) Cowley A. P., Schmidtke P. C., 2003, Astrophys. J., 126, 2949
- Cowley & Schmidtke (2004) Cowley A. P., Schmidtke P. C., 2004, Astrophys. J., 128, 709
- Cowley et al. (1997) Cowley A. P., Schmidtke P. C., McGrath T. K., Ponder A. L., Fertig M. R., Hutchings J. B., Crampton D., 1997, Publ. Astron. Soc. Pac., 109, 21
- de Jager et al. (1988) de Jager O. C., Raubenheimer B. C., North A. R., Nel H. I., van Urk G., 1988, Astrophys. J., 329, 831
- Edge & Coe (2003) Edge W. R. T., Coe M. J., 2003, Mon. Not. R. Astron. Soc., 338, 428
- Edge et al. (2004a) Edge W. R. T., Coe M. J., Corbet R. H. D., Markwardt C. B., Laycock S., 2004a, The Astronomer’s Telegram, 225, 1
- Edge et al. (2004b) Edge W. R. T., Coe M. J., Corbet R. H. D., Markwardt C. B., Laycock S., Marshall F. E., 2004b, The Astronomer’s Telegram, 216, 1
- Edge et al. (2004c) Edge W. R. T., Coe M. J., Galache J. L., McBride V. A., Corbet R. H. D., Markwardt C. B., Laycock S., 2004c, Mon. Not. R. Astron. Soc., 353, 1286
- Edge et al. (2004d) Edge W. R. T., Coe M. J., McBride V. A., 2004d, The Astronomer’s Telegram, 217, 1
- Edge et al. (2005a) Edge W. R. T., Coe M. J., Galache J. L., 2005a, The Astronomer’s Telegram, 405, 1
- Edge et al. (2005b) Edge W. R. T., Coe M. J., Galache J. L., McBride V. A., Corbet R. H. D., Markwardt C. B., Laycock S., Marshall F. E., 2005b, The Astronomer’s Telegram, 426, 1
- Edge et al. (2005c) Edge W. R. T., Coe M. J., Galache J. L., McBride V. A., Corbet R. H. D., Okazaki A. T., Laycock S., Markwardt C. B., Marshall F. E., Udalski A., 2005c, Mon. Not. R. Astron. Soc., 361, 743
- Edge (2005d) Edge W. R. T., 2005d, Ph.D. Thesis, University of Southampton
- Fabrycky (2005) Fabrycky D., 2005, Mon. Not. R. Astron. Soc., 359, 117
- Filipović et al. (2000) Filipović M. D., Haberl F., Pietsch W., Morgan D. H., 2000, Astron. Astrophys., 353, 129
- Frank et al. (2002) Frank J., King A., Raine D. J., 2002, Accretion Power in Astrophysics: Third Edition. Cambridge University Press
- Galache et al. (2005) Galache J. L., Corbet R. H. D., Coe M. J., Laycock S., Markwardt C. B., Marshall F. E., 2005, The Astronomer’s Telegram, 674, 1
- Grimm et al. (2003) Grimm H.-J., Gilfanov M., Sunyaev R., 2003, Mon. Not. R. Astron. Soc., 339, 793
- Haberl et al. (2000) Haberl F., Filipović M. D., Pietsch W., Kahabka P., 2000, Astron. Astrophys. Suppl. Ser., 142, 41
- Haberl & Pietsch (2004) Haberl F., Pietsch W., 2004, Astron. Astrophys., 414, 667
- Haberl & Pietsch (2005)
- Haberl et al. (2007) Haberl F., Pietsch W., Kahabka P., 2007, The Astronomer’s Telegram, 1095, 1 Haberl F., Pietsch W., 2005, Astron. Astrophys., 438, 211
- Haberl et al. (2004) Haberl F., Pietsch W., Schartel N., Rodriguez P., Corbet R. H. D., 2004, The Astronomer’s Telegram, 219, 1
- Haberl & Sasaki (2000) Haberl F., Sasaki M., 2000, Astron. Astrophys., 359, 573
- Horne & Baliunas (1986) Horne J. H., Baliunas S. L., 1986, Astrophys. J., 302, 757
- Hughes (1994) Hughes J. P., 1994, Astrophys. J., Lett., 427, L25
- Imanishi et al. (1998) Imanishi K., Yokogawa J., Koyama K., 1998, IAU Circ., 7040, 2
- Israel et al. (2000) Israel G. L., Campana S., Covino S., Dal Fiume D., Gaetz T. J., Mereghetti S., Oosterbroek T., Orlandini M., Parmar A. N., Ricci D., Stella L., 2000, Astrophys. J., Lett., 531, L131
- Israel et al. (1997) Israel G. L., Stella L., Angelini L., White N. E., Giommi P., Covino S., 1997, Astrophys. J., Lett., 484, L141+
- Israel et al. (1998) Israel G. L., Stella L., Campana S., Covino S., Ricci D., Oosterbroek T., 1998, IAU Circ., 6999, 1
- Jahoda et al. (2005) Jahoda K., Markwardt C. B., Radeva Y., Rots A., Stark M. J., Swank J. H., Strohmayer T. E., Zhang W., 2005, ArXiv Astrophysics e-prints, astro-ph/0511531
- Jahoda et al. (1996) Jahoda K., Swank J. H., Giles A. B., Stark M. J., Strohmayer T., Zhang W., Morgan E. H., 1996, in Proc. SPIE Vol. 2808, p. 59-70, EUV, X-Ray, and Gamma-Ray Instrumentation for Astronomy VII, Oswald H. Siegmund; Mark A. Gummin; Eds. In-orbit performance and calibration of the Rossi X-ray Timing Explorer (RXTE) Proportional Counter Array (PCA). pp 59–70
- Kahabka & Pietsch (1998) Kahabka P., Pietsch W., 1998, IAU Circ., 6840, 1
- Kaspi et al. (1993) Kaspi V. M., Johnston S., Manchester R. N., Bailes M., Bell J. F., Bessell M., Lyne A. G., D’Amico N., 1993, Bulletin of the American Astronomical Society, 25, 1434
- Lamb et al. (2002) Lamb R. C., Fox D. W., Macomb D. J., Prince T. A., 2002, Astrophys. J., Lett., 574, L29
- Lamb et al. (2002) Lamb R. C., Macomb D. J., Prince T. A., Majid W. A., 2002, Astrophys. J., Lett., 567, L129
- Lamb et al. (1999) Lamb R. C., Prince T. A., Macomb D. J., Finger M. H., 1999, IAU Circ., 7081, 4
- Laycock et al. (2003) Laycock S., Corbet R. H. D., Coe M. J., Marshall F. E., Markwardt C., Edge W., 2003, Mon. Not. R. Astron. Soc., 339, 435
- Laycock et al. (2005) Laycock S., Corbet R. H. D., Coe M. J., Marshall F. E., Markwardt C., Lochner J., 2005, Astrophys. J., Suppl. Ser., 161, 96
- Laycock et al. (2002) Laycock S., Corbet R. H. D., Perrodin D., Coe M. J., Marshall F. E., Markwardt C., 2002, Astron. Astrophys., 385, 464
- Laycock (2002) Laycock S. G. T., 2002, Ph.D. Thesis, University of Southampton
- Lochner et al. (1998) Lochner J. C., Marshall F. E., Whitlock L. A., Brandt N., 1998, IAU Circ., 6814, 1
- Lochner et al. (1999a) Lochner J. C., Whitlock L. A., Corbet R. H. D., Marshall F. E., 1999a, American Astronomical Society Meeting Abstracts, 194th Meeting
- Lochner et al. (1999b) Lochner J. C., Whitlock L. A., Corbet R. H. D., Marshall F. E., 1999b, Bulletin of the American Astronomical Society, 31, 742
- Lomb (1976) Lomb N. R., 1976, Astrophys. Space. Sci., 39, 447
- Macomb et al. (1999) Macomb D. J., Finger M. H., Harmon B. A., Lamb R. C., Prince T. A., 1999, Astrophys. J., Lett., 518, L99
- Macomb et al. (2003) Macomb D. J., Fox D. W., Lamb R. C., Prince T. A., 2003, Astrophys. J., Lett., 584, L79
- Maeder et al. (1999) Maeder A., Grebel E. K., Mermilliod J.-C., 1999, Astron. Astrophys., 346, 459
- Majid et al. (2004) Majid W. A., Lamb R. C., Macomb D. J., 2004, Astrophys. J., 609, 133
- Marshall et al. (1998) Marshall F. E., Lochner J. C., Santangelo A., Cusumano G., Israel G. L., dal Fiume D., Orlandini M., Frontera F., Parmar A. N., Corbet R. H. D., 1998, IAU Circ., 6818, 1
- Marshall et al. (1997) Marshall F. E., Lochner J. C., Takeshima T., 1997, IAU Circ., 6777, 2
- McGowan et al. (2007) McGowan K. E., Coe M. J., Schurch M., McBride V. A., Galache J. L., Edge W. R. T., Corbet R. H. D., Laycock S., Udalski U., Buckley D. A. H., 2007, to appear in Mon. Not. R. Astron. Soc.
- Press & Rybicki (1989) Press W. H., Rybicki G. B., 1989, Astrophys. J., 338, 277
- Sasaki et al. (2001) Sasaki M., Haberl F., Keller S., Pietsch W., 2001, Astron. Astrophys., 369, L29
- Sasaki et al. (2003) Sasaki M., Pietsch W., Haberl F., 2003, Astron. Astrophys., 403, 901
- Scargle (1982) Scargle J. D., 1982, Astrophys. J., 263, 835
- Schmidtke et al. (2004) Schmidtke P. C., Cowley A. P., Levenson L., Sweet K., 2004, Astron. J., 127, 3388
- Schmidtke & Cowley (2005a) Schmidtke P. C., Cowley A. P., 2005a, The Astronomer’s Telegram, 648, 1
- Schmidtke & Cowley (2005b) Schmidtke P. C., Cowley A. P., 2005b, Astron. J., 130, 2220
- Schmidtke & Cowley (2006) Schmidtke P. C., Cowley A. P., 2006, Astron. J., 132, 919
- Schmidtke et al. (2006) Schmidtke P. C., Cowley A. P., Udalski A., 2006, Astron. J., 132, 971
- Schmidtke & Cowley (2007) Schmidtke P. C., Cowley A. P., 2007, The Astronomer’s Telegram, 1181, 1
- Schmidtke & Cowley (2007b) Schmidtke P. C., Cowley A. P., 2007, American Astronomical Society Meeting Abstracts, 211, #03.06
- Schmidtke et al. (2007) Schmidtke P. C., Cowley A. P., Udalski A., 2007, The Astronomer’s Telegram, 1316, 1
- Southwell & Charles (1996) Southwell K. A., Charles P. A., 1996, Mon. Not. R. Astron. Soc., 281, L63
- Stanimirovic et al. (1999) Stanimirovic S., Staveley-Smith L., Dickey J. M., Sault R. J., Snowden S. L., 1999, Mon. Not. R. Astron. Soc., 302, 417
- Stella et al. (1986) Stella L., White N. E., Rosner R., 1986, Astrophys. J., 308, 669
- Stevens et al. (1999) Stevens J. B., Coe M. J., Buckley D. A. H., 1999, Mon. Not. R. Astron. Soc., 309, 421
- Torii et al. (2000) Torii K., Yokogawa J., Imanishi K., Koyama K., 2000, IAU Circ., 7428, 3
- Tsujimoto et al. (1999) Tsujimoto M., Imanishi K., Yokogawa J., Koyama K., 1999, Publ. Astron. Soc. Jpn., 51, L21
- Ueno et al. (2004) Ueno M., Yamaguchi H., Takagi S.-I., Yokogawa J., Koyama K., 2004, Publ. Astron. Soc. Jpn., 56, 175
- Wilson & Finger (1998) Wilson C., Finger M., 1998, IAU Circ., 7048, 1
- Wilson et al. (2003) Wilson C. A., Finger M. H., Coe M. J., Negueruela I., 2003, Astrophys. J., 584, 996
- Yokogawa et al. (2002) Yokogawa J., Imanishi K., Koyama K., Nishiuchi M., Mizuno N., 2002, Publ. Astron. Soc. Jpn., 54, 53
- Yokogawa et al. (2003) Yokogawa J., Imanishi K., Tsujimoto M., Koyama K., Nishiuchi M., 2003, Publ. Astron. Soc. Jpn., 55, 161
- Yokogawa et al. (2000b) Yokogawa J., Imanishi K., Ueno M., Koyama K., 2000, Publ. Astron. Soc. Jpn., 52, L73
- Yokogawa et al. (2000c) Yokogawa J., Torii K., Imanishi K., Koyama K., 2000, Publ. Astron. Soc. Jpn., 52, L37
- Yokogawa & Koyama (1998a) Yokogawa J., Koyama K., 1998a, IAU Circ., 6853, 2
- Yokogawa & Koyama (1998b) Yokogawa J., Koyama K., 1998b, IAU Circ., 7009, 3
- Yokogawa & Koyama (1998c) Yokogawa J., Koyama K., 1998c, IAU Circ., 7028, 1
- Yokogawa et al. (2000a) Yokogawa J., Torii K., Kohmura T., Imanishi K., Koyama K., 2000, Publ. Astron. Soc. Jpn., 52, L53