The Nascent Red-Sequence at 11affiliation: Based on observations with the NASA/ESA Hubble Space Telescope, obtained at the Space Telescope Science Institute, which is operated by the Association of Universities for Research in Astronomy, Inc., under NASA contract NAS 5-26555
Abstract
We present new constraints on the evolution of the early-type galaxy color-magnitude relation (CMR) based on deep near-infrared imaging of a galaxy protocluster at obtained using NICMOS on-board the Hubble Space Telescope. This field contains a spectroscopically confirmed space-overdensity of Lyman- and H- emitting galaxies which surrounds the powerful radio galaxy MRC 1138-262. Using these NICMOS data we identify a significant surface-overdensity () of red galaxies in the color-magnitude diagram (when compared with deep NICMOS imaging from the HDF-N and UDF). The optical-NIR colors of these prospective red-sequence galaxies indicate the presence of on-going dust-obscured star-formation or recently formed ( Gyr) stellar populations in a majority of the red galaxies. We measure the slope and intrinsic scatter of the CMR for three different red galaxy samples selected by a wide color cut, and using photometric redshifts both with and without restrictions on rest-frame optical morphology. In all three cases both the rest-frame slope and intrinsic color scatter are considerably higher than corresponding values for lower redshift galaxy clusters. These results suggest that while some relatively quiescent galaxies do exist in this protocluster both the majority of the galaxy population and hence the color-magnitude relation are still in the process of forming, as expected.
Subject headings:
galaxies: evolution — galaxies: formation — galaxies: high-redshift — galaxies: stellar content — galaxies: clusters: individual: MRC 1138-2621. Introduction
The color-magnitude diagram is a powerful diagnostic of galaxy evolution and formation. The presence, as early as , of a prominent and low-scatter, ‘red-sequence’ (RS) in galaxy clusters places useful constraints on the possible evolutionary pathways in galaxy color and luminosity (Mullis et al., 2005; Stanford et al., 2005, 2006; Bell et al., 2004; Faber et al., 2007). The red colors of the primarily early-type RS galaxies are due to the observed filters spanning the 4000Å spectral break. The universality and prominence of the RS in appropriately chosen filters have been used to discover high-redshift clusters (e.g., Gladders & Yee, 2005). Moreover, the defining characteristic of galaxy clusters, i.e., the large numbers of galaxies all at the same redshift, allows the slope and intrinsic scatter of the RS to be measured with great precision. Based on studies of galaxy clusters at , the slope of the RS does not appear to evolve and therefore is more likely the by-product of the mass-metallicity relation as observed in local galaxy samples (e.g., Tremonti et al., 2004) rather than the result of a mass-age trend. The scatter, however, is likely due to the fractional age differences between the RS galaxies (e.g., Blakeslee et al., 2003). By constructing a set of model galaxies with different star-formation histories and timescales it is possible to fit for the mean epoch of last significant star-formation by matching the intrinsic scatter of the RS. Such studies at have derived formation redshifts of (e.g., Blakeslee et al., 2006; van Dokkum & van der Marel, 2007). At redshifts beyond , however, the 4000Å-break moves into the near-infrared and galaxy clusters, and therefore the RS, have not been observed closer to the inferred epoch of formation for early-type galaxies. Hence, to uncover the younger or forming red-sequence at higher redshifts requires deep near-infrared imaging of suspected (or, preferably, confirmed) protocluster fields.
We have undertaken a NICMOS imaging program to study the red galaxy population in a protocluster at . Broad and narrow-band imaging, both in the optical and near-infrared, of the field surrounding the powerful radio galaxy MRC 1138-262 () have identified more than 100 candidate companion galaxies. This target served as the proof-of-concept for the successful VLT Large Program summarized in Venemans et al. (2007). There are surface-overdensities of both line-emitting candidates (Lyman- and H), X-ray point sources, sub-mm selected galaxies and red optical–near-infrared galaxies (Pentericci et al., 2002; Kurk, 2003; Kurk et al., 2004a, b; Croft et al., 2005; Stevens et al., 2003). Fifteen of the Ly and 9 of the H emitters have now been spectroscopically confirmed to lie at the same redshift as the radio galaxy. The -selected Extremely Red Objects (EROs; Vega) seem concentrated around the RG but have no spectroscopic redshifts at this time. However, by obtaining deep images through the NICMOS and filters, which effectively span the 4000Å-break at , accurate and precise colors and basic morphological parameters can be measured for the red galaxy population. In this paper we present the first results from this project. The article is organized as follows: in Section §2 we describe the data and their reductions, in Section §5 we present the comparison between the red galaxy counts in this field and in deep field data, in Section §6 we present the full color-magnitude diagram and our fits to the “red sequence.” We use a , cosmology throughout. At one arcsecond is equivalent to 8.4 kpc. All magnitudes are referenced to the AB system (Oke, 1974) unless otherwise noted.
2. Observations, Data Reductions and Photometry
The NICMOS instrument on-board HST is capable of deep near-infrared imaging more quickly than from the ground but with a relatively small field-of-view (). In the case of MRC 1138-262, we know that galaxies are overdense on the scale of a few arcminutes (Kurk et al., 2004a; Croft et al., 2005) and are thus well-suited for observations with NICMOS camera 3 on HST. We used 30 orbits of HST time to image 10 of the 24 confirmed members and of the candidate (narrow-band excess sources and EROs) protocluster members in both the and filters. We used seven pointings of NICMOS camera 3 in both filters and one additional pointing in alone. This single ‘outrigger’ pointing was included to obtain rest-frame optical morphological information for a small concentration of candidate members. These observations reach an AB limiting magnitude (; 10, diameter circular aperture) of mag in and mag in . The same field was imaged in the ( mag) and ( mag) filters using the Wide-Field Channel of the Advanced Camera for Surveys on HST as part of a Guaranteed Time program (# 10327; Miley et al. 2006). These optical data are useful for their higher angular resolution and their coverage of the rest-frame far-UV, thus extending the observed SEDs of candidate protocluster members to shorter wavelengths where young stars and on-going star-formation dominate the emitted spectrum. In particular, the and data allow us to partially differentiate obscured star-formation from evolved stellar populations in the candidate RS galaxies.
The NICMOS images were reduced using the on-the-fly reductions from the HST archive, the IRAF task PEDSKY and the dither/drizzle package to combine the images in a mosaic. The dither offsets were calculated using image cross-correlation and were refined with one further iteration of cross-correlation. Alignment of the pointings relative to each other was accomplished using a rebinned version of the ACS image as a reference. The final mosaic has a pixel scale of . Galaxies were selected using the -band image for detection within SExtractor (Bertin & Arnouts, 1996). We used a detection threshold with a minimum connected area of 10 pixels. We also corrected the NICMOS data for the count-rate dependent non-linearity (de Jong, 2006). Total galaxy magnitudes were estimated by using the MAG_AUTO values from SExtractor.
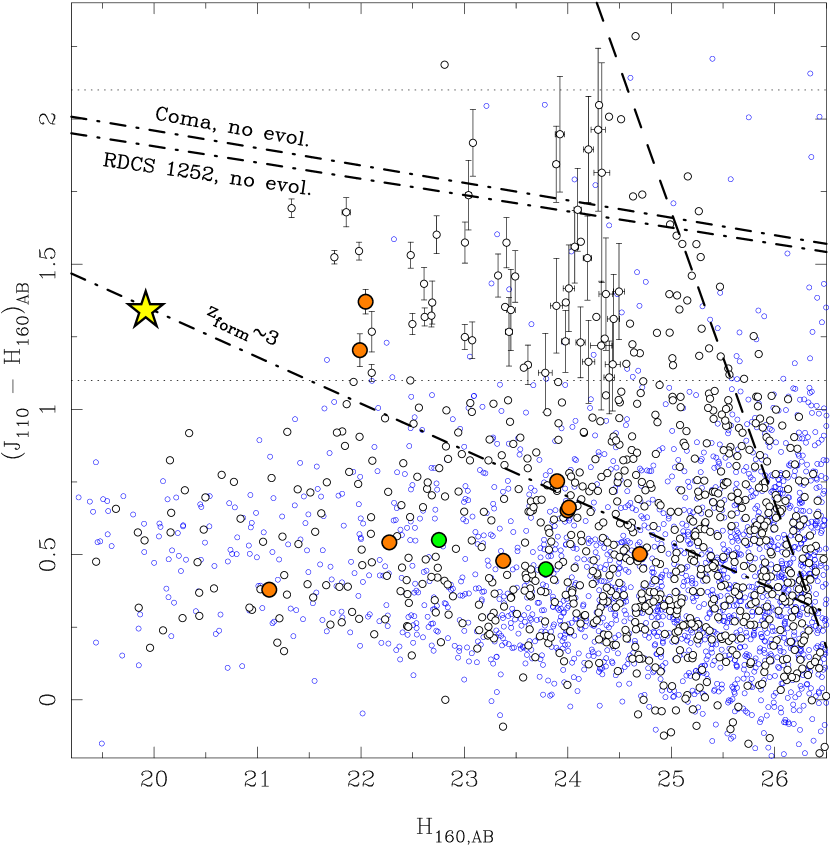
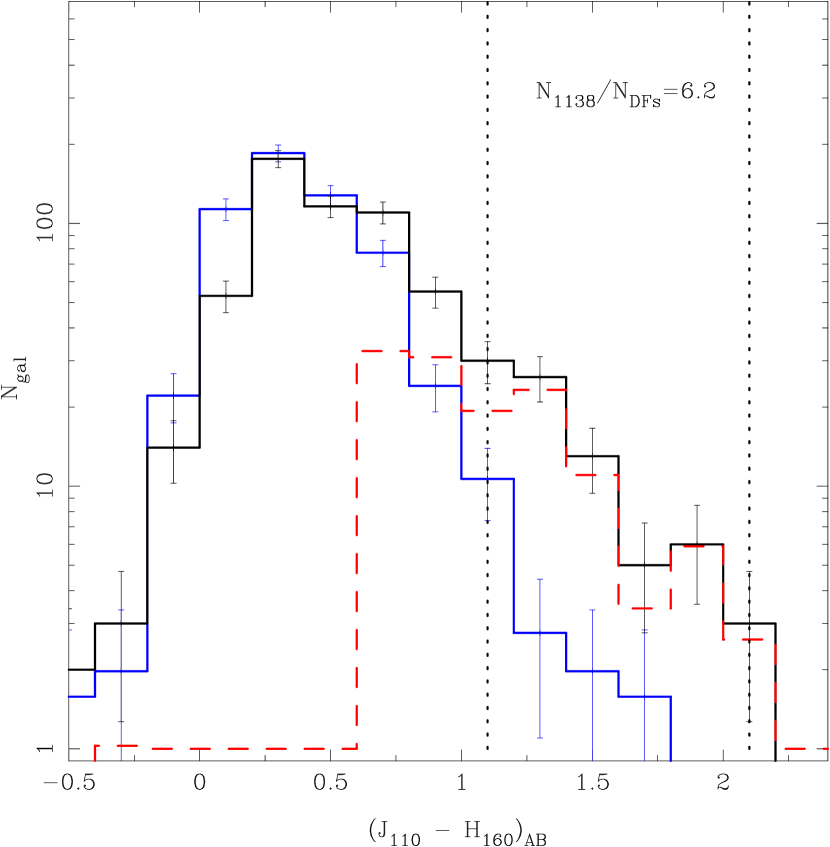
The colors were determined by running SExtractor (Bertin & Arnouts, 1996) in two-image mode using the image for object detection and isophotal apertures. The image was PSF-matched to the band. The resulting colors and magnitudes are shown in Figure 1. For galaxies which are not detected at significance in the -band (those to the right of the thick dashed line, representing , in Fig. 1) we consider the color to be a lower limit.
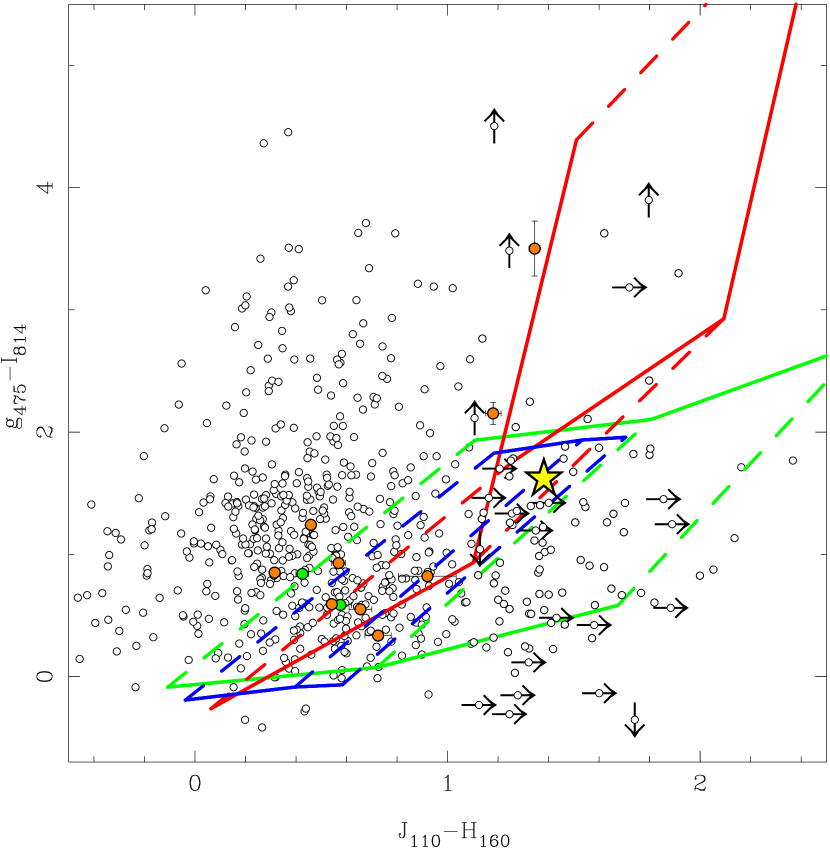
We also measured similarly PSF-matched, isophotal colors using the two ACS bands and have used them to construct a versus color-color diagram (Figure 2). We compared these colors to those of model SEDs for different ages, star-formation histories and dust extinctions. Using the 2007 Charlot & Bruzual population synthesis models we have constructed spectral energy distributions for galaxies with an exponentially-decaying star-formation rate with time constants of Gyr (the red, green and blue grids in Fig. 2 respectively). Each model’s colors are calculated for ages of 0.1, 1 and 3 Gyr and for and . Aging of the population moves primarily the color to the red while the dust extinction significantly reddens the color. From this analysis it appears that the Gyr model represents well the colors of a majority of the red galaxies.
To extend the wavelength coverage for the protocluster galaxies we also incorporated ground-based -band data from LRIS-B on the Keck telescope, -band imaging from VLT/ISAAC and three band IRAC imaging (the 3.6, 4.5 and 5.8 m bands) from the Spitzer Space Telescope. The Keck -band data (PI W. van Breugel) were obtained in late January and early February of 2003. The ISAAC data (PI G. Miley) were taken in Period 73 in service mode. The Spitzer data are from the IRAC Guaranteed Time program (PI G. Fazio, Program #17). We have smoothed the imaging data for all bands, apart from the IRAC data, to match the resolution of the -band image (approximated by a FWHM Gaussian). We then used SExtractor to measure galaxy magnitudes within a radius circular aperture for each smoothed image. To incorporate the IRAC data, which has much poorer angular resolution, we derived aperture magnitudes which were then corrected to match the smoothed data. These aperture corrections were derived using the photometric curves-of-growth for 20 stars in the field. The resulting catalog was used to generate photometric redshift estimates as described below in Section § 3.
3. Photometric Redshifts
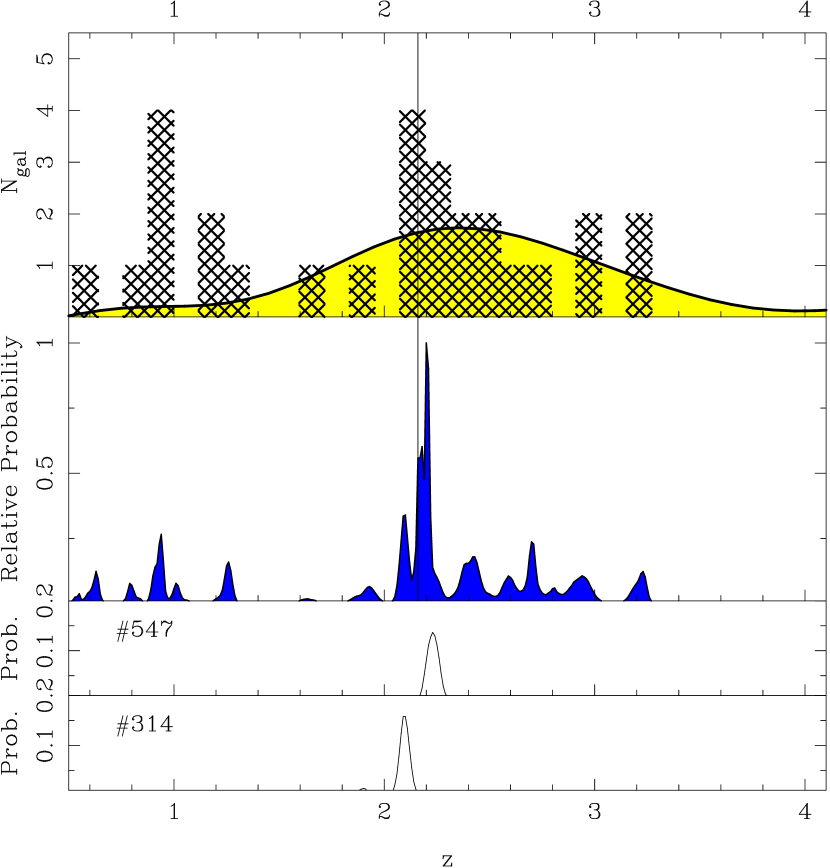
We have used the ACS (, ), NICMOS (, ), ground-based -band from Keck/LRIS-B, -band imaging from VLT/ISAAC and Spitzer/IRAC imaging to estimate photometric redshifts for our -band selected sample. We input a catalog of aperture galaxy magnitudes, based on the matched, smoothed images described above, into the Bayesian photometric redshift code (BPZ) of Benítez (2000) using a uniform prior. We felt that the default prior, based on optical galaxy selection and spectroscopy in the HDF-N, would not necessarily represent the redshift distribution for our near-infrared selected galaxies. We generated our own extensive set of template spectral energy distributions using the models of Charlot & Bruzual (2007). All these SEDs are models with values for Gyr and ages Gyr. We also included models with internal dust extinction ranging from mag and metallicity of . We focused particular attention on the selected surface-overdensity. In the upper panel of Figure 3 we present the high confidence () photo- distribution for the NIR-color selected () subsample. We ran extensive simulations by redshifting our template set, adding appropriate photometric errors and using BPZ to recover the redshifts. The yellow curve represents the redshift selection function for this color cut, template set and filters assuming that these model galaxies follow a uniform over this redshift interval. The simulation results were free of significant systematic errors and the random errors are estimated to be . Based on these SED fits, the approximate luminosity-weighted ages of the red galaxies lie between 1 and 2.5 Gyrs and their stellar masses are of order a few . These stellar masses are reasonable as are the absolute magnitudes (see Figure 6). More detailed SED modeling is deferred to a future paper.
There is a clear excess of galaxies between and . For each galaxy fit by BPZ we have generated the full redshift probability distribution. In the lower panel of Fig. 3 we show the -band weighted-average of these probability distributions. There is a clear peak (containing 38.5% of the total probability compared to only 17% of the total selection function in the same redshift interval) between and , consistent with the significant peak in the redshift histogram itself.
4. NICMOS Galaxy Morphologies
NICMOS camera 3 provides good angular resolution over its entire field-of-view. The FWHM of the PSF in our final mosaic is . To exploit this resolution we have used the GALFIT code (Peng et al., 2002) to fit analytic Sérsic surface-brightness profiles (Sersic, 1968) to all the sources in our -band mosaic. A model point-spread function was created for each of these galaxies individually by generating a TinyTim simulated PSF (Krist, 1993) at the galaxies’ positions in each exposure and then drizzling these PSFs together in exactly the same fashion as for the data themselves (see Zirm et al. 2007). We restricted the Sérsic index, , to be between 1 and 5. We will present a full analysis of the morphologies of these galaxies in a future paper. For the current work, we use these derived sizes and profile shapes to assist us in selecting the morphological “early-type” members of the red galaxy population.
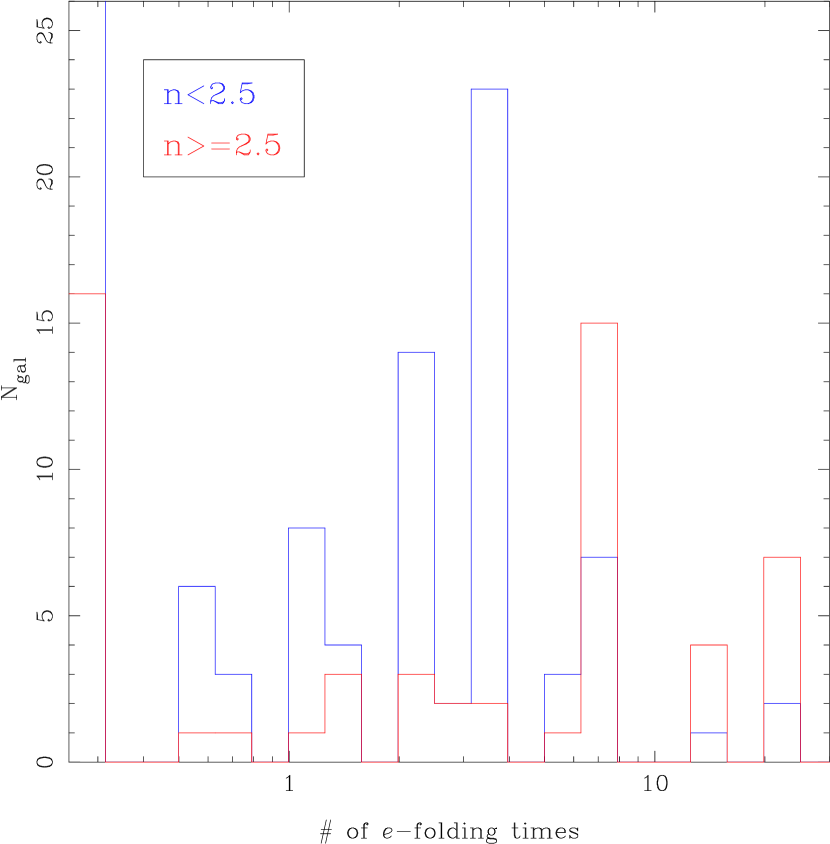
In Figure 4 we show the distribution of galaxy ages derived via these SED fits as parametrized by the value for the best-fitting model for those galaxies with high and low Sérsic index (, red line, and , blue line). It is clear that while there is substantial overlap between these distributions they are not identical and that they differ in the sense that one might expect, namely, that the concentrated galaxies appear to be comprised of older stellar populations. This trend gives us some confidence in trying to select the “early-type” galaxies using these data which is important for our discussion of the color-magnitude relation in Section 6.
5. Surface Overdensity of Red Galaxies
To compare this protocluster field to more generic ‘blank’ field data we have compiled catalogs for the public NICMOS data in both the Hubble Deep Field North (HDF-N) and the Ultra Deep Field (UDF). Figure 1 shows the color-magnitude diagram (open black circles) and the color distributions for both the MRC 1138-262 and the combined HDF-N and UDF galaxy catalogs (blue circles). The deep field data were also -band selected. The area of the two deep fields is roughly 2.5 times the area of our protocluster observations. We have applied no correction to the deep field number counts to account for clustering in those fields. The color histogram in Figure 5 shows the area-normalized galaxy counts from the two deep fields (blue line) and from the 1138 field to the same () limiting magnitude of mag (AB). The red dashed line shows the difference between the two color distributions. It is clear that the radio galaxy field is overdense in red galaxies by a large factor. For sources with colors between , the horizontal(vertical) dotted lines in Fig.1(5), and brighter than our -band limit (), we calculate an area-normalized overdensity of when compared to the deep fields data. We note that the exact value of the measured overdensity is rather sensitive to systematic color offsets between the protocluster and deep field data. A redward shift of 0.05 for the deep field galaxies would lower the measured overdensity to . However, we are confident that these systematic offsets remain small ( mag) since we have used the same instrument, filters, selection technique and photometric code with very similar input parameters for both the deep field and 1138 datasets. Looking back at Figure 2 we can see that many of the spectroscopically-confirmed line emitters (filled blue circles) and red galaxies in the overdensity are well-represented by the Gyr model (green lines) at different ages and extinctions.
This current work is not the first to observe red galaxies in this field. Kurk et al. (2004) identified a small () surface overdensity of extremely red objects (EROs; Vega magnitudes) using ground-based and band data. Many of these EROs are also identified as red in the NICMOS color. More recently Kodama et al. (2007) observed this field using the wide-field NIR imager, MOIRCS, on the Subaru telescope. These authors found several bright (presumably massive) red galaxies over a wider field-of-view but to shallower depths than the NICMOS data presented here. 24 of their color-selected protocluster candidates are within our NICMOS mosaic. 23 of the 24 are identified in our data as being red in . Furthermore, 18 of the 94 galaxies which satisfy our color criteria (and have ) are also identified by Kodama et al. as protocluster candidates. The much larger number of red galaxies in the NICMOS data is primarily due to fainter galaxies detected at high significance in our deeper data.
6. An Emergent Red-Sequence?
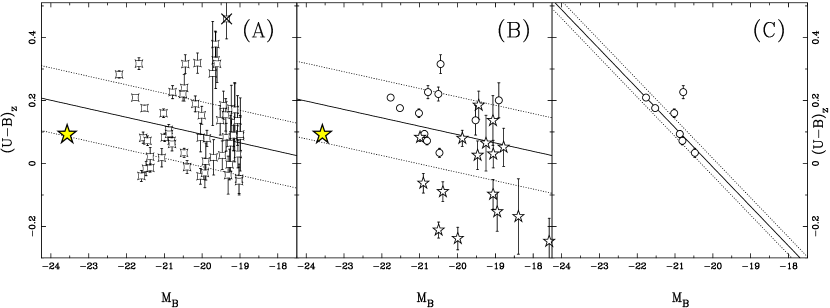
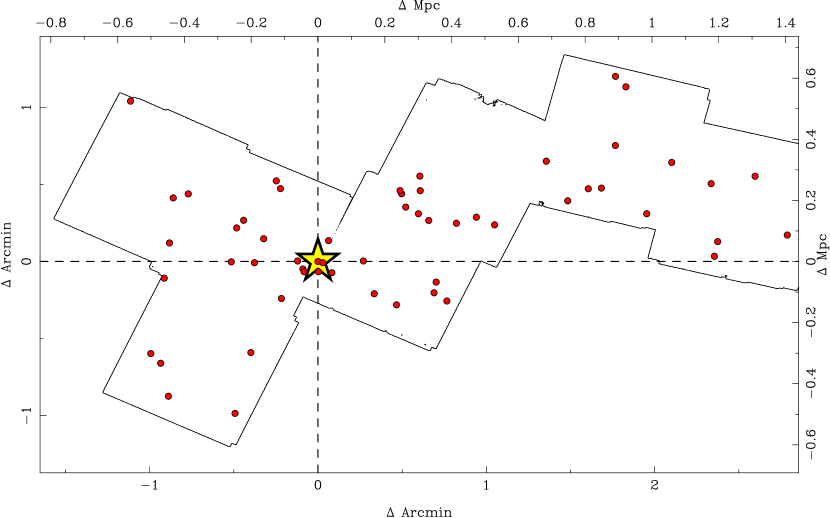
To study the colors and magnitudes of these galaxies in more detail and to possibly identify a red-sequence in the 1138 field we have split the galaxies into three sub-samples defined by color, photometric redshift and morphology (Sérsic index). The first sample (Sample A) comprises all 56 galaxies with and and includes the radio galaxy itself. Sample B is made up of all 28 galaxies with a robust photometric redshift between 2.0 and 2.5 and and . This liberal color cut is included to select galaxies which comprise the large observed surface-overdensity. Finally, sample C contains seven galaxies with the same photometric redshift cut but which also have well-resolved -band surface-brightness profiles with Sérsic index . All of these galaxies’ SEDs are also best-fit by models with relatively little on-going star-formation. We use a limit of (age , cf. Grazian et al 2007 ). Therefore, sample C mimics the color, morphological and photometric redshift selection of early-type galaxies in clusters at . The photometry, photo-s and sizes of the sample C galaxies are listed in Table 1, their rest-frame color-magnitude distributions are shown in Figure 6 and the two-dimensional spatial distribution of the Sample A galaxies is plotted in Figure 7. We note that because the measured overdensity is a factor of 6, we statistically expect one of every seven sample A galaxies to be a field galaxy. However, this should not effect our results significantly.
For these three sample selections we have fit a line and measured the intrinsic scatter about that best-fit line (see Fig. 6). For comparison to lower redshift galaxy clusters we have transformed our observed color and magnitudes into rest-frame and (Vega), respectively, using the following expressions:
| (1) |
| (2) |
The small color corrections used in these relations were derived using a family of -models with a range of ages (0.1-12 Gyr), (0.1-5 Gyr) and three metallicities ( and ).
To fit the “CMR” we used a bootstrap re-sampling technique to estimate the error on the fitted slope. Then, by assuming that all the red galaxies lie on this fit line, we ran Monte Carlo realizations of the contribution of the photometric errors to the observed color scatter about the fit line, i.e., by fixing a color-magnitude relation we calculate the measurement scatter with zero intrinsic scatter. We then calculate the intrinsic scatter by subtracting (in quadrature) the estimated measurement scatter from the observed scatter. We show these fits (solid line) and the intrinsic scatters (dotted lines) for the three samples (A, B and C) in Figure 6. The fits to both Sample’s A and B have nearly identical rest-frame slopes, and respectively, and intrinsic scatters ( and ). While these slopes are comparable to those found for the well-populated lower redshift cluster CMRs, the intrinsic scatters are considerably higher. However, the scatter measured for the eight galaxy Sample C is comparable to that of the lower redshift samples but with a much steeper slope (). When these scatters are compared to model predictions based on lower redshift clusters (specifically RDCS 1252.9-2927 at ; Gobat et al. 2008) we find that the 1138 protocluster has lower than predicted scatter. This may suggest that the 1138 protocluster is in a more advanced evolutionary state than RDCS 1252 was at .
We have calculated three representative color-magnitude relations for comparison to the colors and magnitudes of the red galaxies (three dot-dash lines in Fig. 1). We have taken two lower redshift clusters, Coma at and RDCS 1252.9-2927 at , and transformed them to the observed filters and under the assumption that the colors do not evolve. In this no evolution case (the two dot-dash lines in Fig. 1) the CMRs appear at the red edge of the observed overdensity. There is almost exactly 2 Gyr of cosmic time between and in our adopted cosmology. From Blakeslee et al. (2003) we know that the median redshift of last significant star-formation for the RDCS 1252 galaxies is between . Therefore, if we observe those galaxies at they will be significantly younger and hence bluer. In fact, this passively de-evolved line (bluest dot-dash line in Fig. 1, labeled ‘’) does fall blueward of the red galaxy overdensity. We discuss the implications for these comparisons in Section 7.
We have also translated the Kodama et al. ground-based colors to our NICMOS filters assuming all the red galaxies lie at . These bright galaxies also fall along the passively de-evolved line with the radio galaxy. We have used our suite of SED models to estimate the color transformation from their ground-based to our NICMOS color. Roughly, the Kodama et al. bright red galaxies fall where the RDCS 1252 passive line crosses our color cut at . This result hints at a possible bi-modality in the red galaxy population of this protocluster. Namely, that there are faint red galaxies that are inconsistent with passively-evolving cluster members either due to large amounts of dust, or due to higher redshifts of formation but that the more luminous protocluster members may have already finished forming and seem consistent with passive evolution to the present-day.
7. Discussion
We have identified a (6.2) surface-overdensity and a corresponding photometric redshift ‘spike’ of red galaxies which are likely associated with a known protocluster at . The optical-NIR spectral energy distributions of these sources suggest that they comprise both evolved galaxies as well as dust-obscured star-forming galaxies. Based on our SED fits from the photometric redshift determinations, the approximate luminosity-weighted ages of these sources lie between 1 and 2.5 Gyrs and their stellar masses are of order a few . Detailed modeling of the SEDs for the protocluster population, along with their morphologies, is reserved for a future paper.
Comparison with the CMRs of lower redshift clusters shows that the red galaxy overdensity primarily lies blueward of the no-evolution predictions. That the red galaxies in 1138 are also redder than the case suggests both that there are galaxies with significant dust content, an assertion supported by the SED fits, and also that they were perhaps formed at higher redshift than the RDCS1252 galaxies. Of course, without a classical, low-scatter red-sequence to use as a baseline there remains considerable uncertainty in the age of the population as a whole. The results of Steidel et al. (2005) suggest that protocluster galaxies are older than their “field” counterparts at and that these ages and stellar masses were broadly consistent with evolution to lower redshift cluster galaxies. However, their protocluster members were all UV-selected and star-forming. With future spectroscopy of our red galaxy sample it will be possible to see if these differences persist when looking at a more varied galaxy sample.
For three samples of galaxies drawn from the full -band selected dataset we have fit a color-magnitude relation and estimated the intrinsic scatter. The CMR at is not as well-defined as at or 0. For sample C, made up of 8 galaxies, the color, best-fit spectral template, morphology and photo- all point towards them being (proto-)elliptical galaxies within the protocluster. For this small sample, the estimated intrinsic scatter is rather low and may suggest that these galaxies represent the forming red-sequence in this protocluster. The slope of this relation is extremely steep compared to lower redshift clusters. The slope of the CMR is generally assumed to be a manifestation of the mass-metallicity relation and would therefore flatten at higher redshift. The major caveat regarding the steep slope of Sample C is that none of these galaxies are spectroscopically confirmed protocluster members. Therefore, this “relation” may just be a random, although somewhat unlikely, coincidence rather than a nascent CMR. However, further deep NIR imaging coverage of this field is required to identify additional members of this proto-elliptical galaxy class.
References
- Bell et al. (2004) Bell, E. F., et al. 2004, ApJ, 608, 752
- Benítez (2000) Benítez, N. 2000, ApJ, 536, 571
- Bertin & Arnouts (1996) Bertin, E. & Arnouts, S. 1996, A&AS, 117, 393
- Blakeslee et al. (2003) Blakeslee, J. P., et al. 2003, ApJ, 596, L143
- Blakeslee et al. (2006) Blakeslee, J. P., et al. 2006, ApJ, 644, 30
- Bruzual & Charlot (2003) Bruzual, G. & Charlot, S. 2003, MNRAS, 344, 1000
- Charlot & Bruzual (2007) Charlot, S. & Bruzual, G. 2007, in prep
- Croft et al. (2005) Croft, S., Kurk, J., van Breugel, W., Stanford, S. A., de Vries, W., Pentericci, L., & Röttgering, H. 2005, AJ, 130, 867
- de Jong (2006) de Jong, R. 2006. Correcting the nicmos count-rate dependent non-linearity. Technical report, STScI
- Faber et al. (2007) Faber, S. M., et al. 2007, ApJ, 665, 265
- Gladders & Yee (2005) Gladders, M. D. & Yee, H. K. C. 2005, ApJS, 157, 1
- Gobat et al. (2008) Gobat et al., 2008, submitted to A&A
- Grazian et al. (2007) Grazian, A., et al. 2007, A&A, 465, 393
- Kodama et al. (2007) Kodama, T., Tanaka, I., Kajisawa, M., Kurk, J., Venemans, B., De Breuck, C., Vernet, J., & Lidman, C. 2007, MNRAS, 377, 1717
- Krist (1993) Krist, J. 1993, in ASP Conf. Ser. 52: Astronomical Data Analysis Software and Systems II 536
- Kurk (2003) Kurk, J. D. 2003, May. The cluster environments and gaseous halos of distant radio galaxies. Ph. D. thesis, Leiden University
- Kurk et al. (2004a) Kurk, J. D., Pentericci, L., Röttgering, H. J. A., & Miley, G. K. 2004a, A&A, 428, 793
- Kurk et al. (2004b) Kurk, J. D., Pentericci, L., Overzier, R. A., Röttgering, H. J. A., & Miley, G. K. 2004b, A&A, 428, 817
- Miley et al. (2006) Miley, G. K., et al. 2006, ApJ, 650, L29
- Mullis et al. (2005) Mullis, C. R., Rosati, P., Lamer, G., Böhringer, H., Schwope, A., Schuecker, P., & Fassbender, R. 2005, ApJ, 623, 85
- Oke (1974) Oke, J. B. 1974, ApJS, 27, 21
- Peng et al. (2002) Peng, C. Y., Ho, L. C., Impey, C. D., & Rix, H.-W. 2002, AJ, 124, 266
- Pentericci et al. (2002) Pentericci, L., Kurk, J. D., Carilli, C. L., Harris, D. E., Miley, G. K., & Röttgering, H. J. A. 2002, A&A, 396, 109
- Sersic (1968) Sersic, J. L. 1968, Atlas de galaxias australes Cordoba, Argentina: Observatorio Astronomico, 1968
- Stanford et al. (2005) Stanford, S. A., et al. 2005, ApJ, 634, 129
- Stanford et al. (2006) Stanford, S. A., et al. 2006, ApJ, 646, 13
- Steidel et al. (2005) Steidel, C. C., Adelberger, K. L., Shapley, A. E., Erb, D. K., Reddy, N. A., & Pettini, M. 2005, ApJ, 626, 44
- Stevens et al. (2003) Stevens, J. A., et al. 2003, Nature, 425, 264
- Tremonti et al. (2004) Tremonti, C. A., et al. 2004, ApJ, 613, 898
- van Dokkum & van der Marel (2007) van Dokkum, P. G. & van der Marel, R. P. 2007, ApJ, 655, 30
- Venemans et al. (2007) Venemans, B. P., et al. 2007, A&A, 461, 823
- Zirm et al. (2007) Zirm, A. W., et al. 2007, ApJ, 656, 66
| ID | aaThe errors on these photometric redshifts are approximately 0.1-0.2 | OddsbbThe ODDS parameter approaches unity when the probability distribution function has a single narrow peak | SED TypeccBest-fit broad-band template type: 0: dusty and star-forming 1: quiescent | Sérsic | ddTotal magnitudes based on the SExtractor MAG_AUTO parameter | ||||||
|---|---|---|---|---|---|---|---|---|---|---|---|
| (BPZ) | Index | () | (kpc) | (AB) | (AB) | (AB) | (AB) | (AB) | |||
| () | |||||||||||
| 606 | 2.04 | 0.98 | 1.00 | 3.4 0.4 | 0.21 0.01 | 1.79 0.10 | 23.09 0.03 | 1.10 | 0.79 | 1.18 | 1.06 |
| 507 | 2.09 | 1.00 | 1.00 | 5.0 0.4 | 0.24 0.01 | 1.99 0.08 | 22.50 0.01 | 28.88 | -27.16 | 2.22 | 1.52 |
| 314 | 2.10 | 1.00 | 1.00 | 5.0 0.7 | 0.15 0.01 | 1.28 0.05 | 23.03 0.01 | 1.92 | 1.38 | 1.89 | 1.29 |
| 586 | 2.10 | 1.00 | 1.00 | 5.0 0.3 | 0.40 0.03 | 3.34 0.23 | 21.77 0.01 | 1.80 | 1.89 | 2.22 | 1.61 |
| 547 | 2.23 | 1.00 | 1.00 | 5.0 0.6 | 0.12 0.00 | 1.02 0.04 | 22.70 0.01 | 1.30 | 1.13 | 1.67 | 1.36 |
| 493 | 2.25 | 1.00 | 1.00 | 3.5 0.3 | 0.56 0.04 | 4.72 0.36 | 22.75 0.02 | 0.63 | 1.28 | 2.19 | 1.64 |
| 312 | 2.42 | 1.00 | 1.00 | 5.0 0.3 | 0.38 0.02 | 3.20 0.19 | 22.00 0.01 | -28.02 | 1.45 | 1.94 | 1.55 |
| 127 | 2.44 | 1.00 | 1.00 | 2.7 0.6 | 0.12 0.02 | 1.01 0.18 | 22.64 0.01 | 0.34 | 1.04 | 1.37 | 1.40 |