Spitzer-IRAC GLIMPSE of High Mass Protostellar Objects
Abstract
The Spitzer-GLIMPSE point source catalog and images have been used to study a sample of 381 massive protostellar candidates. IRAC-Point source photometry was used to analyse colours, magnitudes and spectral indicies of the infrared counterparts (IRCs) of massive protostellar objects and a bonafide sample of 50 point sources was obtained. Spectral energy distributions (SEDs) of these 50 sources was extended to the near-infrared and millimeter range by using 2MASS and millimeter data from the literature. An online SED fitter tool based on Monte-Carlo radiative transfer of an accretion model involving star,disk and envelope was used to fit the SEDs of the 50 sources. The IRCs to massive protostellar objects are found to successfully imitate the SEDs of evolutionary phases similar to low mass star formation. Envelope accretion, rather than disk accretion is found to be dominant in building the most massive stars. Unresolved centimeter continuum emission is associated with 27 IRCs classified as massive protostars suggesting that ionised accretion flows may play an important role along with the molecular component. The morphology of the infrared nebulae surrounding the IRCs have an unusual resemblance to the morphologies of ultra-compact HII regions suggesting that these infrared nebulae are possible precursors to the UCHII regions.
Centro de Astrofisica da Universidade do Porto, Rua das Estrelas, s/n, 4150-762, Porto, PORTUGAL
1. Introduction
In recent years, extensive observational data in the infrared and millimeter bands have led to the belief that the formation of massive stars mostly involves accretion phenomenon similar to the formation of low mass stars (e.g. Whitney 2005). Whether the massive protostars are scaled up versions of low mass protostars or if they go through continuuing accretion on to zero-age main sequence stars is an issue under debate (e.g: see the review by Zinnecker & Yorke 2007). Addressing these issues through direct observations requires angular resolutions of an order of magnitude better than what is currently possible in the infrared and millimeter range. The recently made available GLIMPSE survey already provides a breakthrough in the spatial scales and sensitivity which is much higher than the upto now popular MSX and IRAS surveys. The Spitzer-IRAC point spread function of 2′′ in the 3.6-8 m bands are comparable to that of 2MASS in the J,H,K bands which allows us to probe scales of a few thousand AU at mean distances of 3-5 kpc where high mass protostellar objects (HMPOs) are commonly found. Similarly 1′′ resolution observations in the millimeter bands made possible by the Plateau de Bure interferometer or the Sub Millimeter Array has unveiled disks and toroids around several HMPOs (e.g. Beltrán et al. 2006; Beuther et al. 2007).
A decade long effort, that used systematic selection criteria involving constraints on the IRAS colours and other signposts of massive star formation such as masers and outflows, has resulted in four HMPO candidate samples, covering the northern and southern hemispheres of the sky (Molinari et al. 1996; Sridharan et al. 2002; Fontani et al. 2002; Faúndez et al. 2004)(hereafter Mol96, Sri02, Fon02, Faun04). These surveys have provided a sample of 500 objects and a major fraction of the sample has been investigated extensively to evaluate the dense gas, dust continuum, ionised emission and maser associations. Using the 2MASS point source catalog, Kumar et al. (2006) looked for clustering around the HMPOs in the northern hemisphere and found 54 embedded clusters and several near-infrared counterparts to these objects. In this work, we extend such as study to a more complete sample of HMPOs using the GLIMPSE survey data.
2. Infrared counterparts to HMPOs
Of the 500 targets from the Mol96, Sri02, Fon02 and Faun04, 381 targets were covered by the GLIMPSE fields for which point source photometry and images were extracted. Point sources within a 100′′ radius centered on each target were used for colour, magnitudes and spectral index analysis whereas images with a size of 300′′ were extracted for examining nebulosities and clustering. The distance to each target was taken as listed in the original references and a mean distance of 5 kpc was assumed for sources when an estimate was not available. The point sources were placed on a [3.6-4.5] vs [5.6-8.0] colour-colour diagram and separated into the evolutionary stages of Class I, II and III based on the definitions of Robitaille et al. (2006)(hereafter RWIWD06). The fluxes in the four IRAC bands namely 3.6, 4.5, 5.8 and 8.0 m bands were fitted with a simple least squares linear fit to obtain the spectral index in these bands. Since the interest is not only to finding redenned objects but also luminous objects, we defined a parameter called alpha-magnitude product AM = -M(+6)/10 where M8μm is the 8.0m absolute magnitude of the source and the observed IRAC spectral index. The constants 6 and 10 in the above equation were chosen arbitrarily to effectively separate the high sources from the rest. For more details see Kumar & Grave (2007).
In Fig. 1a we show a [3.6-4.5] vs [5.6-8.0] colour-colour diagram for all the sources detected from all target lists. The main concentration of points at (0,0) represents photospheres and higher values on both the x and y axes represent young stellar objects (YSOs) considered to be at different evolutionary stages. The regions representative of the evolutionary stages such as I, and II based on the 2D radiative transfer model data of RWIWD06 are marked. The diamonds represent candidate massive protostars which are those points lying to the right side of the vertical dashed line in Fig1b. Fig. 1b shows a AM product vs M8μm (absoulte magnitude) for point sources from all the targets. The solid curves represent 20M⊙and 8M⊙ class I object models for all inclinations computed by RWIWD06. Fig. 1c shows the histogram of the IRAC spectral indicies for all observed point sources. The histograms of the IRAC for YSOs in the Orion cloud and starsYSOs in the IC348 region are shown for comparision. The colour and magnitude analysis shows that several point sources observed close to the HMPO targets display infrared excess emission in the IRAC bands that imitate the colours of YSO’s in the Class I, II, III phases, and a good fraction of these are also luminous. Many point sources that are saturated in the IRAC bands may actually qualify as better IRCs. 37 saturated sources have been found to coincide well with the HMPO target positions in our sample.
The colours and magnitudes analysis presented in Fig. 1 shows that: a) the point sources in the HMPO fields have unusually high values (5), even higher than many of the deeply embedded Class I sources in Orion, showing that IRCs are indeed deeply embedded sources inside very dense cores and, b) a significant fraction of these IRCs are also luminous and represent 8-20 M⊙ Class I type objects when compared with accretion models.

A total of 79 sources with AM6 were classified as luminous IRCs to HMPO targets with photometry available in all four IRAC bands. Of these, 11, 27, 23 and 25 are from the samples of Mol96, Sri02, Fon02, and Faun04 respectively and does not include the 37 saturated sources. These luminous IRCs are centred on the IRAS/mm peaks in the target fields with a nominal spread consistent with beam sizes and positional uncertainities. Some of these luminous IRCs can be reddened photospheres (particularly those with [5.8-8.0]0.4 colours) and some are probably evolved protostars; therefore, a complete SED analysis described in Sec. 4 was made.
3. Infrared Nebulae
The IRAC images of the HMPO targets reveal compact nebulae (10′′-60′′angular sizes) around several sources. The nebulae are found to be brightest in the 8 m band and mostly invisible in the 3.6 m IRAC band. We have used the 4.5, 5.8 and 8.0 m band images coded as blue, green, and red, respectively to generate composite false colour images for the observed nebulae. The analysis of the images are described by Kumar & Grave (2007) and are also available online111The colour images can be accessed at http://www.astro.up.pt/nanda/hmpo/. The infrared nebulae repeatedly display cometary (e.g.: I18437-0216), core-halo (e.g: I18337-0743, I19403+2258), shell-like (e.g.: I19198+1423) and bipolar (e.g.:I18530+0215, I19213+1723) morphologies which are similar to the morphologies of UCHII regions (Kurtz et al. 1994) and bipolar outflows . Some images display only a single well-defined nebula, whereas others show a group of compact nebulae. A histogram of the projected sizes of these nebulae displays a distribution in the range 0.1-1.0 pc with a mean value of 0.5 pc. These dimensions are similar to or smaller than the size of dense cores traced by the 1.3 mm continuum maps (Beuther et al. 2002). The 8.0 m band is dominated by PAH emission, which is known to be a tracer of radiation temperature. Ionising radiation from young massive stars, that may not yet be strong enough to produce a significant ionised region may therefore be traced by these infrared nebulae. Indeed a recent investigation has shown that the underlying structure of the ISM in such nebulae can possibly be inferred using the morphology of the nebulae at various density regimes and ionising fluxes (Heitsch et al. 2007). Therefore, the morphology of the nebulae found here may well indicate the morphology in which ionising radiation is escaping from the underlying set up of physical structures close to the star. Recently Churchwell et al. (2006) used the GLIMPSE images to identify bubbles around OB stars in the Galaxy and argue that the smaller bubbles around several B stars are those produced by relatively soft radiation that fails to produce significant HII regions. The infrared nebulae around the HMPOs may well represent such bubbles or could be simple reflection nebulae due to an evolved generation of B stars.
4. Radiative Transfer Modelling of the SEDs
As described in Sec. 2, the high AM product sources are our best candidates of luminous IRCs to the HMPO targets. A bonafide list of 50 IRCs was made from the 79 high AM IRCs by using the constraint that the high AM product IRC was found within 2′′of the observed mm/submm peak. We then extended the SEDs of this bonafide sample to the near-infrared and millimetre wavelength range by using the 2MASS point source catalog, millimeter observations from Beuther et al. (2002) and the submillimeter data from SCUBA (Williams et al. 2004) and SIMBA cameras (Beltrán et al. 2006). Data with the highest available angular resolution was used for the SEDs. In two cases, interferometric observations in the mm and submm range were available that was utilised. The IRAC and 2MASS fluxes are restricted to their PSF sizes of less than 2′′and typical mm/submm beam widths are 6′′. The resulting SEDs were fitted with an online SED fitter tool developed and tested on low mass YSOs by Robitaille et al. (2007).
4.1. The SED fitting tool
The SED fitting tool described by Robitaille et al. (2007) is based on a grid of radiative transfer models described by RWIWD06. The models assume axisymmetric young stellar objects with a photosphere, disk, and infalling envelope. The upper limit of the mass range is 50M⊙and the physics that governs the higher mass regime is based on accretion models described by Whitney et al. (2004). A pre-calculated grid of model SEDs, computed using 14 variables are compared with the observed data. The models for which the difference between the value per data point of the fit and the best value per data point is smaller than three are returned by the tool as the best fit models. Multiple models are returned by the tool for a given set of data points depending on the data quality, such as number of data points and their errors that define the SED. This results in a degeneracy which is typically 200 for the input SEDs we have used. In the presence of such high degeneracy, we adopt a method of constructing histograms for each physical parameter and finding the peak or by plotting a two parameter plot for all models and choosing the median of the distribution. For example to choose the best value of mass and time, we would plot a two parameter plot of mass vs time given by all the models, and if it results in a distribution centered on a particular mass and time value, those values are taken as the median representative values for mass and time of the source. These methods are explained in detail by Grave & Kumar (2008).
4.2. SED fitting results
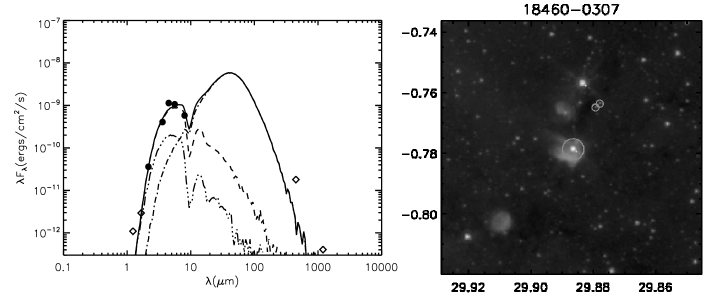
Figure. 2 shows the best fit model for the source IRAS18460-0307 along with an 8 m image of the source. The solid line shows the best fit model for an aperture of 15000AU, the dashed line represents disk emission, dot-dashed line the envelope component and the multiple-dot-dashed line the scattered component of the emission. The median values of the physical parameters from model fits, such as mass, disk accretion rate, envelope accretion rate, stellar radii and age were tabulated for all the 50 sources. In those cases where higher spatial resolution data from the interferometers was available for the millimeter or submm bands, the degeneracy of the model fits was very low, demonstrating the importance of such observations at longer wavelengths. Infact, a single model fit was obtained for the source IRAS18089-1732.
The estimated physical parameters from the model fits span a range consistent with the known physics of massive stars. These parameters have a range of M = 6–45 M⊙, R = 10-100 R⊙, t = 103–105 yr, Mdisk = 0–0.9 M⊙, and 10-4M⊙yr-1–10-2M⊙yr-1. These values are consistent with the input physics assumed in the SED model fitter. While the observed data is well modelled by assumed accretion scenario model, it is necessary to examine which of the estimated parameters are independent of the limitations of the model. In Fig. 3 we plot the accretion rate versus age of the source, representing the mass of the sources using symbols of different sizes. Circles represents disk accretion rate whereas triangles and squares represent envelope accretion rate. Squares are sources without disks. It can be seen from the figure that the most massive stars (biggest symbols, M30M⊙) are all squares, meaning that they do not pocess any disks and are also among the youngest sources in the plot. The remaining symbols are more or less evenly spread around in time but not in . Although the model grid consists of many models for massive stars with disks and envelopes together, the observed data best matches with massive star models without disks. Therefore, the result that “envelope accretion is the dominant factor in building massive stars” and the value 10-4–10-2M⊙yr-1 is independent of any limitations that could be inherent in the model grid.

5. Implications
The SEDs of the IR counterparts to HMPO candidates can be well fitted by accretion models involving an infalling envelope, disk, photosphere, bipolar cavity and a radiative equilibrium solution. In this scenario, the HMPO IRCs imitate the classical YSO phases known from low mass star formation. The envelope, rather than the disk, appears to be the major reservoir feeding the central engine in the most massive young stars. Therefore probing the inner few thousand AU structure of such sources are indispensable in understanding the details of massive star formation (e.g. Grave & Kumar 2007). 27 sources with IR counterparts also have some level of unresolved centimeter continuum emission which may represent the ionised emission arising close to the central engines either in the form of expanding or infalling ionised regions and/or from winds. The presence of ionised gas together with an accretion set-up involving star/disk/envelope, with high accretion rates, suggest the possibility of the ionised gas in inward motions or forming a stable zone surrounding the central engine. Therefore it appears that the theoretical scenarios involving both ionised and molecular inflows (Keto 2002, 2003) may well be the dominant mechanism producing the most massive stars.
Reflection
As evidenced by this meeting, there is an immediate need to better define the terminology such as cores, protostars and evolutionary stages in the massive star formation process. In the light of the results presented here, it appears that the envelopes around massive young stars are much larger than evidenced in the low mass star formation and plays an important role as material resorvoir to feed the central engine. The even larger flattenned structures/ toroids observed in the millimeter regime, with sizes of 0.05 to 0.1pc may represent the basic units which collapse to form the massive stars. Thus, the definition of a Core may be better suited for such flattenned structures/toroids. We propose an evolutionary sequence definition as follows: Stage I objects: millimeter bright without an IR point source (e.g: IRDC’s and mm only cores); Stage II: IR bright (mm, IR, maybe weak cm continuum as well) with dominant envelope accretion, central engine is not directly contributing to the observed SED, high accretion rates and almost absent disks (sources from this study); Stage III: IR sources with lower accretion rates, near-infrared emission lines, central engine shows up in the near-infrared (e.g: sources from the Bik et al. (2005) sample). Finally, we note that high angular observations of massive outflows needs to focus on investigating the ionised component and launching zones because the outflows from massive young stars may arise from the larger envelopes rather than disks according to the results of this study.
Acknowledgments.
We greatly appreciate the efforts of Henrik Beuther in organising an excellent conference and the SOC for providing the oppurtunity to present this work. Kumar and Grave are supported by a research grant PTDC/CTE-AST/65971/2006 approved by the FCT (The portuguese national science foundation).
References
- Beltrán et al. (2006) Beltrán M. T., Cesaroni, R., Neri, R., Codella, C., Furuya, R. S., Testi, L., Olmi, L. 2005, A&A, 435, 901
- Beltrán et al. (2006) Beltrán M. T., Brand, J., Cesaroni, R., Fontani, F., Pezzuto, S., Testi, L., Molinari, S. 2006, A&A, 447, 221
- Beuther et al. (2002) Beuther, H., Schilke, P., Menten, K. M., Motte, F., Sridharan, T. K., Wyrowski, F. 2002, ApJ, 566, 945
- Beuther et al. (2007) Beuther, H., Leurini, S., Schilke, P., Wyrowski, F., Menten, K. M., Zhang, Q. 2007, A&A, 466, 1065
- Bik et al. (2005) Bik, A., Kaper, L., Hanson, M. M., Smits, M., 2005, A&A, 440,121
- Churchwell et al. (2006) Churchwell, E., Povich, M. S., Allen, D., Taylor, M. G., Meade, M. R. et al. 2006, ApJ, 649, 759
- Faúndez et al. (2004) Faúndez, S., Bronfman, L., Garay, G., Chini, R., Nyman, L.-øA, May, J. 2004, A&A, 426, 97 (Faun04)
- Fontani et al. (2002) Fontani, F., Cesaroni, R., Caselli, P., Olmi, L., 2002, A&A, 389, 603 (Fon02)
- Grave & Kumar (2007) Grave, J. M. C., Kumar, M. S. N., 2007, A&A, 462, L37
- Grave & Kumar (2008) Grave, J. M. C., Kumar, M. S. N., 2008, To be submitted to A&A (Paper II)
- Heitsch et al. (2007) Heitsch, F., Whitney, B. A., Indebetouw, R., Meade, M. R., Babler, B. L, Churchwell, Ed. 2007, ApJ, 656, 227
- Keto (2002) Keto, E. 2002, ApJ, 580, 980
- Keto (2003) Keto, E. 2003, ApJ, 599, 1196
- Kumar et al. (2006) Kumar, M. S. N., Keto, E. R., Clerkin, E. 2006, A&A, 449, 1033
- Kumar & Grave (2007) Kumar, M. S. N., Grave, J. M. C., 2007, A&A, 472, 155 (Paper I)
- Kurtz et al. (1994) Kurtz, S. E., Churchwell, E., Wood, D. O. S., 1994, ApJS, 91, 659
- Molinari et al. (1996) Molinari, S., Brand, J., Cesaroni, R., Palla, F. 1996, A&A, 308, 573 (Mol96)
- Molinari et al. (1998) Molinari, S., Brand, J., Cesaroni, R., Palla, F., Palumbo, G. G. C. 1998, A&A, 336, 339
- Robitaille et al. (2006) Robitaille, T. P., Whitney, B. A., Indebetouw, R., Wood, K., Denzmore, P., 2006, ApJSS, 167, 256 [RWIWD06]
- Robitaille et al. (2007) Robitaille, T. P., Whitney, B. A., Indebetouw, R., & Wood, K. 2007, ApJS, 169, 328
- Sridharan et al. (2002) Sridharan, T. K., Beuther, H., Schilke, P., Menten, K. M., Wyrowski, F. 2002, ApJ, 566, 931 (Sri02)
- Whitney et al. (2004) Whitney, B. A., Indebetouw, R., Bjorkman, J. E., Wood, K., 2004, ApJ, 617, 1177
- Whitney (2005) Whitney, B. A., 2005, Nature, 437, 37
- Williams et al. (2004) Williams, S. J., Fuller, G. A., & Sridharan, T. K. 2004, A&A, 417, 115
- Zinnecker & Yorke (2007) Zinnecker, H., Yorke, H., 2007, ARA&A, 45, 481