Magnetospheric accretion on the T Tauri star BP Tauri††thanks: Based on observations obtained at the Canada-France-Hawaii Telescope (CFHT) and at the Télescope Bernard Lyot (TBL). CFHT is operated by the National Research Council of Canada, the Institut National des Sciences de l’Univers of the Centre National de la Recherche Scientifique of France (INSU/CNRS), and the University of Hawaii, while TBL is operated by CNRS/INSU.
Abstract
From observations collected with the ESPaDOnS and NARVAL spectropolarimeters, we report the detection of Zeeman signatures on the classical T Tauri star (cTTS) BP Tau. Circular polarisation signatures in photospheric lines and in narrow emission lines tracing magnetospheric accretion are monitored throughout most of the rotation cycle of BP Tau at two different epochs in 2006. We observe that rotational modulation dominates the temporal variations of both unpolarised and circularly polarised spectral proxies tracing the photosphere and the footpoints of accretion funnels.
From the complete data sets at each epoch, we reconstruct the large-scale magnetic topology and the location of accretion spots at the surface of BP Tau using tomographic imaging. We find that the field of BP Tau involves a 1.2 kG dipole and 1.6 kG octupole, both slightly tilted with respect to the rotation axis. Accretion spots coincide with the two main magnetic poles at high latitudes and overlap with dark photospheric spots; they cover about 2% of the stellar surface. The strong mainly-axisymmetric poloidal field of BP Tau is very reminiscent of magnetic topologies of fully-convective dwarfs. It suggests that magnetic fields of fully-convective cTTSs such as BP Tau are likely not fossil remants, but rather result from vigorous dynamo action operating within the bulk of their convective zones.
Preliminary modelling suggests that the magnetosphere of BP Tau extends to distances of at least 4 to ensure that accretion spots are located at high latitudes, and is not blown open close to the surface by a putative stellar wind. It apparently succeeds in coupling to the accretion disc as far out as the corotation radius, and could possibly explain the slow rotation of BP Tau.
keywords:
stars: magnetic fields – stars: accretion – stars: formation – stars: rotation – stars: individual: BP Tau – techniques: spectropolarimetry1 Introduction
T Tauri stars (TTSs) are young low-mass stars that have emerged from their natal molecular cloud core. Among them, classical TTSs (cTTSs) are those still surrounded by accretion discs. CTTSs host strong magnetic fields thought to be responsible for disrupting the central regions of their accretion discs and for channelling the disc material towards the stellar surface along discrete accretion funnels. This process is expected to play a key-role in setting the angular momentum evolution of Sun-like protostars (e.g., Königl, 1991; Shu et al., 1994; Cameron & Campbell, 1993; Romanova et al., 2004) as well as their internal structure.
One of the prototypical and most extensively studied cTTS is BP Tau in the Taurus star formation region. BP Tau hosts multi kG magnetic fields on its surface, detected both in photospheric lines (using Zeeman broadening, e.g., Johns-Krull et al., 1999a) and in emission lines forming at the base of accretion funnels (using Zeeman polarisation, e.g., Johns-Krull et al., 1999b; Valenti & Johns-Krull, 2004). However, the large-scale topology of the magnetic field is not well known, preventing detailed studies of how the star magnetically couples to its accretion disc and how efficiently angular momentum is transferred from the disc to the star (e.g., Jardine et al., 2006; Long et al., 2007).
Large-scale topologies of stellar magnetic fields can be constrained using Zeeman polarisation signatures in line profiles and the information they convey about the field orientation. By measuring the polarisation spectrum of a star and by monitoring its modulation throughout the whole rotation cycle, the large-scale topology of the parent surface magnetic field can be retreived (e.g., Donati, 2001; Donati et al., 2006b). In the particular case of cTTSs, this requires Zeeman circular polarisation signatures to be detected, not only in emission lines – tracing the tiny areas at the footpoints of accretion funnels – but also in photospheric lines – forming over most of the stellar surface.
This technique was recently applied to V2129 Oph, a bright, mildly accreting cTTS in the Ophiucus stellar formation region (Donati et al., 2007, hereafter D07). The magnetic topology of V2129 Oph is found to be significantly more complex than the conventional dipole used in most theoretical studies (Romanova et al., 2003, 2004); despite being rather weak (0.35 kG), the dipole field component is nonetheless apparently capable of coupling to the accretion disc up to distances of 7 stellar radii. In particular, this result brings further support to the original idea that magnetic coupling between the star and its accretion disc is able to control the rotation rate and the angular momentum content of the protostar. In this paper, we apply the same technique to BP Tau.
From a detailed spectroscopic study, Johns-Krull et al. (1999a) conclude that BP Tau has a photospheric temperature of K, a logarithmic gravity of and a logarithmic metallicity (with respect to the Sun) of . Assuming a logarithmic luminosity (with respect to the Sun) of (Gullbring et al., 1998), they derive that BP Tau has a radius of . The rotation period of BP Tau, as derived from photometric variability, is reported to be d (Vrba et al., 1986; Shevchenko et al., 1991); discrepant estimates, including a sudden change of the light-curve period (from 7.6 to 6.1 d, Simon et al. 1990) are also reported, suggesting that the photometric brightness of BP Tau may sporadically include a non-stellar contribution, e.g., from the inner edge of the accretion disc. Given the rotation period and the line-of-sight projected equatorial rotation velocity ( km s-1 according to Johns-Krull et al., 1999a, in good agreement with our own estimate of 9 km s-1, see below), we find that and thus that .
Fitting the evolutionary models of Siess et al. (2000) to these parameters, we infer that BP Tau is a star with an age of about 1.5 Myr. Models indicate that BP Tau is still fully convective, making it thus significantly different from V2129 Oph (which recently started to build up a radiative core, D07) and thus especially interesting for our study111To ease comparison with BP Tau, we recall that V2129 Oph is 1.35 star with a radius of 2.4 , rotating with a period of 6.53 d and accreting mass at an estimated rate of about yr-1. According to the models of Siess et al. (2000), V2129 Oph is no longer fully convective and hosts a small radiative core weighting about 0.1 . Further information on V2129 Oph can be found in D07. . Infrared excess and emission lines are conspicuous in the spectrum of BP Tau, indicating the presence of an accretion disc. Optical veiling, weakening the strength of photospheric lines by a significant fraction (typically 10% to 50% depending on epoch and wavelength) also suggests that accretion hot spots are present at the surface of the star. The mass accretion rate of BP Tau is yr-1 (e.g., Gullbring et al., 1998).
After presenting and describing our spectropolarimetric observations (Secs. 2 & 3), we apply tomographic imaging on our time-resolved data sets and derive the large-scale topology of BP Tau at 2 different epochs (Sec. 4) that we use to provide a first model of the magnetosphere and accretion funnels (Sec. 5). We finally summarise our results and discuss their implications for our understanding of stellar formation (Sec. 6).
| Date | Instrument | HJD | UT | S/N | Cycle | ||
| (2006) | (2,453,000+) | (h:m:s) | (s) | () | |||
| Feb 07 | ESPaDOnS/CFHT | 773.86074 | 08:38:59 | 125 | 5.4 | 0.508 | |
| Feb 08 | ESPaDOnS/CFHT | 774.72499 | 05:23:37 | 130 | 4.7 | 0.622 | |
| Feb 09 | ESPaDOnS/CFHT | 775.72732 | 05:27:06 | 70 | 11.0 | 0.754 | |
| Feb 10 | ESPaDOnS/CFHT | 776.72808 | 05:28:20 | 120 | 5.2 | 0.885 | |
| Feb 11 | ESPaDOnS/CFHT | 777.72195 | 05:19:38 | 120 | 5.5 | 1.016 | |
| Feb 12 | ESPaDOnS/CFHT | 778.72303 | 05:21:20 | 120 | 5.5 | 1.148 | |
| Feb 13 | ESPaDOnS/CFHT | 779.72259 | 05:20:50 | 90 | 8.5 | 1.279 | |
| Feb 14 | ESPaDOnS/CFHT | 780.72330 | 05:21:59 | 70 | 12.6 | 1.411 | |
| Feb 15 | ESPaDOnS/CFHT | 781.74836 | 05:58:13 | 130 | 5.4 | 1.546 | |
| Nov 29 | NARVAL/TBL | 1069.47610 | 23:18:19 | 85 | 7.3 | 0.405 | |
| Nov 30 | ESPaDOnS/CFHT | 1069.98455 | 11:30:31 | 140 | 3.5 | 0.472 | |
| Dec 05 | ESPaDOnS/CFHT | 1074.99539 | 11:46:20 | 170 | 2.7 | 1.131 | |
| Dec 06 | ESPaDOnS/CFHT | 1075.97733 | 11:20:23 | 170 | 2.8 | 1.260 | |
| Dec 07 | ESPaDOnS/CFHT | 1076.90044 | 09:29:42 | 170 | 2.9 | 1.382 | |
| Dec 08 | ESPaDOnS/CFHT | 1077.86802 | 08:43:04 | 170 | 2.8 | 1.509 | |
| Dec 09 | ESPaDOnS/CFHT | 1078.78979 | 06:50:29 | 120 | 4.2 | 1.630 | |
| Dec 10 | ESPaDOnS/CFHT | 1079.79637 | 07:00:00 | 80 | 6.6 | 1.763 |
2 Observations
2.1 Spectropolarimetric data
Spectropolarimetric observations of BP Tau were collected in 2006 at 2 different epochs, using mostly ESPaDOnS on the 3.6 m Canada-France-Hawaii Telescope (CFHT) in Hawaii and sporadically NARVAL on the 2 m Télescope Bernard Lyot (TBL) in southern France. ESPaDOnS and NARVAL are twin instruments able to collect stellar spectra spanning the whole spectral domain (from 370 to 1,000 nm) at a resolving power of 65,000, in either circular or linear polarisation (Donati et al., 2006c, Donati et al., in preparation). A total of 17 circular polarisation spectra were collected in 2006 February (9 ESPaDOnS spectra) and November/December (7 ESPaDOnS and 1 NARVAL spectra); both data sets are referred to as Feb06 and Dec06 in the following. Each polarisation spectrum consists of 4 individual subexposures taken in different polarimeter configurations to remove all spurious polarisation signatures at the first order.
Raw frames are processed with Libre ESpRIT, a fully automatic reduction package/pipeline developed and owned by JFD and installed both at CFHT and TBL. It automatically performs optimal extraction of ESPaDOnS and NARVAL unpolarised (Stokes ) and circularly polarised (Stokes ) spectra following the procedure described in Donati et al. (1997, Donati et al., in preparation). The velocity step corresponding to CCD pixels is about 2.6 km s-1; however, thanks to the fact that the spectrograph slit is tilted with respect to the CCD lines, spectra corresponding to different CCD columns across each order feature a different pixel sampling. Libre ESpRIT uses this opportunity to carry out optimal extraction of each spectrum on a sampling grid denser than the original CCD sampling, with a spectral velocity step set to about 0.7 CCD pixel (i.e. 1.8 km s-1). The peak signal-to-noise ratios (per 2.6 km s-1 velocity bin) achieved on the collected spectra (i.e., the sequence of 4 subexposures) range between 70 and 170 depending on the weather and the exposure time. The full journal of observations is presented in Table 1.


Least-Squares Deconvolution (LSD; Donati et al. 1997) was applied to all observations. The line list we employed for LSD is computed from an Atlas9 LTE model atmosphere (Kurucz, 1993) and corresponds to a K7IV spectral type ( K and ) appropriate for BP Tau. We selected only moderate to strong spectral lines whose synthetic profiles had line-to-continuum core depressions larger than 40% neglecting all non-thermal broadening mechanisms. We omitted the spectral regions within strong lines not formed mostly in the photosphere, such as the Balmer and He lines, and the Ca ii H, K and infrared triplet (IRT) lines. Altogether, about 9,400 spectral features are used in this process, most of them from Fe i. Expressed in units of the unpolarised continuum level , the average noise levels of the resulting LSD signatures range from 2.7 to 12.6 per 1.8 km s-1 velocity bin.
All relevant information is summarised in Table 1. Rotational cycles are computed from heliocentric Julian dates according to the ephemeris:
| (1) |
Note that the rotation cycle of BP Tau (7.6 d) was fully covered in Feb06, but only about 75% of it in Dec06. The error on the period (0.1 d) translates into a phase uncertainty of 0.5 rotation cycle between the Feb06 and Dec06 data sets (separated by 298 d or 39 rotations).
2.2 Zeeman signatures
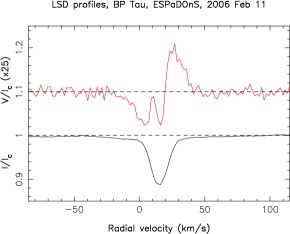
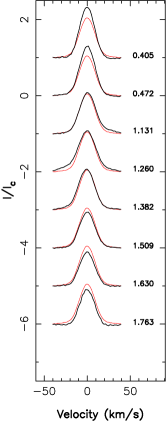
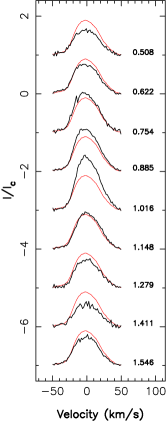
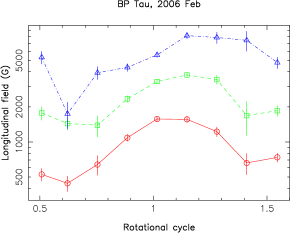
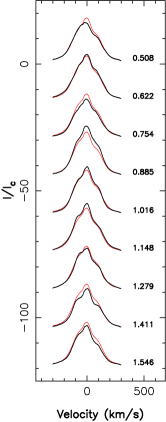
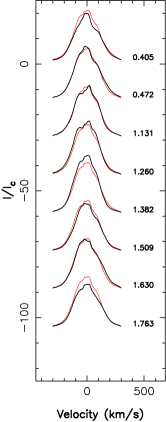
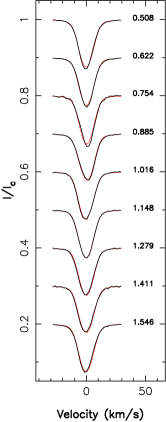
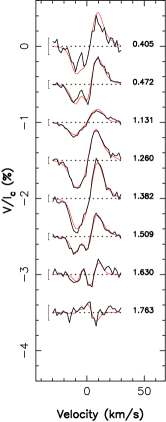
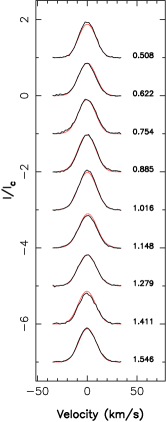
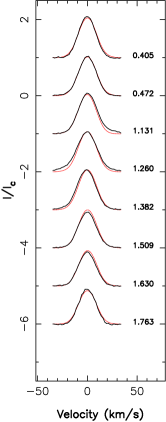
Zeeman signatures, featuring full amplitudes of about 0.5% of the unpolarised continuum level on average, are clearly detected in the LSD profiles of all spectra (e.g., see Fig. 1). The complete sets of LSD Stokes and profiles for both Feb06 and Dec06 runs are shown in Fig. 2. Note in particular that Zeeman signatures are significantly wider than unpolarised profiles, suggesting that field strengths at the surface of BP Tau are rather strong. The corresponding longitudinal fields (computed from the first order moment of the Stokes profiles, Donati et al., 1997) are typically equal to a few hundred G; while they clearly vary with time, they keep the same (negative) sign throughout both runs (see Table 2).
We divided the LSD line list into 2 subsets, a blue and a red subset including lines bluer and redder than 620 nm respectively; from those partial line lists, we derived LSD signatures (not shown) and corresponding longitudinal fields. We find that the longitudinal fields derived from the blue and red line subsets are slightly (about 15%) larger and smaller respectively than the average longitudinal fields derived from the original LSD signatures. This is similar (though much less extreme) than what was reported on the cool dwarf Boo (Petit et al., 2005); the origin of this effect is not clear.
The longitudinal fields we derive are significantly larger than the upper limits obtained by Johns-Krull et al. (1999b) and Valenti & Johns-Krull (2004). This discrepancy is due to the different methods used to estimate longitudinal fields; the method used here (equivalent to the well-known “centre of gravity” technique) is known to be very robust for all field configurations and strengths (Landi Degl’Innocenti, 2004), while cross-correlation methods (used by Johns-Krull et al. 1999b) are found to yield underestimates of both the longitudinal field and the corresponding error bar when Zeeman signatures are significantly broader than the unpolarised profile and feature a weak amplitude (as in the present case); long-term intrinsic variability of the large-scale magnetic topology may also partly explain the discrepancy.
We also estimate the amount of veiling in the spectrum of BP Tau (at an average wavelength of 620 nm) by comparing the equivalent widths of Stokes LSD photospheric profiles between BP Tau and a standard star of similar spectral type ( Eri), using the same line list for both stars; the veiling parameter we derive varies between 0 and 60% over the full span of our observations, i.e., comparable to values previously published in the literature (Gullbring et al., 1998); the relative veiling variation over one single run is about %, similar to previous reports by Valenti et al. (2003).
| Cycle | ||||||||
| (kG) | (kG) | (kG) | (kG) | (kG) | (kG) | (kG) | ||
| Feb06 run | ||||||||
| 0.508 | 0.22 | |||||||
| 0.622 | 0.29 | |||||||
| 0.754 | 0.59 | |||||||
| 0.885 | 0.35 | |||||||
| 1.016 | 0.51 | |||||||
| 1.148 | 0.42 | |||||||
| 1.279 | 0.32 | |||||||
| 1.411 | 0.48 | |||||||
| 1.546 | 0.21 | |||||||
| Dec06 run | ||||||||
| 0.405 | 0.39 | |||||||
| 0.472 | 0.31 | |||||||
| 1.131 | 0.20 | |||||||
| 1.260 | 0.39 | |||||||
| 1.382 | 0.41 | |||||||
| 1.509 | 0.20 | |||||||
| 1.630 | 0.06 | |||||||
| 1.763 | 0.00 | |||||||
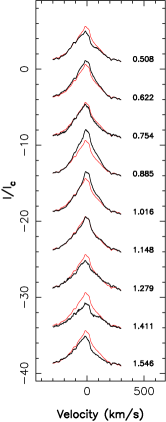
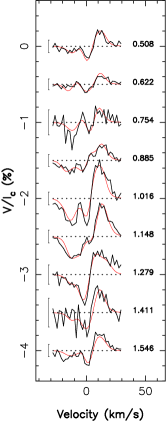
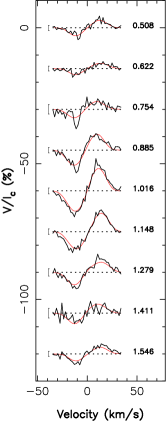
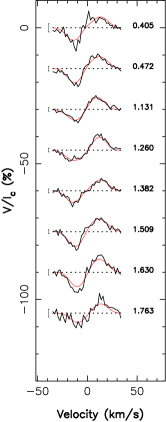
Circular polarisation is also detected in most emission lines, and in particular in the He i 587.562 nm () line and in the Ca ii IRT lines known as good tracers of magnetospheric accretion (Johns-Krull et al., 1999b; Valenti & Johns-Krull, 2004) with medium magnetic sensitivity (Landé factors of 1.0); clear signatures are also detected at all times in the He i 667.815 nm line (Landé factor of 1.0) and in the Fe ii 492.393 nm, 501.842 nm and 516.903 nm lines (multiplet 32, average Landé factor of 1.7). The complete sets of Stokes and profiles corresponding to the Ca ii IRT222Note that the 3 components of the Ca ii IRT were averaged together in a single profile to increase S/N further. and the He i emission lines are shown in Figs. 3 and 4 respectively. The longitudinal fields (see Table 2) are significantly larger, and of opposite sign, than those derived from photospheric lines. They reach up to 1.6 kG and 3.8 kG for the Ca ii IRT and the He i emission lines respectively, and up to 8.2 kG for the He i 667.815 nm line; longitudinal fields from the Fe ii lines more or less repeat (with larger error bars) those traced by the He i line. Note that the field values we derive from the He i line are similar to those measured by Johns-Krull et al. (1999a), Valenti & Johns-Krull (2004) and Symington et al. (2005).
3 Rotational modulation
We now examine the temporal variations of the Stokes and profiles of photospheric and emission lines throughout the whole rotation cycle of BP Tau and demonstrate that these variations can be assigned to rotational modulation.
3.1 Photospheric lines and accretion proxies
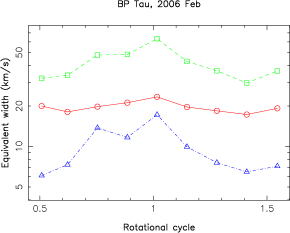
As for V2129 Oph (D07), the emission lines tracing accretion regions at the surface of the star (and in particular the Ca ii IRT and the He i 587.562 nm and 667.815 nm lines) exhibit the strongest and simplest evolution over the timescale of our observations. The level of He i emission (e.g., Figs. 4 & 5) undergoes a progressive increase followed by a regular decrease over the rotation period, i.e., very similar to what is reported by Valenti et al. (2003). Moreover, comparing, e.g., He i profiles at phases 0.508 and 1.546 on the Feb06 run demonstrates that the amount of emission more or less returns to its initial level once the star completed a complete rotation cycle (see Fig. 5); the main part of the observed variability may thus be safely attributed to rotational modulation.


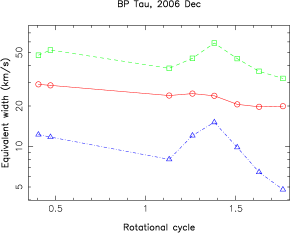
Looking at the variability of the Ca ii IRT emission profiles in Feb06 brings the same conclusion (see Fig. 3), eventhough the amount of fluctuation – % about the mean (i.e., from 18 to 22 km s-1 or 0.051 to 0.062 nm) – is smaller than that of the He i line – almost a factor of 2 peak to peak (i.e., from 30 to 60 km s-1 or 0.06 to 0.12 nm). The variation of the He i 667.815 nm line is even more extreme, reaching up to a factor of 3 peak to peak (from 6 to 18 km s-1 or 0.013 to 0.040 nm); the Fe ii emission lines vary in strength by about a factor of 2 (from 7 to 14 km s-1 or 0.012 to 0.024 nm). Note however that the Ca ii IRT emission profiles at phases 0.405 and 0.472 in the Dec06 run (both taken about 1 rotation cycle earlier than the bulk of the other Dec06 data) are significantly stronger than the average, and in particular stronger than what they should have been in case of pure rotational modulation (given the observed profiles at phases 1.382 and 1.509). We attribute this to intrinsic variability333Other emission lines are mostly unaffected by this intrinsic variability., which we corrected by scaling down both profiles by 20% (Figs. 3 and 5 show profiles/equivalent widths prior to this correction). Maximum emission is reached (in all lines simultaneously) at phases 1.02 and 1.38 in the Feb06 and Dec06 runs respectively (see Fig. 5).
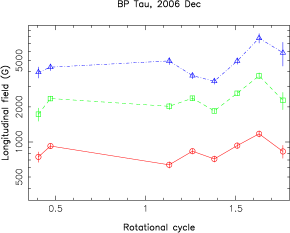
Stokes profiles from emission lines strengthen the evidence that rotational modulation dominates the observed temporal variations. The Feb06 data are particularly clear in this respect; the shape of Zeeman signatures is indeed varying very smoothly with rotation phase (reaching maximum strength around phase 1.02) and repeats well after one complete rotation cycle. The corresponding longitudinal field variations with rotational cycle, shown in Fig. 5, further confirm this impression. The Dec06 Zeeman data also show definite (though smaller) variability with rotation phase. The overall similitude between both data sets (with a smooth rise and decrease of the line emission and Zeeman signature amplitude) throughout the rotation period suggests that both line emission and Zeeman signatures were likely weak in the Dec06 phase gap during which no observation were collected; we thus conclude that all the large magnetic regions have most likely been observed in Dec06 despite the incomplete phase coverage.
The longitudinal fields we measure, although grossly similar at both observing epochs, nevertheless exhibit a different rotational modulation in Feb06 and Dec06 (see Fig. 5); for instance, the longitudinal field curve shows only one maximum in Feb06, while it shows two distinct peaks in Dec06. It suggests that intrinsic variability likely distorted the large-scale field topology between both observing epochs. Moreover, at both epochs, the longitudinal field curves are not symmetric with respect to the phase of maximum line emission, suggesting that the field within accretion spots is not purely radial but rather slightly tilted with respect to the local meridional plane. In Feb06 for instance, the phases at which maximum longitudinal fields are observed are shifted with respect to the phase of maximum line emission (1.02) and differ for each line, with He i lines (and in particular the He i 667.815 nm line) showing maximum phase shifts; it suggests that the tilt (with respect to the local meridional plane) of the magnetic field within accretion spots is larger in the formation region of He i lines.
The Stokes LSD photospheric profiles also show clear temporal variations (see Fig. 2). Zeeman signatures in Feb06, tracing negative longitudinal fields throughout the whole rotation cycle, vary smoothly from small (e.g., phase 0.622) to large (e.g., phase 1.016) amplitudes, then decrease again to their initial sizes and shapes (e.g., phase 1.546 and 0.508). Similar behaviour is observed on Dec06 with maxium and minimum Zeeman signals around phase 1.38 and 1.76 respectively. This variability strongly argues in favour of rotational modulation. Zeeman signatures are more complex than their emission line counterparts and trace a field of opposite polarity; it suggests that emission and photospheric lines do not form over the same regions of the stellar surface. A similar conclusion was reached in the case of V2129 Oph (D07).
The Stokes LSD profiles display only modest variability, apart from the changes in equivalent widths (% peak to peak within each run, up to 60% over both runs) that we attribute to veiling (see Table 2). We find that statistically, veiling tends to be larger when emission lines are stronger; this correlation is however rather loose (as already pointed at by Valenti et al. 2003), with strong veiling episodes sometimes occuring when emission lines are weak (e.g., at phase 1.411 in Feb06). Apart from veiling, variations in Stokes photospheric profiles are also visible (though modest) and are reminiscent of bump-like signatures from dark spots travelling from the blue to the red side of the line profile (e.g., from phase 0.754 to phase 1.016 in Feb06, or from phase 1.260 to 1.382 in Dec06); at this point, and given the low of BP Tau, this assumption is no more than a speculation and surface imaging tools are needed to test it in more details.
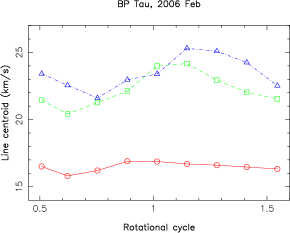
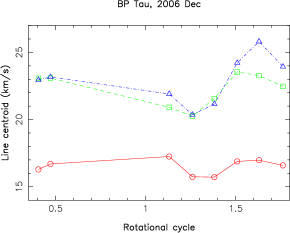
The average radial velocity of the photospheric lines is 15.7 km s-1 in Feb06 and 15.3 km s-1 in Dec06, suggesting an average radial velocity of about 15.5 km s-1; typical variations of up to km s-1 are observed throughout each run. We assume in the following that this average position represents the heliocentric radial velocity of the stellar rest frame. The average width of photospheric lines (full width at half maximum of 15 km s-1) is mostly due to rotation ( km s-1).
The Ca ii IRT emission core is centred at 16.5 km s-1 on average, i.e., redshifted by about 1 km s-1 with respect to the photospheric lines. As for photospheric lines, variations of up to km s-1 are observed throughout each run, with a smooth dependance with rotational phase (see Fig. 5). The width of the central emission core (full width at half maximum of 21 km s-1) is comparable to the rotational broadening of the star. The Fe ii emission lines are centred at 17.3 km s-1 on average and feature a full width at half maximum of about 24 km s-1. Velocity variations are stronger, reaching up to km s-1throughout both runs.
Both He i emission lines exhibit higher redshifts relative to the stellar rest frame than the Ca ii IRT emission core and lie at 23 km s-1 on average, i.e., about 7.5 km s-1 redward of the photospheric lines. Larger variations of the line centroids (of km s-1) are also observed throughout each run; the phase dependance is rather smooth and repeats well between both lines, suggesting that it is caused by rotational modulation (see Fig. 5). Since maximum He i emission occurs roughly half-way through the blue to red migration of the He i emission lines (i.e., at phase 1.00 and 1.40 for the Feb06 and Dec06 runs respectively), we speculate that this is likely where the parent accretion spots are located. While the He i 667.815 nm line is roughly as wide as the Ca ii emission cores (full width at half maximum of 22 km s-1), the He i line is twice as wide (full width at half maximum of 44 km s-1) as a result of being a composite profile of 6 different transitions.
A broad Ca ii emission component (with a full-width at half maximum of about 200 km s-1, similar to what shown by, e.g., Gullbring et al. 1996 in their Fig. 6) is also present (though not shown here) in some of our spectra, mostly those from Dec06. Its red wing more or less anticorrelates with the narrow central component, featuring an emission bump around phases of minimum core emission (phase 1.63 in Dec06) and a relative dip (with respect to the mean profile) around phases of maximum core emission (phase 1.26–1.38 in Dec06). As it correlates well with the red wing of Balmer lines, we attribute it to disc material free-falling along accretion funnels (see below). This broad component is apparently subject to a higher level of intrinsic variability than the narrow component. Stokes signatures being entirely confined to the central narrow emission component, we do not consider the broad component any further in the present study and simply removed it from all Ca ii profiles (and in particular from those shown in Fig. 3). No similar broad emission component is visible in He i and Fe ii lines.
The widths and redshifts of the Ca ii, Fe ii and He i Zeeman signatures are similar to those of the unpolarised emission profiles. However, while the Stokes signatures from the Ca ii and Fe ii emission lines are roughly antisymmetric (with respect to the line centre), those from He i lines show significant departures from antisymmetry, with the blue lobe being both narrower and deeper than the red lobe. It suggests that Zeeman signatures from He i lines form in regions featuring significant velocity gradients, whereas Zeeman signatures from Ca ii and Fe ii lines form in regions that are almost at rest. This is in good agreement with the observed line velocity redshifts, much larger for the He i lines than for the Ca ii and Fe ii lines. We also note that both He i lines trace larger toroidal fields than the Ca ii and Fe ii lines (see above).
Most observations reported here are similar to what V2129 Oph exhibits (D07), suggesting that the same modelling strategy can be employed. We thus assume, as for V2129 Oph, that emission lines comprise two physically distinct components444These two modelling components should not be confused with the narrow and broad components of the Ca ii emission lines mentionned above, and are both used to describe the narrow line emission core only.. We attribute the first of these, the accretion component, to localised accretion spots at the surface of the star whose visibility varies as the star rotates, giving rise to rotational modulation of the emission (both in intensity and radial velocity). A second, chromospheric component is more or less evenly distributed over the surface of the star, producing a time-independent emission component. We further assume that the chromospheric component is mostly unpolarised while Stokes signatures arise only in the accretion component. With the relative strengths of both components varying from line to line, we expect different lines to yield different longitudinal fields; moreover, we expect lines showing higher levels of variability to yield stronger longitudinal fields and larger velocity variations, in agreement with what we observe on BP Tau. This model is further detailed in Sec. 4.

3.2 Balmer lines
H and H lines exhibit strong emission with average equivalent widths of 4,850 and 1,210 km s-1, (i.e., 10.6 and 2.0 nm) respectively. Maximum emission is reached at phase 0.89 and 1.38 in the Feb06 and Dec06 runs respectively, i.e., at roughly the same time as all other emission lines (see above). It suggests that rotational modulation dominates the observed varibility, reaching about % for H and % for H. The variations are however not as smooth as those of the accretion proxies described above (e.g., between phase 0.62 and 0.88 in Dec06), suggesting tha Balmer lines are subject to a higher level of instrinsic variability.
Both H and H exhibit Stokes signatures (not shown here) similar in shape to those of V2129 Oph (D07), with significant departures from antisymmetry. The corresponding longitudinal fields (listed in Table 2), are peaking at about 0.23 and 1.4 kG for H and H respectively; they are smaller than, and correlate reasonably well with, those of other emission lines, suggesting that rotational modulation dominates the observed variations. The weaker longitudinal fields indicate that the circularly polarised signal from the accretion spots is more diluted (with the unpolarised light from the chromosphere and wind, and with weakly polarised contributions from the lower-field outer regions of accretion funnels) in Balmer lines than in the other accretion proxies; we speculate that most of the intrinsic variability observed in H and H is due to this unpolarised chromospheric/wind component or to that from the outer regions of accretion funnels.
We also note that the unpolarised profile of H and H are much broader (with full widths at half maximum of about 240 km s-1) than their Zeeman signatures (70 km s-1 wide). Moreover, both unpolarised lines are significantly blueshifted with respect to the stellar velocity rest frame (by as much as 15 km s-1) while their Stokes signatures are slightly redshifted (by a few km s-1, as Ca ii and Fe ii emission lines). It confirms that Balmer lines contain several emission components, with at least a slightly redshifted one forming in accretion spots and producing the observed Stokes signatures, and a second (dominant) blueshifted one due to a chromosphere and/or a wind. This is all very reminiscent of what is observed on V2129 Oph (D07).
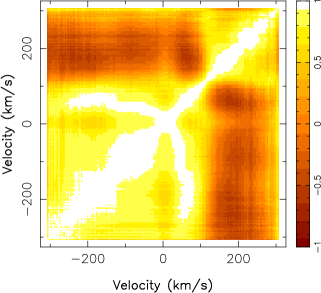
Balmer lines collected in Dec06 also include a conspicuous high-velocity component in their red wings (between and km s-1, and mostly visible in H). This component varies roughly in phase opposition with the rest of the line and shows up as a hump around phase 1.63 (i.e., when the overall line emission is small) and as a relative dip (with respect to the average profile) around phase 1.26–1.38 (i.e., when line emission is large). This is readily visible on the corresponding H autocorrelation matrix (see Fig. 7). By analogy with V2129 Oph (D07), we attribute it to disc material free falling onto the star within accretion funnels. Given the limited agreement between profiles taken almost one complete rotation cycle apart (e.g., phase 0.405 and 1.382, or phases 0.472 and 1.509), we conclude that component is apparently subject to a high level of intrinsic variability. This component is also present, though much fainter, in the Feb06 data set; it correlates well with the red wing of the broad Ca ii IRT emission component discussed above, thus suggesting a common origin.
4 The accretion spots and magnetic topology
Now that the rotational modulation of Stokes and profiles of photospheric and emission lines is firmly established, we aim at modelling the observed modulation and derive from it maps of the accretion spots and the magnetic field at the surface of BP Tau. As in D07, we only use the LSD photospheric and Ca ii line profiles in this study. Modelling He i lines (and in particular the non-antisymmetric Stokes profiles, see Fig. 4) is rather uncertain; it indeed requires additional independent information on the velocity fields and gradients within the line formation regions that we usually do not have and cannot easily access.
4.1 Model description
The model we use here is directly inspired from that of D07. It assumes that Stokes photospheric and Ca ii emission lines form in different regions of the stellar surface, reflecting the fact that accretion spots (where emission lines mostly form) coincide with dark cool spots at photospheric level (to which photospheric lines are mostly insensitive). This model was fairly successful at reproducing observations of V2129 Oph. Given the overall similarity of the present data sets with that of V2129 Oph (see above), we speculate that it should be adequate for BP Tau as well; in particular, it is compatible with reports that BP Tau looks darkest in optical photometry when accretion spots are most visible (Valenti et al., 2003).
We assume that accretion lines can be described with the two component model introduced in Sec. 3, combining a chromospheric emission component evenly distributed over the star with an additional emission component concentrated in local accretion spots. The emission-line Zeeman signatures are assumed to be associated with the accretion component only. In this model, rotational modulation of emission lines results from the accretion regions being carried in and out of the observer’s view as the star rotates, the excess emission received from these regions being proportional to their projected area (as observations suggest).
We introduce a vector magnetic field and a local accretion filling-factor , describing the local sensitivity to accretion and photospheric lines555Note that the local accretion filling-factor we define here is different from the usual accretion filling factor of the cTTS literature, i.e., the relative area of the total stellar surface covered by accretion spots.. For , the local area on the protostar’s surface contributes fully to photospheric lines and generates no Ca ii excess emission (and only unpolarised chromospheric Ca ii emission); for , the local area does not contribute at all to photospheric lines and produces the maximum amount of excess Ca ii emission and polarisation (in addition to the unpolarised chromospheric Ca ii emission). Spectral contributions for intermediate values of are derived through linear combinations between the and cases.
We introduce one difference with the model of D07. We assume that, in each local cell of the stellar surface, only a fraction of the cell area contains magnetic fields (whose local strength thus equals ). We further assume that, within each surface cell, the accretion filling factor defined above only applies to the magnetic portion of the cell, while the non-magnetic portion corresponds to . We finally assume (for simplicity) that is constant over the whole stellar surface. In this context, the model of D07 corresponds to the specific case where . Introducing brings the possibility of fitting magnetic fluxes () and magnetic strengths () independently, both having different effects in spectral lines of stars with low to moderate . While the magnetic strength is mainly derived from fitting the far wings of the Zeeman signatures, the magnetic flux is obtained essentially by adjusting the amplitude of the Stokes profiles666Magnetic distortions on Stokes profiles remain small, at least on the average photospheric line considered here, much smaller in particular than the observed rotational modulation described in Sec. 3.. We consider , called the magnetic filling factor, as a free parameter that we optimise by minimising the amount of information in the magnetic image (see below).
In this context, the local synthetic photospheric and emission Stokes and lines profiles emerging from each grid cell (noted respectively , , and ) are given by:
| (2) | |||||
| (3) | |||||
| (4) | |||||
| (5) |
where and are the local Stokes photospheric profiles corresponding to the magnetic and non-magnetic areas, the local Stokes photospheric profile corresponding to the magnetic areas, and the local Stokes profiles corresponding to the chromospheric and accretion emission components, and the local Stokes profile corresponding to the accretion emission component.
We obtain both and by fitting the corresponding synthetic Stokes and spectra to the observed Zeeman signatures and unpolarised LSD profiles of photospheric lines and Ca ii emission cores. The code we use for fitting and is adapted from the stellar surface magnetic imaging code of Donati (2001) and Donati et al. (2006b). The field is decomposed in its poloidal and toroidal components (with the poloidal field split itself between its radial and non radial contributions) and described as a spherical harmonics expansion, whose coefficients (, and for the radial, non-radial poloidal and toroidal components respectively, where and denote the modes orders and degrees, see Donati et al. 2006b for more details) are unknowns in the fitting procedure. The remaining free parameters are the values of over the surface of the star (divided into a grid of thousands of small surface pixels indexed with ).
The inversion problem being ill-posed, we use the principles of maximum entropy image reconstruction to make the solution unique (Skilling & Bryan, 1984). The entropy function, computed from , , and , allows us to select the image with minimum information (maximum entropy) given a predetermined quality of the fit to the data, usually set to a reduced chi-square of about 1. By fitting only and , we have the possibility of trying to force the solution towards a purely poloidal field; similarly, by weighting odd or even coefficients very heavily in their contribution to the entropy function, we also have the option of driving the recovered field topology towards symmetry or antisymmetry with respect to the centre of the star. Another significant advantage of this new imaging method is that it suffers much smaller crosstalk between field components than the original one (Donati & Brown, 1997; Donati, 2001).
We use Unno-Rachkovsky’s equations (e.g., Landi Degl’Innocenti, 2004) to model the LSD profiles of local photospheric lines (i.e., , and ), whose equivalent wavelength and Landé factors are set to 620 nm and 1.2 respectively. We adjust the free Milne-Eddington model parameters by fitting Unno-Rachkovsky’s equations to an unpolarised LSD profile of the slowly rotating standard star Eri whose spectral type is very similar to that of BP Tau. We then derive both the rotational broadening and the radial velocity of BP Tau by fitting our series of LSD Stokes profiles and selecting the values that minimise the image information content (for a given quality of the fit to the data). We find km s-1 and km s-1, in good agreement with previous estimates (e.g., Johns-Krull et al., 1999b).
The local Ca ii Stokes chromospheric and accretion profiles and are both described (in the absence of magnetic fields) with a simple gaussian centred at 850 nm, whose full width at half maximum (about 15 km s-1) is derived from a fit to the observed Ca ii emission profiles of BP Tau (assuming the rotational broadening obtained in the previous modelling step). The effect of magnetic fields on and the corresponding Stokes and profiles are modelled using Unno-Rachkovsky’s equations and assuming a unit Landé factor. The equivalent width ratio of the accretion emission component to that of the quiet chromospheric component is set to 4/ (the division by ensuring that the total amount of local emission, and hence the derived accretion filling factor map, does not depend on ); similar results being obtained for other values, e.g., 3/ or 5/. The equivalent width of the quiet chromospheric emission component is a free parameter that we optimise by minimising the information content of the magnetic image (see below); increasing will force the imaging code to decrease the relative fraction of accretion emission with respect to that of chromospheric emission (and vice versa), so that the resulting synthetic emission profiles match the observed ones.

4.2 First attempt
The first attempt consists in fitting, for both data sets, LSD Stokes photospheric profiles only. In addition to provide an accurate estimate of both and (see above), this step allows us to check the validity of our assumption that the shape of photospheric lines is mostly distorted by dark spots at the surface of the star and that the observed profile variability is compatible with rotational modulation. It also enables us to check a second modelling assumption, i.e., that the putative dark photospheric spots at the surface of the star are indeed more or less coincident with the accretion regions identified from the intensity and radial velocity modulation of emission lines (see Sec. 3).
We start by removing veiling from all LSD Stokes photospheric profiles, i.e., by scaling them to the same equivalent width; modelling veiling as part of the imaging process appears undesirable at this stage given that veiling only weakly correlates with the other parameters we aim at modelling (and in particular the Zeeman signatures and the shape and strength of photospheric and emission line profiles). The fit we obtain (see Fig. 8) matches the data at a S/N level of about 500 and yields a improvement of about a factor of 2 with respect to synthetic profiles corresponding to an unspotted star. Most of the main profile distortions, like for instance the profile asymmetries at phase 1.260 and 1.382 in the Dec06 data set (see Sec. 3 and Fig. 2), are reproduced by our model, leading us to conclude that our series of Stokes profiles of BP Tau are compatible with rotational modulation induced by dark surface spots. The reconstructed images (see Fig. 9) show one main spot at each epoch, covering in both cases about 2% of the total stellar surface.
These images should not be viewed as true brightness images of the photosphere of BP Tau; given the rather low (by Doppler imaging standards) and the subsequently limited spatial resolution (about 0.1 cycle at the rotation equator), only the largest non-axisymmetric spots are reconstructed here. In particular, polar spots such as that detected on V2129 Oph (producing no rotational modulation) are hardy detectable on BP Tau through Stokes profiles only. The spots we recover should thus be seen as the most reliable features without which the distortions and variability of unpolarised profiles cannot be interpreted in terms of rotational modulation.
We find that the reconstructed dark spots are reasonably close to where we expect accretion regions to concentrate, i.e., at high latitudes – given the low amplitude of velocity variations of emission lines (see Fig. 5) – and at phase 1.02 (in Feb06) and 1.38 (in Dec06) – at which emission lines show maximum emission and reach a median position in their blue to red transit (see Figs. 3, 4 and 5). They apparently lag slightly behind (by about 0.05 to 0.10 rotation cycle) the accretion spots themselves. Although the spatial resolution is likely too low to ascertain the latter point, it is nevertheless enough to confirm our basic working assumptions.
At this stage, one may argue that that the rotational broadening we derive in this process is overestimated as it neglects line broadening induced by potentially strong magnetic fields at the surface of BP Tau; moreover, some of the profile distortions we trace and attribute to dark spots could be due to magnetic fields instead. We however think that is not the case, for at least two main reasons. Firstly, the we derive is fully compatible (and even slightly lower) than that of Johns-Krull et al. (1999b), demonstrating that our estimate is obviously not an upper limit. Secondly, we would expect to see significant changes with rotational phase in the width of the LSD unpolarised profile (as we do for instance in chemically peculiar stars hosting strong magnetic fields, Landstreet 1988, e.g.,) since the magnetic topology of BP Tau is apparently not fully axisymmetric; no such effect is detected.
Yet, the magnetic fields detected on BP Tau, reaching strengths of up to 8 kG (see Table 2), are in principle strong enough to produce straightforwardly visible broadening of unpolarised lines. So why do we see no such signatures in our series of Stokes LSD profiles? This is because very intense fields actually concentrate where accretion is strongest and thus hide in very dark photospheric regions; for this reason, they mainly show up in emission lines and almost disappear from optical photospheric lines, whose widths therefore remain mostly unaffected. This interpretation (mostly speculative at this point) is confirmed below.
4.3 Complete modelling
In this second step, we carry out the complete modelling by fitting, for each observing epoch, a magnetic topology and an accretion filling-factor map to all Stokes and profiles of photospheric and emission lines simultaneously. The remaining free parameters to adjust in this process are the magnetic filling factor (arbitrarily set to 1 in the first modelling step) and the equivalent width of the quiet chromospheric emission component. We find that needs to be significantly smaller than 1 for LSD Stokes profiles of photospheric lines to be fitted down to noise level, in particular in the far line wings.
Given the available spatial resolution in the data, spherical harmonics expansions describing the magnetic field were truncated at . Moreover, the field reconstruction was oriented towards antisymmetric (rather than symmetric) magnetic topologies (about the center of star), by favouring spherical harmonics terms with odd values (see D07); dominantly antisymmetric field configurations are indeed the only ones capable of yielding (through their dipolar component in particular) the exclusive high-latitude anchoring of accretion funnels that we observe for BP Tau (e.g., Gregory et al., 2006).
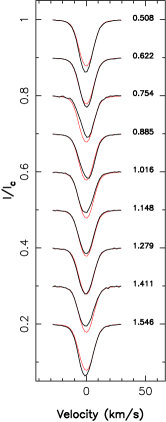
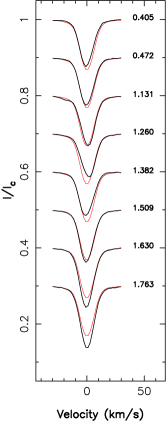
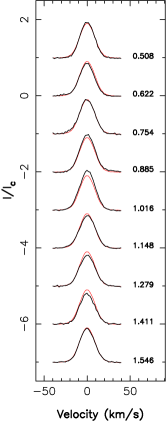
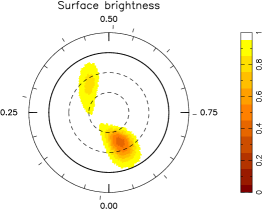
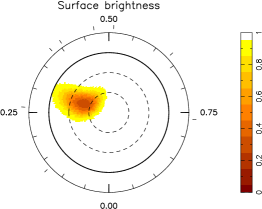
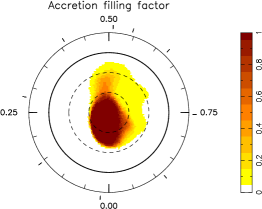
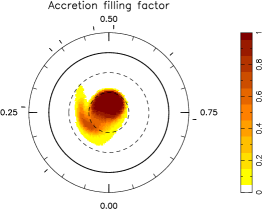
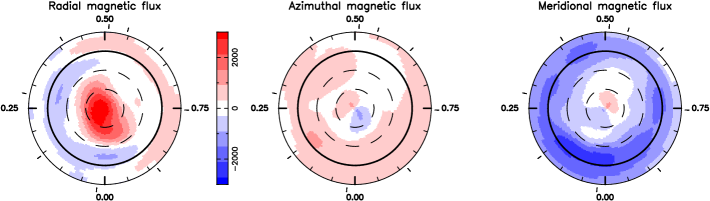
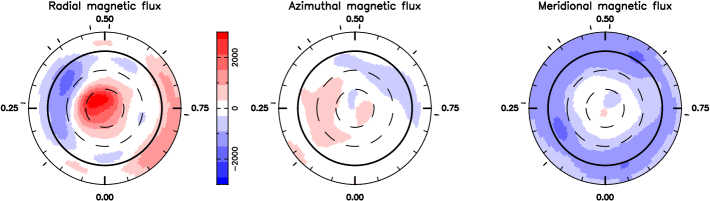
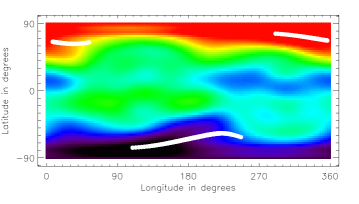
The value that minimises the amount of energy in the reconstructed field given a unit fit to the data is . We also find that should be about 60% of the average observed Ca ii line emission, the remaining 40% being produced by accretion spots and modulated by rotation. The final fits to the data, corresponding to a unit , are shown in Fig. 10 for the Stokes LSD photospheric profiles, in Fig. 11 for the Stokes Ca ii emission lines and in Fig. 12 for the Stokes Ca ii emission lines; the new fit to the Stokes LSD photospheric profiles (not shown) is only slightly worse than that of Fig. 8. The reconstructed accretion filling factor and magnetic flux maps are shown in Figs. 13 and 14 respectively. Since accretions regions are assumed to concide with dark photospheric spots in our model, Fig 13 also provides a description of the reconstructed photospheric brightness.
The updated estimate we derive (as a by-product) from this new modelling is virtually identical to that obtained in the previous modelling step (involving no magnetic fields); it confirms in particular that magnetic distortions on Stokes profiles are weak (at least on the average line that we consider here). Attempts at fitting the data (and in particular the Stokes sets) assuming different values of the rotation period confirm that optimal results are obtained for a rotation period close to the nominal value of 7.6 d (within about 0.5 d).
The reconstructed accretion regions (and dark photospheric spots) are mostly located over the polar regions of BP Tau; each spread out on about 8% of the star, actually covering only 2% of the total surface given than only one fourth of each surface pixel is subject to accretion and hosts magnetic fields (, see model description above). While not identical to the initial brightness maps of Fig. 9 (derived from fitting Stokes profiles of photospheric lines alone in our first modelling attempt), the new accretion filling factor (and photospheric brightness) maps that we now obtain from fitting the full data set are nevertheless similar; in particular both feature mid-latitude appendages located at more or less the same phase as the brightness spots of Fig. 9. We suspect that some of the discrepancy between both sets of maps is due to the fact that the assumptions underlying our model (e.g., dark spots overlapping accretion regions) are too simple; however, since they both yield acceptable fits to the Stokes LSD profiles, we conclude that their differences likely reflect the limited spatial resolution available in the spectra of BP Tau. Our result confirms that the magnetic broadening of Stokes LSD profiles is small, thereby confirming the preliminary conclusions reached above.
The magnetic topologies we recover at both epochs are similar, apart from a phase shift of about 0.25 rotation cycle. They both include one main positive radial field feature close to the magnetic pole, where the magnetic flux reaches 3 kG and the field strength up to 12 kG (since ). The average field strength over the accretion regions is about 9 kG, in agreement with the highest values of longitudinal fields traced by emission lines. In non accreting regions, the average magnetic flux is about 1.2 kG; the field is dominantly meridional and pointing away from the observer, matching the constantly negative longitudinal fields traced by photospheric lines.
We find that the magnetic topologies we recover are dominantly poloidal, with only about 10% of the magnetic energy concentrating in the toroidal component. In particular, the toroidal field of BP Tau is definitely smaller (in terms of fractional magnetic energy) than that of V2129 Oph, which gathered about 20% of the reconstructed magnetic energy (D07). This toroidal component seems nonetheless real; while fitting the Stokes data at unit with a purely poloidal field is possible, the magnetic field we recover is significantly stronger suggesting that a purely poloidal solution is far less likely (according to maximum entropy principles).
The spherical harmonics terms dominating the recovered magnetic topology corresponds to a slightly tilted dipole, with about 50% of the magnetic energy concentrating in modes; the corresponding dipole strength is about 1.2 kG. The second dominant term is a slightly tilted octupole, with about 30% of the magnetic energy gathering in modes; the corresponding octupole strength is about 1.6 kG777While the dipole and the octupole are both tilted by about 10∘ with respect to the rotation axis, they are not tilted towards the same phase so that their poles do not coincide.. This makes BP Tau fairly different from V2129 Oph, whose field comprises a dominantly octupolar large-scale magnetic field and only a small dipole component (D07). All remaining spherical harmonics terms of the large-scale (i.e., ) poloidal field of BP Tau contain altogether no more than 10% of the total magnetic energy. Note that our data does not exclude the potential presence of small-scale magnetic features (producing no detectable polarisation signatures) at the surface of BP Tau.
Although small, the intrinsic differences between the two reconstructed magnetic topologies of BP Tau are apparently real and can be traced directly to differences in the data sets themselves; Zeeman signatures in photospheric lines around phases of maximum longitudinal fields (i.e., at cycles 1.016 and 1.148 in Feb06 and 1.260 and 1.382 in Dec06) are indeed different in shape and undergo different temporal evolution. These changes are however fairly limited and do not affect the gross characteristics of the large-scale field.
5 Magnetospheric accretion and corona
As for V2129 Oph, we propose here an illustration of how accretion may proceed between the inner disc and the surface of the star. To do this, we extrapolate the reconstructed magnetic field over the whole magnetosphere, assuming the 3D field topology is mainly potential and becomes radial beyond a certain magnetospheric radius from the star (to mimic the opening of the largest magnetic loops under the coronal pressure, Jardine et al. 2002, 2006; Gregory et al. 2006). In non-accreting stars, this distance is usually assumed to be smaller than or equal to the corotation radius () at which the Keplerian orbital period equals the stellar rotation period. In cTTSs however, the magnetic field of the protostar is presumably clearing out the central part of the accretion disc and extending as far as the inner disc rim.
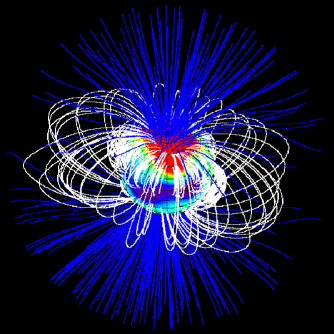
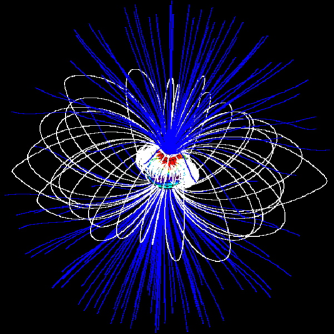
This is of course only an approximation. In particular, the strong plasma flows linking the disc to the stellar surface as a result of mass-accretion will likely prevent the field from being potential by building up a strong azimuthal component in the magnetosphere. Magnetic tracers at the base of accretion funnels (and in particular He i emission lines, see Sec. 3) suggest that this is indeed the case. We nevertheless use this approach as a first step; further detailed simulations are postponed to forthcoming papers. The magnetospheric maps we derive for BP Tau (see Fig. 15 for two possible values of at epoch Feb06) show that the field topology is complex close to the stellar surface, but dominated by more extended open and closed field lines at larger distances.
From these maps, we can estimate where the accretion funnels are located and where they are anchored at the surface of the star. We do this by identifying those magnetospheric field lines that are able to accrete material from the disc, i.e., that link the star to the disc and intersect the rotational equator with effective gravity pointing inwards in the co-rotating frame of reference (e.g. Gregory et al., 2006; Gregory et al., 2007). We find that accretion spots concentrate at high latitudes if we assume (see Fig. 16). For values of smaller than about 3.5 , equatorial accretion spots start to form; most of the accretion occurs onto the equator when .
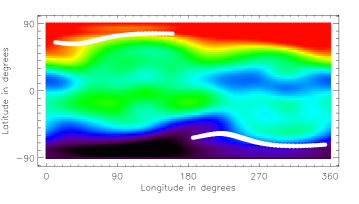
Given the results of Sec. 4, demonstrating that accretion spots are located at high latitude, we conclude that is at least equal to about 4 and may extend as far out as , equal to about 0.07 AU or 7.5 for BP Tau888Assuming that the sporadic fluctuations in the period of photometric variations (e.g., Simon et al., 1990) is due to contamination by optical light from the inner disc rim (presumably modulated on a timescale corresponding to the local Keplerian period), it would imply that the radius of the inner disc, equal to , also fluctuates with time, from about 6.5 to 8.5 typically.. Our modelling also demonstrates that accretion spots concentrate at phase of maximum line emission (0.0 in Feb06 and 0.4 in Dec06, see Fig. 13); this is further confirmed by the transient absorption appearing in the red wing of Balmer lines at these phases (see Sec. 3). When assuming that the accretion disc lies within the equatorial rotation plane, the northern accretion hot spot that our extrapolated magnetosphere model predicts (located at longitude 90∘ or phase 0.75 in Feb06, see Fig. 16 left panel) does not match the observations. Assuming that the accretion disc is magnetically warped around and locally lies within the magnetic equator of the large-scale dipole component produces a better agreement with observations (see Fig. 16 right panel).
6 Discussion
The new spectropolarimetric data we collected on BP Tau at 2 different epochs enabled us to obtain a realistic model of the large-scale magnetic field on this prototypical cTTS. Comparing our results with those recently obtained for a more massive cTTS (V2129 Oph, D07) suggests new hints on how magnetic fields are produced in young low-mass stars and how they make young stars interact with their accretion discs.
6.1 Dark spots and accretion regions
As for V2129 Oph, we observe that photospheric lines and the narrow emission lines forming at the footpoints of accretion funnels (e.g. Ca ii IRT, He i and Fe ii emission lines) are mainly modulated by rotation. Broad emission lines (e.g., Balmer lines or the broad emission component of the IRT) are also modulated by rotation but apparently include a higher level of intrinsic variability than the narrow emission lines. Spectropolarimetric observations spanning (and densely sampling) at least 2 complete rotation cycles are required to study in more details the relative strength of rotational modulation and intrinsic variability in most spectral lines of interest.
Rotational modulation of photospheric and narrow emission lines can be mostly attributed to the presence of dark spots and hot accretion regions at the surface of BP Tau. We find that both types of features grossly overlap, concentrate near the pole and cover altogether a relative area of about 2%, similar to what was observed on V2129 Oph (D07). This agrees with previous independent observational and theoretical studies estimating that the accretion spots typically cover no more than a few percent of the stellar surface (e.g., Valenti & Johns-Krull, 2004; Jardine et al., 2006). It also agrees with the findings of Valenti et al. (2003) that BP Tau (and other cTTSs) are faintest during times of maximum emission fluxes and polarisation signatures.
Veiling is also detected in the photospheric spectra, at an absolute level varying between 0 and 60%, with relative changes of up to % within a single run. We find that veiling only weakly correlates with the amount of emission and polarisation, e.g., in He i lines, and is subject to intrinsic fluctuations much larger than those seen in line emission fluxes and polarisation signatures. This is similar to what Valenti et al. (2003) report, strengthening their conclusion that veiling is rather due to stochastic variations in accretion rates rather than to the magnetic geometry and the location of accretion spots. It also suggests that veiling (as a pure continuum excess) is likely not causing the observed Stokes profile distortions in photospheric lines (as both would otherwise neatly correlate together), bringing further support to our model in which profile distortions of photospheric lines are mainly caused by dark surface spots.
If our model is confirmed, it would indicate that that the heat produced in the accretion shock is not transferred to the photosphere efficiently enough to warm it up above the temperature of the non-accreting photosphere.
6.2 Magnetic topology and origin of the field
Stokes signatures are detected on BP Tau, both from photospheric and narrow emission lines; the very different Zeeman signatures that both sets of lines exhibit (featuring in particular opposite line-of-sight polarities) suggest that they trace magnetic fields from different complementary regions of the stellar surface, with emission lines tracing the fields of accreting regions and photospheric lines tracing the fields of non-accreting regions (as in V2129 Oph, see D07). With this model, we are able to recover the large-scale magnetic topology of BP Tau from both sets of Zeeman signatures, and at both observing epochs. The reconstructed magnetic field involves mainly a dominant dipole component of 1.2 kG and a strong octupolar term of 1.6 kG, both only slightly tilted with respect to the rotation axis.
Zeeman signatures demonstrate that strong fields are present at the surface of BP Tau. We find that the average magnetic filling factor, describing the relative amount of light from magnetic regions within each local surface area at the surface of BP Tau, is about 25%; in this context, the peak magnetic fluxes of 3 kG we reconstruct on BP Tau indicate that magnetic fields likely reach maximum field strengths of up to 12 kG, mostly in accreting regions. This result is supported by the strong longitudinal fields (in excess of 8 kG) traced with the He i 667.815 nm line, presumably forming mostly in the magnetic accreting regions (with little contribution from adjacent non-magnetic areas) and thus less prone to longitudinal dilution than other narrow emission lines. This is also in qualitative agreement with the study of magnetic broadening of infrared lines of BP Tau Johns-Krull et al. (1999b), indicating that fields of up to 10 kG are likely to be present at the surface of the star. We note that the magnetic pressure within the accreting regions vastly exceeds the gas pressure of the surrounding non-magnetic photosphere, making it difficult to understand why and how accreting spots are spatially confined (even more so than in the case of sunspots); one possible (though fairly speculative) reason could be that magnetic fields are also present in the quiet photospheric regions of BP Tau, but only in the form of small-scale tangled multipolar regions producing no detectable circular polarisation.
Considering the whole surface of BP Tau, we find that the average magnetic flux over non-accreting regions is about 1.2 kG while that over the complete star is 1.4 kG; looking now at the visible hemisphere only (e.g., at phase 0.0 in the Feb06 image), we find that the average magnetic flux from non-accreting regions is again about 1.2 kG whereas that over the full visible hemisphere is 1.8 kG. The first of these 2 values is in good agreement with average magnetic fluxes derived from optical lines by Johns-Krull et al. (1999b). These authors however find that infrared lines indicate larger average magnetic fluxes (of as much as 2.8 kG, though Johns-Krull 2007 mentions 2.2 kG only), presumably because these lines also trace magnetic fields in cool highly magnetic spots whose brightness contrast with respect to the photosphere is much smaller at infrared than at optical wavelengths. Although we also find that strongest magnetic fields indeed concentrate in cool spots, the average brightness-unweighted magnetic flux we derive (1.8 kG) is smaller than that estimated by Johns-Krull et al. (1999b) and Johns-Krull (2007), suggesting that we still likely miss magnetic flux from cool spots (e.g., from dark non-accreting small-scale magnetic regions).
Comparing with V2129 Oph, we find that BP Tau hosts a 4 times stronger dipole field and a half as strong toroidal field. We speculate that this difference likely reflects the fact that BP Tau is still fully-convective, while V2129 Oph had recently started to build up a radiative core (D07). Fully convective stars are indeed much more successful at triggering strong nearly-axisymmetric low-order poloidal surface magnetic topologies (Donati et al., 2006a; Hallinan et al., 2006; Morin et al., 2007; Hallinan et al., 2007, Morin et al., 2008 in preparation) than their more massive partly-convective counterparts (e.g., Donati et al., 2003). If confirmed, this result would suggest that the strong fields of low-mass cTTS are likely dynamo-generated rather than fossil fields; the underlying processes capable of producing such fields almost without the help of differential rotation are not yet fully understood from a theoretical point of view (Chabrier & Küker, 2006; Dobler et al., 2006). In particular, it is not clear how dynamo processes are able to produce magnetic fields that vastly exceed the thermal equipartition value, such as those of BP Tau and fully convective M dwarfs.
The large-scale magnetic topology of BP Tau has apparently undergone no more than small changes between Feb06 and Dec06 – apart from a global phase shift of about 0.25 rotation cycle that could be due to a slight error on the assumed rotation period. It suggests that the lifetime of BP Tau’s magnetic topology is comparable to the timespan between our two sets of observations, i.e., much longer than those of partly-convective active stars (whose field generally changes beyond recognition in no more than a few weeks, e.g., Donati et al. 2003). This result is in agreement with recent claims that magnetic fields of fully-convective main-sequence dwarfs are stable on timescales of at least 1 yr (Morin et al., 2007, Morin et al., 2008 in preparation). If confirmed, it would imply that the nominal rotation period of BP Tau (7.6 d) is slightly underestimated; a better phase match between both images (separated by 298 d or 39 rotation cycles) is obtained when assuming that the rotation period is 7.65 d. Note that this new estimate is very close to the value of 7.64 d initially derived by Vrba et al. (1986) from multicolour photometric data.
6.3 Disc-star magnetic coupling
Several theoretical papers (e.g., Königl, 1991; Shu et al., 1994; Cameron & Campbell, 1993; Long et al., 2005) studied how the stellar magnetic field interacts with the surrounding accretion disc and disrupts its vertical structure close to the star. They showed further that the balance between accretion torques and angular momentum losses causes the rotation of the star to evolve towards an equilibrium in which the disc disruption radius lies close to and just inside the co-rotation radius . They proposed that this coupling causes cTTSs to slow down to the Keplerian orbital period at a radius about 10–50% larger than (i.e., ), explaining why cTTSs are on average rotating more slowly than their disc-less equivalents. This scenario is refered to as ‘disc-locking’ in the literature.
For BP Tau, we obtain that the 1.2 kG large-scale dipole field we observe yields an equilibrium radius ranging between 6.3 and 8.9 (depending on whether magnetic diffusivity is due to buoyancy or turbulent diffusion) according to the model of Cameron & Campbell (1993). Similar results are obtained from the model of Long et al. (2005), yielding and when applied to BP Tau. This is in agreement with both our own independent estimates of (about 7.5 ) and (larger than 4 , see Sec. 5). Using the model of Königl (1991) however, we find an equilibrium radius of 2.7 , in strong contradiction with both our estimates of and . As for V2129 Oph, we find that the disc-locking scenario is compatible with observations when the magnetic coupling between the star and its accretion disc is described by models like those of Cameron & Campbell (1993) or Long et al. (2005).
Our results suggest that winds on BP Tau are obviously not strong enough to blow open field lines larger than 3 (e.g., Safier, 1998; Matt & Pudritz, 2004) and to prevent disc magnetic disruption to take place and magnetospheric accretion to occur as far as . If it were the case, accretion spots would distribute differently over the surface of the star, with a significant fraction of mass being accreted towards the equator, in strong contradiction with our observations. Our observations also suggest that the accretion disc is magnetically warped at the vicinity of ; a similar conclusion was reached in the case of the cTTS AA Tau on completely different arguments (Bouvier et al., 2007).
7 Conclusion
In this paper, we report the detection of spectropolarimetric Zeeman signatures on the cTTS BP Tau using mostly ESPaDOnS/CFHT (with help from NARVAL/TBL). Circular polarisation signatures in photospheric lines and in narrow emission lines tracing magnetospheric accretion are monitored throughout most of the rotation cycle of BP Tau at two different epochs (Feb06 and Dec06). We find that polarised and unpolarised spectral proxies tracing the photosphere and the footpoints of accretion funnels show temporal variations that are mostly attributable to rotational modulation.
From our spectropolarimetric data sets of photospheric and narrow Ca ii emission lines simultaneously, we reconstruct, using tomographic imaging, the large-scale magnetic topology and the location of accretion spots at the surface of BP Tau at both epochs. We find that the magnetic topology of BP Tau involves a dominant (1.2 kG) dipole but also a strong (1.6 kG) octupole, both slightly (though differently) tilted with respect to the rotation axis. In particular, the strong dipole component makes BP Tau fairly different from V2129 Oph, another (more massive) cTTS on which a similar study was carried out (D07). Accretion spots coincide with the two main high-latitude octupole poles and overlap with dark photospheric spots; they each cover about 2% of the stellar surface.
Despite clear variability between both epochs, the large-scale magnetic topologies we reconstruct are nevertheless grossly similar, suggesting an overall lifetime longer than 6 months. The strong mostly-poloidal, nearly-axisymmetric field of BP Tau (and in particular its long-lived dipole component) is very reminiscent of magnetic topologies of fully-convective dwarfs (Donati et al., 2006a; Hallinan et al., 2006; Morin et al., 2007; Hallinan et al., 2007, Morin et al., 2008 in preparation). It suggests that the strong large-scale poloidal fields hosted by fully-convective cTTSs such as BP Tau (but absent in more massive non fully-convective cTTSs like V2129 Oph) are likely not fossil remants, but rather result from vigorous dynamo action operating within the bulk of their convective zones.
Preliminary modelling suggests that the magnetosphere of BP Tau must extend to distances of at least 4 to produce accretion spots at a latitude roughly matching those we observe. At the very least, it demonstrates that magnetic field lines from the protostar are not blown open close to the surface by a stellar wind, but are apparently capable of coupling to the accretion disc beyond 3 . Our estimates of the magnetospheric and corotation radii for BP Tau match the theoretical predictions of Cameron & Campbell (1993) and Long et al. (2005), thus strengthening the idea that star/disc magnetic coupling may indeed be responsible for the slow rotation of fully-convective cTTSs such as BP Tau.
Acknowledgements
We thank the CFHT and TBL staff for their help during data collection. We also thank the referee, C. Johns-Krull, for valuable comments on the manuscript.
References
- Bouvier et al. (2007) Bouvier J., Alencar S., Boutelier T., Dougados C., Balog Z., Grankin K., Hodgkin S., Ibrahimov M., Kun M., Magakian T., Pinte C., 2007, A&A, 463, 1017
- Cameron & Campbell (1993) Cameron A., Campbell C., 1993, A&A, 274, 309
- Chabrier & Küker (2006) Chabrier G., Küker M., 2006, A&A, 446, 1027
- Dobler et al. (2006) Dobler W., Stix M., Brandenburg A., 2006, ApJ, 638, 336
- Donati (2001) Donati J.-F., 2001, in Boffin H., Steeghs D., Cuypers J., eds, Astrotomography: Indirect Imaging Methods in Observational Astronomy Vol. 573 of Lecture Notes in Physics, Imaging the Magnetic Topologies of Cool Active Stars. Springer, Berlin, p. 207
- Donati & Brown (1997) Donati J.-F., Brown S., 1997, A&A, 326, 1135
- Donati et al. (2003) Donati J.-F., Cameron A., Semel M., Hussain G., Petit P., Carter B., Marsden S., Mengel M., Lopez Ariste A., Jeffers S., Rees D., 2003, MNRAS, 345, 1145
- Donati et al. (2006c) Donati J.-F., Catala C., Landstreet J., Petit P., 2006c, in Casini R., Lites B., eds, Solar Polarisation Workshop #4 Vol. 358 of Astronomical Society of the Pacific Conference Series, ESPaDOnS: The New Generation Stellar Spectro-Polarimeter. Performances and First Results. p. 362
- Donati et al. (2006a) Donati J.-F., Forveille T., Cameron A., Barnes J., Delfosse X., Jardine M., Valenti J., 2006a, Science, 311, 633
- Donati et al. (2006b) Donati J.-F., Howarth I., Jardine M., Petit P., Catala C., Landstreet J., Bouret J.-C., Alecian E., Barnes J., Forveille T., Paletou F., Manset N., 2006b, MNRAS, 370, 629
- Donati et al. (2007) Donati J.-F., Jardine M., Gregory S., Petit P., Bouvier J., Dougados C., Ménard F., Cameron A., Harries T., Jeffers S., Paletou F., 2007, MNRAS, in press
- Donati et al. (1997) Donati J.-F., Semel M., Carter B., Rees D., Collier Cameron A., 1997, MNRAS, 291, 658
- Gregory et al. (2006) Gregory S., Jardine M., Simpson I., Donati J.-F., 2006, MNRAS, 371, 999
- Gregory et al. (2007) Gregory S., Wood K., Jardine M., 2007, MNRAS, 379, L35
- Gullbring et al. (1998) Gullbring E., Hartmann L., Briceno C., Calvet N., 1998, ApJ, 492, 323
- Gullbring et al. (1996) Gullbring E., Petrov P., Ilyin I., Tuominen I., Gahm G., Loden K., 1996, A&A, 314, 835
- Hallinan et al. (2006) Hallinan G., Antonova A., Doyle J. G., Bourke S., Brisken W. F., Golden A., 2006, ApJ, 653, 690
- Hallinan et al. (2007) Hallinan G., Bourke S., Lane C., Antonova A., Zavala R. T., Brisken W. F., Boyle R. P., Vrba F. J., Doyle J. G., Golden A., 2007, ApJ, 663, L25
- Jardine et al. (2006) Jardine M., Cameron A., Donati J.-F., Gregory S., Wood K., 2006, MNRAS, 367, 917
- Jardine et al. (2002) Jardine M., Wood K., Cameron A., Donati J.-F., Mackay D., 2002, MNRAS, 336, 1364
- Johns-Krull (2007) Johns-Krull C., 2007, ApJ, 664, 975
- Johns-Krull et al. (1999b) Johns-Krull C., Valenti J., Hatzes A., Kanaan A., 1999b, ApJ, 510, L41
- Johns-Krull et al. (1999a) Johns-Krull C., Valenti J., Koresko C., 1999a, ApJ, 516, 900
- Königl (1991) Königl A., 1991, ApJ, 370, L39
- Kurucz (1993) Kurucz R., 1993, CDROM # 13 (ATLAS9 atmospheric models) and # 18 (ATLAS9 and SYNTHE routines, spectral line database). Smithsonian Astrophysical Observatory, Washington D.C.
- Landi Degl’Innocenti (2004) Landi Degl’Innocenti E., 2004, Polarisation in Spectral Lines. Vol. 307 of Astrophysics and Space Science Library, Kluwer Academic Publishers
- Landstreet (1988) Landstreet J., 1988, ApJ, 326, 967
- Long et al. (2005) Long M., Romanova M., Lovelace R., 2005, ApJ, 634, 1214
- Long et al. (2007) Long M., Romanova M., Lovelace R., 2007, MNRAS, 374, 436
- Matt & Pudritz (2004) Matt S., Pudritz R., 2004, ApJ, 607, L43
- Morin et al. (2007) Morin J., Donati J.-F., Forveille T., Delfosse X., Dobler W., Petit P., Jardine M., Cameron A., Albert L., Manset N., Dintrans B., Chabrier G., Valenti J., 2007, MNRAS, submitted
- Petit et al. (2005) Petit P., Donati J.-F., Aurière M., Landstreet J., Lignières F., Marsden S., Mouillet D., Paletou F., Toqué N., Wade G., 2005, MNRAS, 361, 837
- Romanova et al. (2004) Romanova M., Utsyugova G., Koldoba A., Lovelace R., 2004, ApJ, 610, 920
- Romanova et al. (2003) Romanova M., Utsyugova G., Koldoba A., Wick J., Lovelace R., 2003, ApJ, 595, 1009
- Safier (1998) Safier P., 1998, ApJ, 494, 336
- Shevchenko et al. (1991) Shevchenko V., Grankin K., Ibragimov M., Melnikov S., Yakubov S., Chernyshev A., 1991, Informational Bulletin on Variable Stars, 3652, 1
- Shu et al. (1994) Shu F., Najita J., Ostriker E., Wilkin F., Ruden S., Lizano S., 1994, ApJ, 429, 781
- Siess et al. (2000) Siess L., Dufour E., Forestini M., 2000, A&A, 358, 593
- Simon et al. (1990) Simon T., Vrba F., Herbst W., 1990, AJ, 100, 1957
- Skilling & Bryan (1984) Skilling J., Bryan R., 1984, MNRAS, 211, 111
- Symington et al. (2005) Symington N., Harries T., Kurosawa R., Naylor T., 2005, MNRAS, 358, 977
- Valenti & Johns-Krull (2004) Valenti J., Johns-Krull C., 2004, Ap&SS, 292, 619
- Valenti et al. (2003) Valenti J. A., Johns–Krull C. M., Hatzes A. P., 2003, in Brown A., Harper G., Ayres T., eds, 12th Cambridge Workshop on Cool Stars, Stellar Systems, and the Sun, University of Colorado Vol. 12, Time Series Spectropolarimetry of T Tauri Stars. p. 729
- Vrba et al. (1986) Vrba F., Rydgren A., Chugainov P., Shakovskaia N., Zak D., 1986, ApJ, 306, 199