Submillimeter Line Emission from LMC N159W: a Dense, Clumpy PDR in a Low Metallicity Environment
Abstract
Context. Star formation at earlier cosmological times takes place in an interstellar medium with low metallicity. The Large Magellanic Cloud (LMC) is ideally suited to study star formation in such an environment.
Aims. The physical and chemical state of the ISM in a star forming environment can be constrained by observations of submm and FIR spectral lines of the main carbon carrying species, CO, C i and C ii, which originate in the surface layers of molecular clouds illuminated by the UV radiation of the newly formed, young stars.
Methods. We present high-angular resolution sub-millimeter observations in the N159W region in the LMC obtained with the NANTEN2 telescope of the 12CO , , and 13CO rotational and [C i] 3PP0 and 3PP1 fine-structure transitions. The 13CO and [C i] 3PP1 transitions are detected for the first time in the LMC. We derive the physical and chemical properties of the low-metallicity molecular gas using an escape probability code and a self-consistent solution of the chemistry and thermal balance of the gas in the framework of a clumpy cloud PDR model.
Results. The separate excitation analysis of the submm CO lines and the carbon fine structure lines shows that the emitting gas in the N159W region has temperatures of about 80 K and densities of about 104cm-3. The estimated C to CO abundance ratio close to unity is substantially higher than in dense massive star-forming regions in the Milky Way. The analysis of all observed lines together, including the [C ii] line intensity reported in the literature, in the context of a clumpy cloud PDR model constrains the UV intensity to about and an average density of the clump ensemble of about 105 cm-3, thus confirming the presence of high density material in the LMC N159W region.
Key Words.:
astrochemistry – ISM: globules – ISM: molecules – ISM: individual (N159W)1 Introduction
Since the formation of the first generation of stars in our Universe, the cyclic process of formation and destruction of stars has progressively enriched the interstellar medium (ISM) with heavy elements and dust. This implies that, at earlier cosmological times, stars formed in lower metallicity, lower dust-to-gas ratio molecular gas. Newly formed massive stars illuminate their progenitor molecular clouds with far-ultraviolet photons (FUV; 6 eV h eV) producing photon-dominated regions (PDRs; Hollenbach & Tielens 1999, and references therein). The lower dust-to-gas ratio reduces the ability of the low-metallicity molecular cloud to attenuate FUV photons, making low-metallicity PDRs more extended than their Solar metallicity counterparts. This has an impact on the C+/C/CO transition layer in PDRs, as CO is more efficiently photo-dissociated (van Dishoeck & Black 1988), enhancing the C+ and C abundance relative to CO. Therefore, star formation in low metallicity gas differs from that in solar metallicity gas, as the structure and thermal balance of the progenitor molecular gas is different. The extent to which the properties of the molecular gas are modified have been theoretically studied (e.g. Maloney & Black 1988; Lequeux et al. 1994; Bolatto et al. 1999; Kaufman et al. 1999; Röllig et al. 2006) and to some extent observationally constrained (e.g. Israel 1997; Madden et al. 2006). The study of the properties of the low metallicity molecular gas is of great importance in order to understand the evolution of youngest galaxies in our Universe.
Nearby dwarf and irregular galaxies are examples where we can observe massive star formation taking place in low-metallicity molecular gas. One of the best studied examples is the Large Magellanic Cloud (LMC). Due to its proximity (50 kpc; Feast 1999) and nearly face-on orientation (; van der Marel & Cioni 2001), the LMC is ideal to study the impact of massive star formation in its low-metallicity (Z 0.30.5 Z⊙; Westerlund 1997) molecular gas. The LMC has been entirely mapped in [C ii] 158 m by Mochizuki et al. (1994) and in 12CO by Cohen et al. (1988) at low resolution of 8.8 arcmin. Fukui et al. (1999) revealed the first spatially resolved image of the giant molecular clouds over the LMC in the 12CO emission at 2.6 arcmin resolution ( 40 pc) by using the NANTEN 4m telescope. The subsequent CO studies with NANTEN offer the details of the molecular and star-formation properties of these GMCs in the LMC (Mizuno et al. 2001; Yamaguchi et al. 2001; Blitz et al. 2007; Fukui 2002, 2007). The CO observations of the LMC show that the molecular gas towards the molecular cloud complex associated with the N159 H ii region (Henize 1956) is an outstanding star forming region which is part of the most significant molecular concentration in the galaxy. An extensive study of the CO emission with improved angular resolution has been carried out within the ESO-SEST Key Programme on CO in the Magellanic Clouds (Israel et al. 1993 and subsequent publications).
Observations of low 12CO and 13CO transitions with improved angular resolution (10 pc) have unveiled three giant molecular clouds (GMCs); N159E, N159S, and N159W (Johansson et al. 1998; Bolatto et al. 2000). At similar scales, the [C ii] distribution in the N159 complex has been mapped by Boreiko & Betz (1991) and Israel et al. (1996). At lower angular resolution of 110″, and hence averaging over larger spatial scales of about 50 pc, the [C i] 3PP0 and 12CO transitions have been detected in this region with the AST/RO telescope (Stark et al. 1997; Bolatto et al. 2000).
The brightest CO peak in the entire LMC is N159W. In this region, an excitation analysis made by Johansson et al. (1998), based in low 12CO and 13CO transitions, suggested gas densities of cm-3 and K. A similar analysis by Minamidani et al. (2007), including the 12CO transition, resulted in similar gas densities but somewhat higher temperatures ( K). Including 12CO observations, Bolatto et al. (2005) argue that the CO intensities are best explained by a warm ( K) and low-density (102 cm-3) and a cold ( K) and dense (105 cm-3) components. Note that the work of Johansson et al. (1998) and Bolatto et al. (2005) apply to different spatial scales (10 pc and 26 pc, respectively).
The PDRs in N159W have been studied by Israel et al. (1996), Bolatto et al. (2000), and Pak et al. (1998). Based on different tracers of the strength of the incident FUV radiation field, Israel et al. (1996) derived a value between 111Israel et al. (1996) originally derived this value in units of the Habing (1968) field. The Draine (1978) field is related to the Habing (1968) field by a factor of 1.71 when averaged over the full FUV range. (in units of the intensity of the mean interstellar radiation field derived by Draine 1978). Bolatto et al. (2000) found that the ratio is enhanced compared to that in similar Galactic star-forming regions while the remains similar. This is in agreement with a simple analytical model by Bolatto et al. (1999) that predicts growth of the [C ii] and [C i] emitting layers with decreasing metallicity, resulting from a shrinking of the CO molecular core. The N159W region was included in PDR model calculations by Pak et al. (1998), which constrained the physical conditions of the line-emitting gas to 103.7 cm cm-3 and 60 600.
In this paper, we present high-resolution (10 pc) observations of the N159W region obtained with the new NANTEN2 telescope. We present detections of the 12CO , , and 13CO rotational and [C i] 3PP0 and 3PP1 fine-structure transitions. The 13CO and [C i] 3PP1 transitions are detected for the first time in the LMC. The 12CO line has been detected at the low angular resolution of the AST/RO telescope towards the 30 Dor region (Kim 2006). The NANTEN2 observations are described in Section 2. We derive physical properties of the low-metallicity molecular gas using an escape probability radiative transfer code independently for the CO and [C i] lines (Section 3), and a self-consistent solution of the chemistry and thermal balance of the gas is given using a photon-dominated region (PDR) model for a clumpy interstellar medium (Section 4), explaining the observed emission of all observed lines, including low CO lines and [C ii] 158 m from the literature. We discuss our results in Section 5, and summarize in Section 6.
2 Observations
We use the new NANTEN2 4m telescope situated at 4865 m altitude at Pampa la Bola in northern Chile to observe the 12CO (461.0408 GHz) , (806.6517 GHz), and 13CO (440.7654 GHz) rotational and [C i] 3PP0 (492.1607 GHz) and 3PP1 (809.3446 GHz) fine-structure transitions toward N159W. The line parameters derived from the NANTEN2 observations of LMC N159W are listed in Table 1.
The observations were made toward the peak 12CO intensity position in N159W, located at = 539368 and = 69°45′319 (J2000), using the total-power observing mode. We use a reference position at = 538532 and = 69°46′288 (J2000), which is free of 12CO emission (3 upper limit of 6.2 K km s-1). The duration of each beam switch cycle was varied between 20 and 30 seconds, depending on the atmospheric stability during the observations. The final spectra result from total integration times of 20 mins to about 1 hour. The pointing was checked regularly on Jupiter, IRC+10216, and IRc2 in OrionA. The applied corrections were always smaller than 20″, and usually less than 10″.
The observations were conducted with a dual-channel 460/810 GHz receiver installed for verifying the submillimiter performance of the telescope. Double-sideband (DSB) receiver temperatures were 250 K in the lower channel and 750 K in the upper one. The intermediate frequencies (IF) are 4 GHz and 1.5 GHz, respectively. The latter IF allows simultaneous observations of the 12CO line in the lower and of the [C i] 3PP1 line in the upper sideband. These two lines are observed simultaneously with one of the lines in the 460 GHz channel. As backends we used two acousto-optical spectrometers (AOS) with a bandwidth of 1 GHz and a channel resolution of 0.37 km s-1 at 460 GHz and 0.21 km s-1 at 806 GHz.
The LMC observations with NANTEN2 were performed in several sessions during the September to November 2006 period. In all sessions both channels of the dual frequency test-receiver were active, so that the determination of the atmospheric transmission for both channels can be done in a single step with a common atmospheric model. This new atmospheric calibration scheme, implemented as part of the standard observing software kosma_control developed at Universität zu Köln and installed at NANTEN2, uses a parametrization of the Pardo et al. (2004) atmospheric model ATM. The single, free parameter, fitted to the observed atmospheric emission spectrum derived from hot/cold/sky-measurements in the standard calibration cycle, is the precipitable water vapor . The parameterized model provides frequency lookup tables of the dry () and wet () contribution to the opacity of the atmosphere above the observing site, . The and -coefficients are derived from the ATM model atmosphere calculated for the 4865 m altitude of the NANTEN2 observatory. The cold-load is a liquid nitrogen load, the hot-load is at the cabin temperature, which is monitored electronically. The sky temperature is taken as the ambient outside temperature monitored by the weather station of the observatory. This assumption is occasionally verified through sky-dip measurements, which are also used to determine the forward/spillover efficiency. Using this calibration, the relative intensities of lines observed in different receiver bands simultaneously is, beyond the signal/noise of the data, limited only by the precision and validity of the atmospheric model. The main advantage of this new scheme is that it gives a much higher precision for the determination of the atmospheric line-of-sight transmission in receiver bands with low transmission and poorer sensitivity, because it includes the stronger (hot-sky) difference signal of the higher transmission bands and the higher signal-to-noise data from the more sensitive bands in determining the transmission at each frequency point. It also fully takes into account frequency dependent variations of the atmospheric opacity across the receiver bands, such as resulting from narrow atmospheric lines and tails of wide ones. Comparison with the traditional calibration approach which determines the atmospheric transmission as an average over a representative section of each receiver band individually from hot/cold/sky-measurements, shows a much higher robustness against errors in the values for the ambient and effective atmospheric temperatures used in the calibration.
The other factors that enter in the relative calibration of the intensity of lines from different receiver bands are the ratio of their main beam efficiency and the pickup from the error beam pattern outside the main beam. Main beam efficiencies were determined from Jupiter radio continuum scans (Simon et al. 2007), assuming a brightness temperature of Jupiter of 154 K and 126 K respectively at 460-490 and 810 GHz (Griffin et al. 1986). Comparison of the fitted angular width of the Jupiter scan with the disk diameter of Jupiter allows to derive the FWHM of the main beam, and from its brightness, the main beam efficiency. The thus derived observational parameters are listed in Table 2. A full description of this new calibration scheme for ground based submm observations is in preparation for a separate, technical paper.
A coarse estimate of the error beam of the NANTEN2 telescope was obtained by analyzing scans across the edge of the Moon and the Sun (Simon et al. 2007). These show a signal consistent with an error beam size of some 400″ at 460 GHz and 240″ at 810 GHz, consistent with the diffraction pattern of individual panels, which have a size of 50 by 70 cm, and hence due to panel mis-alignment. We estimate the integrated power (relative to the main beam) of these error beams to be 10% and 15% at 460-490 GHz, respectively 810 GHz. The error beam intensities are consistent with a surface rms due to panel misalignment of about 25 m, as independently confirmed by photogrammetric measurements. From the analysis of these data, we estimate the ratio of main beam efficiencies to be determined to a precision of about 10%, resulting in a similar systematic error in the observed intensity ratios of lines in the 460 and 810 GHz band.
The simultaneous coverage of both the 12CO and [C i] 3PP1 transitions in the upper and lower sideband implies that their relative calibration, including the atmospheric imbalance between the two sidebands, is very precise, limited only by the radiometric S/N in this receiver channel. The lower frequency channel of the dual channel receiver was alternatingly tuned to the 12CO , the [C i] 3PP0 transition, and the 13CO line. The atmospheric transmission was particularly good for an initial set of observations covering the 12CO line in the lower channel. At this time the zenith opacity was about 0.40 at the 12CO line frequency and about 0.92 for the 12CO line, resulting in very high S/N spectra in particular for the 12CO line. Using the and coefficients from the Pardo et al. (2004) model these zenith optical depths correspond to a precipitable water vapor (pwv) of about 0.51 mm. A subsequent observing session covering the [C i] 3PP0 transition had again a very good zenith opacity of about 0.5 to 0.6 at 492 GHz, and about 0.7 to 0.8 in the upper frequency channel for the CO line (pwv 0.38 to 0.44 mm). During the 13CO line observations the weather was very good for a short session, with an opacity of about 0.5 to 0.6 at the line frequency of 440 GHz, at the edge of the 600 m atmospheric window, and correspondingly low zenith opacity of about 0.6 at the 12CO frequency (pwv 0.31 mm). Most of the 13CO data were taken in a long integration at substantially higher zenith opacity, varying around 1.2-1.5 (corresponding to about 1.4 to 1.5, pwv 0.70 to 0.89 mm, at 806 GHz). While this implies that the absolute calibration at these high opacities may easily be influenced by systematic errors (such as non-perfect temperature estimates for the effective radiative temperature of the atmosphere), the relative calibration between the low- and high-frequency line is largely unaffected and thus rather accurate.
In the following, we thus used estimates of the systematic errors for the line intensity ratios introduced through the calibration uncertainty (as explained, these are mainly due to the precision with which the beam efficiency ratio is determined), as quoted in Table 3 and add these quadratically with the radiometric noise, assumed to be given by the formal errors of the Gaussian fits.
3 Observational Results
3.1 NANTEN2 data
| Line | amplitude(a) | center(b) | FWHM(b) | integral |
|---|---|---|---|---|
| [K] | [km s-1] | [km s-1] | [K km s-1] | |
| NANTEN2 data | ||||
| 12CO | 9.31 (0.05) | 238.3 (0.016) | 7.32 (0.04) | 72.6 (0.3) |
| 12CO | 3.33 (0.09) | |||
| 13CO | 0.95 (0.10) | |||
| [C i] 3PP0 | 1.51 (0.05) | |||
| [C i] 3PP1 | 1.87 (0.08) | |||
| literature data(c) | ||||
| 12CO | 6.79 (0.15) | 238.0 (0.073) | 6.95 (0.17) | 50.0 (1.6) |
| 13CO | 0.78 (0.08) | 238.0 (0.35) | 6.81 (0.83) | 5.6 (0.9) |
| [C ii] | 7.7 (0.9) | 232.8 (0.8) | 9.8 (0.9) | 75.5 (7.0) |
| (a) amplitude derived from fitted Gaussian width and integral | ||||
| (b) center and width fixed to 12CO best fit values | ||||
| (c) references for literature data see Section 3.2 | ||||
| receiver channel | 460-490 GHz | 810 GHz |
|---|---|---|
| 0.5 | 0.4 | |
| beam FWHM [″] | 38 | 26 |
| [K] | 250 | 750 |
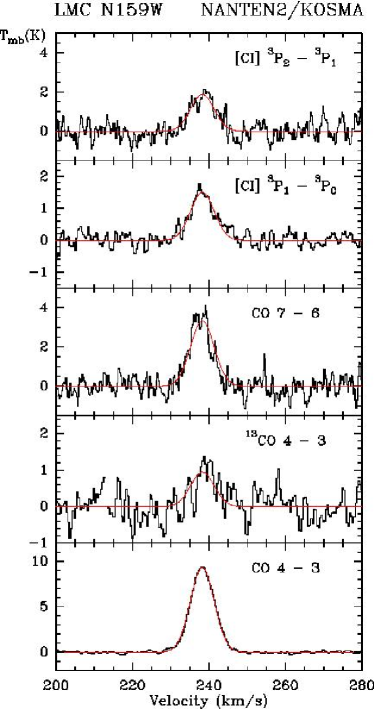
The spectra observed towards LMC N159W are shown in Fig. 1, together with Gaussian fits of the center, width and integrated line intensity, resp. amplitude. The results of the Gaussian fits are listed in Table 1. The line center and width determined from the high signal-to-noise 12CO spectrum were taken and held fixed for the Gaussian fit of the line amplitude of the other lines. This is adequate as their profiles are, within their limited signal-to-noise, consistent with that of the 12CO line.
As explained above, due to the simultaneous observations and the joined atmospheric transmission calibration for the lines in the upper and lower frequency channel, the intensity ratio of the lines observed is rather precisely determined and is mainly limited by the estimated systematic errors due to the determination of the beam efficiencies as discussed above. The only further correction concerns the different beam size of the low and high frequency channel of 38″, resp. 26″. Unfortunately, we did not have enough nights with superb weather to make small maps around the peak positions at (0,0) in order to spatially smooth the high frequency observations to the angular resolution of the low frequency beam. For correcting the beam size effects for the high frequency observations we thus have to rely on an independent determination of the source extent. AST/RO has repeatedly observed the 12CO line, once with a relatively large beam FWHM of 204″ (Bolatto et al. 2000), resulting from improper alignment of the AST/RO optical components, giving an integrated intensity of 8.4 K km s-1, and with the diffraction beam size of the AST/RO telescope at 460 GHz of 109″(Bolatto et al. 2005), giving an integrated line intensity of 20.8 K km s-1. Assuming a Gaussian source distribution with FWHM and a source peak brightness temperature of , the beam filling correction gives a main beam brightness temperature in a beam of FWHM of . The ratio of the main beam brightness temperature in two different beams 1 and 2 is given by . With this, we can derive the source size from the observed brightness ratio in two beam sizes:
giving from comparing the NANTEN2 12CO data with the early, and for comparison with the later AST/RO data.
We thus adopt a source size of 60″ and correct the observed intensity ratios for the beam coupling of the different beam sizes at two observing bands and to the source intrinsic intensity ratio via
This correction assumes that the source structure is the same at the spatial scales observed with the 460 and 810 GHz channels. The validity of this assumption likely dominates the uncertainties in the line ratios. However, as we will see in Section 4 and 5, the good fit obtained for the physical parameters supports this assumption. Table 3 shows the line ratios thus corrected and used for the excitation analysis discussed below.
3.2 Additional Lines from the Literature
Beyond the lines newly observed with NANTEN2 we have included in the analysis described in the following also the 12CO and 13CO lines (the 12CO data are presented in Pineda et al. (2008) and the 13CO data were kindly provided by Jürgen Ott), as well as the [C ii] 158 m line observed spectrally resolved by Boreiko & Betz (1991) to better constrain the physical parameters of the emitting gas. The 12CO and 13CO lines have been observed with the ATNF Mopra 22 m telescope fully-sampled with its 33″ beam at 115 GHz and later convolved to 45″ resolution, and the intensities are converted to the main beam brightness temperature scale using . The [C ii] 158 m line has been observed with the Kuiper Airborne Observatory with its 43″ beam (Boreiko & Betz 1991) at 158 m and its intensity is quoted on a main beam brightness temperature equivalent intensity scale. The pointing of the KAO observations is about ″ further south than the NANTEN2 position. We take their values without further corrections. In fact, the integrated intensity of the [C ii] line from the KAO observations of erg cm-2 s-1 sr-1 is consistent within 20% with the integrated intensity read off the [C ii] map published by Israel et al. (1996), observed velocity unresolved with the FIFI spectral imaging instruments on the KAO.
To estimate adequate errors for the line intensity ratios, we assume that the absolute calibration of all the independently observed lines is about 20%. Table 3 quotes the thus derived total errors, obtained by quadratically summing up the formal fit error and the calibration uncertainty.
| Species | Ratio(a) | fit error | calibration error | total error |
|---|---|---|---|---|
| 12CO / CO | 0.30 | 0.008 | 10% | 0.031 |
| [C i] 3PP1 / [C i] 3PP0 | 1.05 | 0.06 | 10% | 0.12 |
| 13CO / 12CO | 0.10 | 0.011 | 10% | 0.015 |
| [C i] 3PP1 / CO | 0.56 | 0.052 | 0.052 | |
| 12CO / 12CO | 0.69 | 0.10 | 20% | 0.17 |
| 13CO / 12CO | 0.12 | 0.02 | 20% | 0.03 |
| [C ii] / 12CO | 1.1 | 0.1 | 20% | 0.24 |
4 Escape probability radiative transfer: excitation analysis
We now use the observed line intensity ratios and absolute intensities to constrain the physical properties of the emitting gas. We start by using only the intensity ratios, which are independent of the beam filling of the source. We analyze separately the CO emission and the atomic carbon emission, but assume that both originate from the same material in the beam with identical beam filling factors. This is motivated by the fact that the beam sizes at 460-490 and 810 GHz at the distance of the LMC corresponds to linear scales of 10 and 7 pc, respectively. Moreover, both CO and [C i] emission arise from dense molecular material, more specifically from the UV illuminated surface of cloud structures unresolved at this linear scale.
We use the escape probability radiative transfer model by Stutzki & Winnewisser (1985) to calculate the line intensities as a function of kinetic temperature , cloud density and column density per velocity interval v of the species of interest (note that the column density parameter in the radiative transfer model is the radial column density of the spherical clump; the beam averaged column density in a beam larger than the clump thus is a factor of higher). The collision rate coefficients used are from Flower & Launay (1985) for CO-H2 and from Schröder et al. (1991) for C0-H2. The escape probability model produces peak brightness temperatures of an individual spherical model clump, averaged over the projected area of the clump on the sky. To compare with the observable brightness of the model clump, this has to be scaled down by the beam filling factor of the individual clump. Within the standard model of a molecular cloud consistent of many fragments which move around with a virialized velocity dispersion, the ratio of the observed to the model line intensity, once corrected by the beam filling factor, is thus given by the ratio between the clump internal linewidth and virial velocity dispersion. For optically thin emission of the individual clumps, and also for moderately optically thick clumps, the observed/model intensity ratio gives the ratio of beam averaged column density to clump intrinsic column density, as long as the total integrated line intensity still increases linearly with the number of clumps (no velocity crowding). We will use this below, when we compare the absolute line intensities of 12CO, 13CO and [C i] with the model predicted intensities.
4.1 [C i]-emission
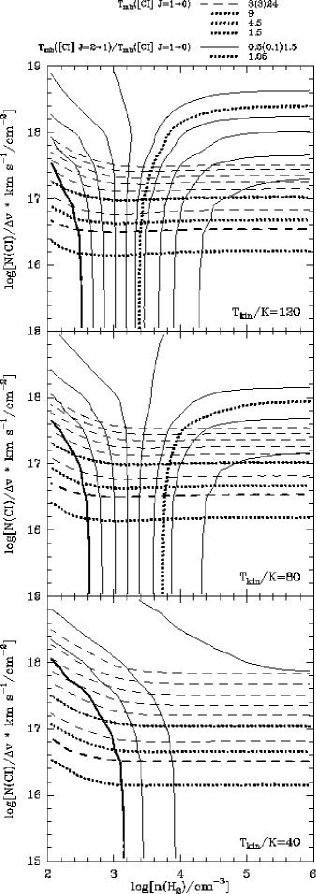
The observed line intensity ratio of the two [C i] lines of about 1.05 (Table 3) is compared with the escape probability radiative transfer prediction in Fig. 2. We present model line ratios, in a stack of 3 plots corresponding to kinetic temperatures of 40, 80, and 120 K, as a function of density and radial column density per velocity interval, covering the range from 102 to 106 cm-3 in density, and 1015 to 1019 cm-2 / (km s-1) in column density per velocity interval222Note that the beam average column density per velocity interval of an unresolved clump, as explained above, is a factor of 4/3 larger.. The line ratios and absolute intensities discussed further down are presented in the same way and cover the same parameter range. Clearly, the observed value can only be reproduced by the model at moderately high temperatures of above about 60 K, and at densities of the [C i]-emitting material of at least cm-3 at high temperatures, and slightly higher, around cm-3 at the lower limit of the temperature range. At these densities, slightly higher than the critical densities of the atomic carbon fine structure lines, the carbon lines should be close to thermalized. Fig. 2 also shows the model predicted absolute intensity of the [C i] 3PP0 line. The analysis of the different CO-lines presented below argues for a beam filling factor of about 1/6, so that the observed peak brightness of about 1.5 K should be scaled up to an intrinsic brightness of about 9 K corresponding to a C i column density model parameter of cm-2/(km s-1). In comparison to the kinetic temperature range derived above and together with the densities inferred, we conclude that the low observed and beam filling corrected brightness implies that the [C i] lines are well in the optically thin regime. Thus, multiplication by the inferred beam filling factor is appropriate. The intersection of the line ratio and absolute line intensity curves, lying on the vertical branch of the [C i] line ratio curves in the density/column density plane, independent of the value of the beam filling factor, implies that the density of the emitting material is in fact close to the lower limit values quoted above.
4.2 CO-emission
¿From the NANTEN2 data we obtain two CO line intensity ratios, namely and the isotopomeric ratio . The predicted line intensity ratios are plotted in Fig. 3. This plot (and the following ones) assume a fractional abundance of 13CO/12CO of 40 by shifting the contours for the CO lines accordingly along the column density axis. A value for the 13CO/12CO abundance ratio in the N159W region of 40 is cited by Johansson et al. (1994) and Israel et al. (2003) quote a value of 50, whereas Heikkilä et al. (1999) derive a substantially lower value of only 21. Their abundance ratios for other 12C and 13C carriers, namely H13CO+ and 13CS, are higher. This may indicate, that the isotopomeric CO ratio is indeed affected by fractionation, whereas the elemental 12C/13C ratio is around 40. Fractionation may occur due to the exchange reaction 13C+ 12CO 12C+ 13CO 35 K being exothermal and thus preferentially incorporating 13C into the molecular form. Selective photodissociation of 13CO due to the lower self-shielding would cause the opposite. PDR model calculations show that the proportion of these effects strongly depend on the temperature derived for the C+/C i/CO transition zone and the comparison between different models gives non-conclusive answers. If we constrain the density to values compatible with those derived from the [C i]-analysis above, the two observed CO line ratios can only be reproduced by the model at a temperature of about 80 K. The assumption of equal densities is fully justified, because their is no physically plausible scenario that has CO at low densities of about 100 cm-3, while the C i is located at higher densities of close to 104 cm-3, as long as we assume that the lines originate in a PDR-like structure. Note that the reverse, i.e. [C i] originating from much lower density material than CO, namely from a more diffuse halo of dense molecular clouds, would be also reasonable.
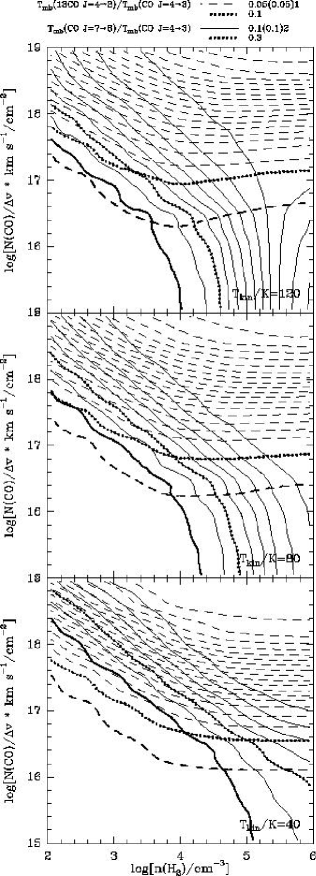
The intersection of the two observed CO-line ratios constrains the CO-column density model parameter to a value of about 1017cm-2/km s-1 at 80 K. Recall that we show the plots for an abundance of 13CO/12CO of 40. The column density thus derived changes roughly in proportion to the assumed isotopomeric abundance ratio, as is confirmed by running the model for different values; we do not show the corresponding figures here, in order to save space.
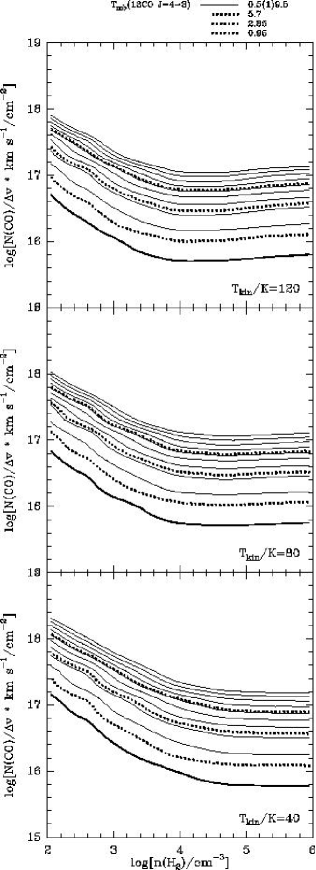
Fig. 4 shows that the model predicted clump averaged absolute line intensity of the 13CO line at the column densities and in the density regime constrained by the observed line ratios as discussed above, is about 6 times higher than the observed one at a temperatures of about 80 K. This implies a beam filling factor of the CO material of about 1/6.
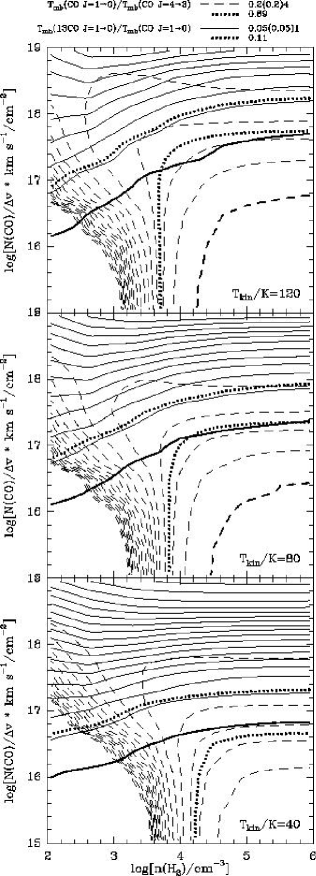
We now consider in addition the line intensity ratios involving the 12CO and 13CO transition. The line intensity ratio between 12CO and of 0.69 traverses the density/column density regime of cm-3 and about cm-2/ (km s-1) derived from the other CO line ratios only at temperatures of above around 80 K and higher (see Fig. 5). The isotopic line ratio does not traverse this regime at all. It always requires substantially higher column densities than allowed by the line ratios of the higher lines. This implies that reducing the 12CO/13CO abundance ratio from the value of 40 assumed here to lower values, will bring the ratio into better agreement, although Fig. 5 shows that lowering it by just a factor of 2 down to about 20 would not be sufficient. We report (without showing a figure), that the agreement becomes reasonably good at lower temperatures of 20 to 40 K, indicating that a temperature gradient with the lower CO emission originating in lower temperature gas and showing stronger isotopic fractionation can give a consistent picture, thus confirming the low 12CO/13CO ratio of about 20 reported by Heikkilä et al. (1999).
To summarize, the escape probability radiative transfer analysis implies that the CO and CO emission observed in N159W, if it originates in gas with densities close to 104 cm-3 as constrained by the [C i] emission, comes from gas with kinetic temperatures of about 80 K and with a source intrinsic total column density of cm-2/(km s-1) and a filling factor of about 1/6. The 12CO , , and the 13CO and line ratios taken together are not consistent with a single temperature component, but require a range of temperatures and possibly isotopic fractionation.
4.3 CO and [C i] column densities
The escape probability radiative transfer analysis gives column densities for both CO and C i of 1017 cm-2/km s-1. But the 12CO and 13CO lines indicate an additional, cooler component. The derived column density ratio [C i] / CO of 1.0 thus is an upper limit due to the unknown contribution of the lower temperature CO-material.
As discussed above, the beam average column density is a factor of 4/3 higher than the column density model parameter. Together with the observed line width of 7.3 km s-1 and the beam filling factor of 1/6, both CO and C i thus have a beam average column density of cm-2. Assuming the canonical abundance CO/H2 of and the same for C i, both tracers correspond to a mass in the beam of 3000 M⊙ each, and 6000 M⊙ in total. Considering that our beamsize of 38″ FWHM corresponds to 9.5 pc at the distance of the LMC and hence covers only part of the N159W cloud’s extent of about 15 pc, this is in good agreement with the CO-luminosity mass of M⊙ derived by Johansson et al. (1998).
5 PDR-model analysis
In the previous section we have analyzed the excitation conditions of both [C i] and CO/13CO separately. These conditions correspond to typical values of the line-emitting material. In the following, we investigate whether the observations can be explained in terms of PDRs distributed in a clumpy interstellar medium. The modest temperatures, with a tendency towards lower temperatures for the CO lines than for the [C i] lines, are roughly consistent with those expected for the mid CO and [C i]-emitting layers in a PDR illuminated by the modest UV-field of about 175, independently derived for the LMC N159W region from the FIR continuum luminosity (Israel et al. 1996). Compared to typical star forming regions in the Milky Way, the estimated column density ratio of C i relative to CO of up to unity is rather high and this is expected to be the case in a lower metallicity environment such as the LMC with z=0.4. Similarly, the [C ii] emission is expected to be stronger due to a larger extent of the C-ionized PDR surface layer resulting from the weaker UV attenuation by dust and weaker self shielding of CO at low metallicities.
Bolatto et al. (1999), in a simple semi-analytical model (their model A) predict this behavior for the carbon species with the assumption of finite size clumps making up the emitting gas; the PDR depth scale is determined by the UV absorption per nucleon, which is due to heavy elements (in the form of dust, carbon etc.) and thus, referred to the hydrogen column density, scales up inversely with the metallicity. The [C ii] and [C i] emitting layers thus grow in size inversely with metallicity and the molecular core of the clump, where the CO emission originates, shrinks.
The KOSMA- PDR model (Störzer et al. 1996) allows to self-consistently calculate both the chemical and temperature structure of spherical clumps and confirms these basic trends with metallicity (Röllig et al. 2006), but takes into account all details such as the variation of the temperature in the emitting region of each species with varying metallicity. In order to model the emission from a cloud complex such as the N159W region, one additionally has to take into account the fact, that the emission is unlikely to arise in a single clump, but that the emitting complex shows structure on all scales. Quantitative studies of the structural properties in many star forming regions in the Milky Way (e.g. Williams et al. 1994; Elmegreen & Falgarone 1996; Stutzki et al. 1988; Kramer et al. 1998; Heithausen et al. 1998; Heyer & Terebey 1998), but also on larger scales in the Milky Way and external galaxies (Stanimirović et al. 2000; Stanimirović & Lazarian 2001; Fukui et al. 2001; Kim et al. 2007), show that the observed velocity channel maps can be decomposed into clumps with a power law mass spectrum with a clump mass spectral index of 1.8 to 1.9; without the velocity dispersion due to turbulence, this would not be possible, as in many cases the clumps overlap along the line-of-sight and can only be separated by the additional velocity information. An independent approach is to study the power spectra of the observed maps, either directly (e.g. Elmegreen & Falgarone 1996) or via the -variance analysis (Stutzki et al. 1998), which shows that these often follow a power law. Stutzki et al. (1998) showed, that both approaches are consistent with the additional assumption of a power-law mass-size relation for the individual clumps, , with an index of about 2.3. Note that values of imply increasing density with decreasing clump size, i.e. denser small scale structures, as expected for a turbulent medium, where the small scale structures are created by local compression due to transient waves; would imply constant column density of the structures, independent of size. Although the demonstration of a clear mass-size power law and the derivation of the exact power exponent is rather difficult and uncertain, in the few cases where it has been possible it confirms values around the one quoted above; an example is the analysis of the Polaris flare region (Heithausen et al. 1998).
Based on this scenario, an obvious approach is to model the observed emission of a cloud complex by combining the emission of many clumps, individually modeled with a clump PDR-model such as KOSMA-, which follow a power law mass spectrum and mass-size relation. This approach has been successfully applied to several individual regions (Kramer et al. 2008; Mookerjea et al. 2006; Kramer et al. 2004, 2005) , but also to the global emission of the Milky Way in the submm/FIR cooling lines, as observed by COBE (Cubick et al. 2007). We will use it here to analyze the combined set of observed lines in LMC N159W. The details of the model are explained in Cubick et al. (2007).
Fixing the clump mass spectral index and the mass-size power-law index to and respectively, the clumpy cloud complex is characterized by the mean density of the total clump volume (each clump being modeled as a Bonnor-Ebert sphere with density law, so that the clump average density is twice the surface density), the total mass of the clump ensemble, and the upper and lower mass cut-off of the mass spectrum. As long as the individual clumps are not too densely packed spatially and in velocity, so that their emission does not overlap along the line-of-sight and in frequency, changing the total clump mass simply changes the absolute brightness of the clump ensemble by adding or removing material with identical mass distribution; equivalently, it changes the area and volume filling factor of the clump ensemble. In the model fit, it is thus used as the parameter that adjusts to the absolute intensity observed and it can be ignored, as long as one considers only relative intensities.
Keeping the other parameters fixed, but changing the upper mass cut-off shifts the distribution of the material to larger or smaller clumps and thus will affect the relative intensities of the various lines according to their preferential origin from the clump cores or surfaces. Lowering the lower mass cut-off simply adds more and more smaller clumps, which, as long as the lower mass cut-off is sufficiently low, are small enough to correspond basically to PDR-surface layers; given the above value of the mass-spectrum index, the small clumps do not contribute to the total mass, i.e. amount of material, and thus this change does not significantly affect the observed emission. A somewhat open issue, discussed in more detail in Cubick et al. (2007) concerns the fact, that one can argue about the stability and life-time of such small clumps and to what extent the mid CO emission from these small and dense structures affects the overall emission of the ensemble in these lines. We do not discuss this issue further here. For the models discussed below, the low mass cut-off was fixed to .
The free model parameters are thus, as long as we consider only relative intensities, the UV-field, parametrized by in units of the Draine field, the clump-volume mean density , the metallicity and the upper mass cut-off . For the following analysis, we first fix the metallicity to the canonical value for the LMC of ; later on we discuss, how the results vary with metallicity. We then do a least-square fit in the , -parameter plane for different values of . The least-square fit analysis includes all line ratios listed in Table 3, i.e. the relative intensities of the full suite of low and mid CO and 13CO lines, both [C i] lines, and the [C ii] line. Unfortunately, the PDR model grid is presently only available for a 12C/13C elemental abundance of 60, slightly higher than the experimentally determined value for the LMC N159W cloud.
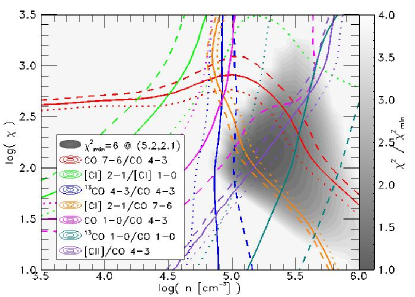
We get the best fit, with a normalized for a UV-field of around 220 and a density of a few times cm-3. This is obtained at a rather low upper-mass cut-off of 0.1 . Fig.6 shows the -distribution in the parameter plane and the contours of the observed line ratios overlayed. Considering that we fit seven line ratios with 2 parameters, this is an excellent fit.
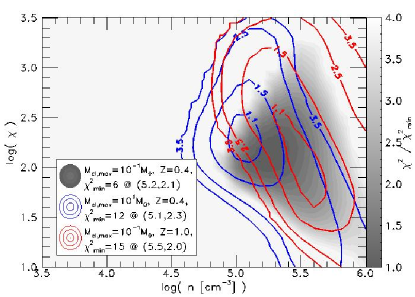
We next discuss the dependency of the best fit parameters on varying the upper mass cutoff and the metallicity. Representative -contour plots are shown in Fig.7. Increasing the upper-mass cut-off to 1 M⊙ and 10 M⊙ increases the to a value of 7.5 and 12.8. This shallow rise of less than a factor of 2 in per decade in , shows that the upper mass-cutoff is not very stringently constrained, but indicates that the clumpy cloud PDR scenario requests the emitting gas to show lots of surface and to be broken up into small scale structures. Varying the metallicity to the solar value of 1, the is 15 and 22 respectively for a of 0.1 and 10 M⊙, so that the PDR model clearly favors the canonical metallicity of the LMC in order to reproduce the observed intensity ratios. Fig.7 shows that the discussed variations do not much alter the best fit value for the UV-intensity and the density.
Considering the uncertainties about the carbon isotope elemental abundances to use for the LMC and the open issue of isotope selective fractionation in PDRs, it is worthwhile to consider a PDR-model fit excluding the 13C-carrying species. Without showing the corresponding plot, we report that the best-fit density and UV-intensity are unaffected; this is due to the fact, that the line ratios involving the 13C-carrying species vary rather shallow across the parameter region of interest. A close inspection of Fig.6 in fact shows, that neglecting the observed [C ii]/CO ratio in determining the -minimum would allow a solution at slightly lower densities of about cm-3 and higher UV-intensities of slightly above =1000, where all other lines intersect.
Whereas the value for the UV-intensity is consistent with that independently derived from the FIR luminosity, as discussed in the introduction, and thus only confirms this result independently, the density regime favored by the clumpy-cloud PDR-model, cm-3 or slightly above, is clearly much higher than other estimates of the density in the LMC N159W region. Together with the small value for the upper-mass cut-off this argues for a very clumpy structure with high density clumps to explain the observed line ratios.
In the last step of the analysis, we can now adjust the predicted absolute line intensities to the observed value, by changing the total mass of the ensemble to fit the absolute intensity of e.g. the 12CO line. This gives a mass included in the beam of M⊙, in good agreement with the CO-luminosity mass quoted by Johansson et al. (1998) and the mass derived above from the escape probability analysis. Note that the clumpy-PDR model fits all lines simultaneously, where as the low CO line analysis is biased towards the lower excitation material and the escape probability radiative transfer analysis above emphasized the warm and dense gas traced by the mid CO transitions and the [C i] fine structure lines.
We conclude that the emission of all observed CO lines, from to for 12CO, and for 13CO and both [C i] and [C ii] fine structure lines, is consistently modeled as originating from a dense, highly clumped medium illuminated by an FUV-field of in the LMC N159W complex. The model fit constrains the densities to values of about cm-3 and preferences the canonical metallicity of the LMC of about .
6 Discussion
Previous CO excitation analyses suggest a low-temperature ( K) molecular gas in N159W (Johansson et al. 1998; Bolatto et al. 2005). However, these studies are only based on CO observations which trace more shielded material in the PDR. The excitation analysis using the [C i] fine structure line intensity ratio allow us to better explore the conditions at the cloud surfaces, as this ratio is a very good tracer of the surface temperature (e.g. Stutzki et al. 1997). Bolatto et al. (2005) and Minamidani et al. (2007) derived larger temperatures for this region ( K and K, respectively). Our work confirms a high density of the bulk of the CO-traced molecular material in the N159W region. Wide ranges of possible gas densities have been suggested by Johansson et al. (1998) and Minamidani et al. (2007) (10 cm-3). Although poorly constrained, Bolatto et al. (2005) also proposed a two-component solution of low density ( cm-3), high temperature ( K) and high density ( cm-3), low temperature ( K). High densities of the more shielded material are also suggested by observations of molecular species like CS, SO, and H2CO ( cm-3; Heikkilä et al. 1999).
We derive a [C i]/CO column density ratio toward N159W close to 1.0, possibly slightly lower, depending on the contribution from a cooler CO component. This value is large compared with what is typically found in Galactic dense massive star formation regions (0.04-0.2; for a compilation, see Mookerjea et al. 2006), and therefore argues for a larger C abundance relative to CO as a result of the enhanced CO photodissociation in low-metallicity PDRs. Note that the [C i]/CO column density ratio is not constant in the Galaxy (Mookerjea et al. 2006). High values are also found in the less dense outskirts of massive star-forming regions (Mookerjea et al. 2006) and in high-latitude clouds (Ingalls et al. 1997). Recent observations have also shown high [C i]/CO column density ratios in extragalactic nuclei (Hitschfeld et al. 2007). In order to determine the relative importance of the main carbon species, we derive the C+ column density, assuming cm-2 (erg s-1 cm-2 sr-1)-1 (Crawford et al. 1985)333This is an approximation for an excitation temperature of K and a density larger than , cm-3, and using the erg s-1 cm-2 sr-1 observed by Boreiko & Betz (1991). With this method, we obtain cm-2. Using this value and the CO and CI column densities of cm-2 as derived above, we obtain a relative abundance of the main carbon species in N159W of =46%:27%:27%. In Galactic star-forming regions CO is the most abundant carbon species. For example, in the DR21(OH) star-forming region, the relative abundance of the main carbon species is :=3%:10%:87% (Jakob et al. 2007). As we can see, the abundance of C+ and C relative to CO are indeed enhanced in the low-metallicity gas in N159W. The different distribution of carbon is reflected in the enhanced and / line ratios observed in LMC N159W, relative to Solar metallicity PDRs. ¿From the data used in this paper, we obtain 1.13 and / 0.22. These values can be compared with the ratios determined from COBE all-sky measurements (Wright et al. 1991) of 0.97 and 0.13, respectively.
Polycyclic aromatic hydrocarbons (PAHs) are known to have an important influence in the carbon chemistry, increasing the C and decreasing the CO abundances in cloud surfaces (Lepp & Dalgarno 1988; Bakes & Tielens 1998). In order to assess any effect of PAHs in the PDR modeling, we also compare the observations with a single-clump version of the KOSMA model that includes PAH in the chemical network (see Pineda & Bensch (2007) for details on the inclusion of PAHs in the KOSMA model). PAHs were also considered in the PDR model calculations by Kaufman et al. (1999). We find that the line ratios typically increase by up to a factor of 10 when PAHs are considered. As a result, in order to match the observations, even larger densities than derived above would be required ( cm-3). The effects of PAHs in the chemical network of the clumpy-PDR model will be explored in a future work. The PAH abundance might be reduced in low-metallicity molecular gas, as observations revealed that PAH emission is weak or absent in low metallicity galaxies (e.g. Madden 2000; Houck et al. 2004; Engelbracht et al. 2005; Madden et al. 2006). However, the observed PAH emission spectra in the N159-5 H ii region resembles the spectra of Galactic H ii regions (Vermeij et al. 2002).
The strength of the FUV radiation field required by the PDR model to explain the observations () is consistent with the independent determination made by Israel et al. (1996), using UV, radio continuum, and IRAS 60 m emission (). Using the same assumptions made by Israel et al. (1996) to determine from the IRAS 60 m data, but using the high-angular resolution Spitzer 70 m map (Meixner et al. 2006), we obtain a consistent value of . This strength of the FUV radiation field might be considered low for a massive star formation region such as N159W (for example, in the Orion Bar, Walmsley et al. (2000) and Young Owl et al. (2000) find that ). However, Israel et al. (1996) argue that the low metallicity and low dust-to-gas ratio of this region increases the FUV photon free path lengths, resulting in a greater geometric dilution of the FUV radiation field.
7 Summary and conclusions
In this paper, we derived the physical conditions of the line-emitting gas in the N159W region in the LMC. We compared an escape-probability code and a PDR model with NANTEN2 observations of the 12CO , , and 13CO rotational and [C i] 3PP0 and 3PP1 fine-structure transitions. Our results can be summarized as follows:
-
•
The analysis of the excitation conditions for both the CO submm-lines and the [C i] fine structure lines shows temperatures of about K and densities of about cm-3 for the emitting gas.
-
•
The estimation of the C and CO column densities suggest a high C/CO abundance ratio of close to unity compared to that found in Galactic dense massive star-forming regions. This is an indication that CO is more readily destroyed in the low-metallicity environment of N159W. Comparing with an estimation of the C+ column density, we confirm that the distribution of the main carbon species in PDRs is altered in the low-metallicity molecular gas, with larger C+ and C abundances relative to CO. This result is in agreement with observations of an enhanced and / ratios in N159W, compared with values observed in solar metallicity PDRs.
-
•
The PDR modeling, calculating the emission as resulting from an ensemble of spherical clumps with a power law mass spectrum and a power law mass-size relation, providing a simple representation of the fractal structure of the ISM, gives a consistent fit to all observed line ratios for a moderate strength of the FUV radiation field of 220 . This value is consistent with a previous independent estimation made by Israel et al. (1996). It constrains the average density of the clump ensemble to about 105 cm-3, confirming previous indications of high-density CO-traced molecular material in the LMC N159W region. The clumpy cloud PDR model also gives a relatively small upper clump mass cutoff for the clump ensemble, indicating a very much broken up structure of the ISM in N159W.
Similar studies in other regions in the LMC with NANTEN2 combined with observations from upcoming observatories such as Herschel and SOFIA, will improve our knowledge about the impact of star formation in the low-metallicity molecular gas. This will help us to improve our current understanding of the processes of star formation in the young Universe.
Acknowledgements.
The NANTEN2 project (southern submillimeter observatory consisting of a 4-meter telescope) is based on a mutual agreement between Nagoya University and The University of Chile and includes member universities from six countries, Australia, Republic of Chile, Federal Republic of Germany, Japan, Republic of Korea, and Swiss Confederation. We acknowledge that this project could be realized by contributions of many Japanese donors and companies. This work is financially supported in part by a Grant-in-Aid for Scientific Research from the Ministry of Education, Culture, Sports, Science and Technology of Japan (No.¥ 15071203) and from JSPS (No.¥ 14102003 and No.¥ 18684003), and by the JSPS core-to-core program (No.¥ 17004). This work is also financially supported in part by the grant SFB 494 of the Deutsche Forschungsgemeinschaft, the Ministerium für Innovation, Wissenschaft, Forschung und Technologie des Landes Nordrhein-Westfalen and through special grants of the Universität zu Köln and Universität Bonn. LB and MR acknowledges support from FONDAP Center of Excellence 15010003. We thank F. Israel for providing some older SEST 12CO and 13CO data for cross checking the calibration of the MOPRA data. We also thank Jürgen Ott for providing the Mopra 13CO data. Data reduction of the spectral line data was done with the gildas software package supported at IRAM (see http://www.iram.fr/IRAMFR/GILDAS). This research has made use of NASA’s Astrophysics Data System Abstract Service.References
- Bakes & Tielens (1998) Bakes, E. L. O. & Tielens, A. G. G. M. 1998, ApJ, 499, 258
- Blitz et al. (2007) Blitz, L., Fukui, Y., Kawamura, A., et al. 2007, in Protostars and Planets V, ed. B. Reipurth, D. Jewitt, & K. Keil, 81–96
- Bolatto et al. (2005) Bolatto, A. D., Israel, F. P., & Martin, C. L. 2005, ApJ, 633, 210
- Bolatto et al. (1999) Bolatto, A. D., Jackson, J. M., & Ingalls, J. G. 1999, ApJ, 513, 275
- Bolatto et al. (2000) Bolatto, A. D., Jackson, J. M., Israel, F. P., Zhang, X., & Kim, S. 2000, ApJ, 545, 234
- Boreiko & Betz (1991) Boreiko, R. T. & Betz, A. L. 1991, ApJ, 380, L27
- Cohen et al. (1988) Cohen, R. S., Dame, T. M., Garay, G., et al. 1988, ApJ, 331, L95
- Crawford et al. (1985) Crawford, M. K., Genzel, R., Townes, C. H., & Watson, D. M. 1985, ApJ, 291, 755
- Cubick et al. (2007) Cubick, M., Röllig, M., Ossenkopf, V., Kramer, C., & Stutzki, J. 2007, A&A in prep.
- Draine (1978) Draine, B. T. 1978, ApJS, 36, 595
- Elmegreen & Falgarone (1996) Elmegreen, B. G. & Falgarone, E. 1996, ApJ, 471, 816
- Engelbracht et al. (2005) Engelbracht, C. W., Gordon, K. D., Rieke, G. H., et al. 2005, ApJ, 628, L29
- Feast (1999) Feast, M. 1999, PASP, 111, 775
- Flower & Launay (1985) Flower, D. R. & Launay, J. M. 1985, MNRAS, 214, 271
- Fukui (2002) Fukui, Y. 2002, in IAU Symposium, Vol. 207, Extragalactic Star Clusters, ed. D. Geisler, E. K. Grebel, & D. Minniti, 505–+
- Fukui (2007) Fukui, Y. 2007, in IAU Symposium, Vol. 237, IAU Symposium, ed. B. G. Elmegreen & J. Palous, 31–39
- Fukui et al. (2001) Fukui, Y., Mizuno, N., Yamaguchi, R., Mizuno, A., & Onishi, T. 2001, PASJ, 53, L41
- Fukui et al. (1999) Fukui, Y., Mizuno, N., Yamaguchi, R., et al. 1999, PASJ, 51, 745
- Griffin et al. (1986) Griffin, M. J., Ade, P. A. R., Orton, G. S., et al. 1986, Icarus, 65, 244
- Habing (1968) Habing, H. J. 1968, Bull. Astron. Inst. Netherlands, 19, 421
- Heikkilä et al. (1999) Heikkilä, A., Johansson, L. E. B., & Olofsson, H. 1999, A&A, 344, 817
- Heithausen et al. (1998) Heithausen, A., Bensch, F., Stutzki, J., Falgarone, E., & Panis, J. F. 1998, A&A, 331, L65
- Henize (1956) Henize, K. G. 1956, ApJS, 2, 315
- Heyer & Terebey (1998) Heyer, M. H. & Terebey, S. 1998, ApJ, 502, 265
- Hitschfeld et al. (2007) Hitschfeld, M., Aravena, M., Kramer, C., et al. 2007, A&A Submitted.
- Hollenbach & Tielens (1999) Hollenbach, D. J. & Tielens, A. G. G. M. 1999, Reviews of Modern Physics, 71, 173
- Houck et al. (2004) Houck, J. R., Charmandaris, V., Brandl, B. R., et al. 2004, ApJS, 154, 211
- Ingalls et al. (1997) Ingalls, J. G., Chamberlin, R. A., Bania, T. M., et al. 1997, ApJ, 479, 296
- Israel (1997) Israel, F. P. 1997, A&A, 328, 471
- Israel et al. (2003) Israel, F. P., de Graauw, T., Johansson, L. E. B., et al. 2003, A&A, 401, 99
- Israel et al. (1993) Israel, F. P., Johansson, L. E. B., Lequeux, J., et al. 1993, A&A, 276, 25
- Israel et al. (1996) Israel, F. P., Maloney, P. R., Geis, N., et al. 1996, ApJ, 465, 738
- Jakob et al. (2007) Jakob, H., Kramer, C., Simon, R., et al. 2007, A&A, 461, 999
- Johansson et al. (1998) Johansson, L. E. B., Greve, A., Booth, R. S., et al. 1998, A&A, 331, 857
- Johansson et al. (1994) Johansson, L. E. B., Olofsson, H., Hjalmarson, A., Gredel, R., & Black, J. H. 1994, A&A, 291, 89
- Kaufman et al. (1999) Kaufman, M. J., Wolfire, M. G., Hollenbach, D. J., & Luhman, M. L. 1999, ApJ, 527, 795
- Kim (2006) Kim, S. 2006, PASP, 118, 94
- Kim et al. (2007) Kim, S., Rosolowsky, E., Lee, Y., et al. 2007, ApJS, 171, 419
- Kramer et al. (2008) Kramer, C., Cubick, M., Röllig, M., et al. 2008, A&A, 477, 547
- Kramer et al. (2004) Kramer, C., Jakob, H., Mookerjea, B., et al. 2004, A&A, 424, 887
- Kramer et al. (2005) Kramer, C., Mookerjea, B., Bayet, E., et al. 2005, A&A, 441, 961
- Kramer et al. (1998) Kramer, C., Stutzki, J., Rohrig, R., & Corneliussen, U. 1998, A&A, 329, 249
- Lepp & Dalgarno (1988) Lepp, S. & Dalgarno, A. 1988, ApJ, 324, 553
- Lequeux et al. (1994) Lequeux, J., Le Bourlot, J., Des Forets, G. P., et al. 1994, A&A, 292, 371
- Madden (2000) Madden, S. C. 2000, New Astronomy Review, 44, 249
- Madden et al. (2006) Madden, S. C., Galliano, F., Jones, A. P., & Sauvage, M. 2006, A&A, 446, 877
- Maloney & Black (1988) Maloney, P. & Black, J. H. 1988, ApJ, 325, 389
- Meixner et al. (2006) Meixner, M., Gordon, K. D., Indebetouw, R., et al. 2006, AJ, 132, 2268
- Minamidani et al. (2007) Minamidani, T., Mizuno, N., Mizuno, Y., et al. 2007, ArXiv e-prints, 710
- Mizuno et al. (2001) Mizuno, N., Yamaguchi, R., Mizuno, A., et al. 2001, PASJ, 53, 971
- Mochizuki et al. (1994) Mochizuki, K., Nakagawa, T., Doi, Y., et al. 1994, ApJ, 430, L37
- Mookerjea et al. (2006) Mookerjea, B., Kramer, C., Röllig, M., & Masur, M. 2006, A&A, 456, 235
- Pak et al. (1998) Pak, S., Jaffe, D. T., van Dishoeck, E. F., Johansson, L. E. B., & Booth, R. S. 1998, ApJ, 498, 735
- Pardo et al. (2004) Pardo, J. R., Wiedner, M. C., Serabyn, E., et al. 2004, ApJS, 153, 363
- Pineda & Bensch (2007) Pineda, J. L. & Bensch, F. 2007, A&A, 470, 615
- Pineda et al. (2008) Pineda, J. L., Ott, J., Klein, U., et al. 2008, ApJ Submitted
- Röllig et al. (2006) Röllig, M., Ossenkopf, V., Jeyakumar, S., Stutzki, J., & Sternberg, A. 2006, A&A, 451, 917
- Schröder et al. (1991) Schröder, K., Staemmler, V., Smith, M. D., Flower, D. R., & Jaquet, R. 1991, J.Phys.B, 24, 2487
- Simon et al. (2007) Simon, R., Graf, U., Kramer, C., Stutzki, J., & Onishi, T. 2007, in NANTEN technical report, 13.2.2007, Vol. 1,1
- Stanimirović & Lazarian (2001) Stanimirović, S. & Lazarian, A. 2001, ApJ, 551, L53
- Stanimirović et al. (2000) Stanimirović, S., Staveley-Smith, L., van der Hulst, J. M., et al. 2000, MNRAS, 315, 791
- Stark et al. (1997) Stark, A. A., Bolatto, A. D., Chamberlin, R. A., et al. 1997, ApJ, 480, L59
- Störzer et al. (1996) Störzer, H., Stutzki, J., & Sternberg, A. 1996, A&A, 310, 592
- Stutzki et al. (1998) Stutzki, J., Bensch, F., Heithausen, A., Ossenkopf, V., & Zielinsky, M. 1998, A&A, 336, 697
- Stutzki et al. (1997) Stutzki, J., Graf, U. U., Haas, S., et al. 1997, ApJ, 477, L33+
- Stutzki et al. (1988) Stutzki, J., Stacey, G. J., Genzel, R., et al. 1988, ApJ, 332, 379
- Stutzki & Winnewisser (1985) Stutzki, J. & Winnewisser, G. 1985, A&A, 144, 13
- van der Marel & Cioni (2001) van der Marel, R. P. & Cioni, M.-R. L. 2001, AJ, 122, 1807
- van Dishoeck & Black (1988) van Dishoeck, E. F. & Black, J. H. 1988, ApJ, 334, 771
- Vermeij et al. (2002) Vermeij, R., Peeters, E., Tielens, A. G. G. M., & van der Hulst, J. M. 2002, A&A, 382, 1042
- Walmsley et al. (2000) Walmsley, C. M., Natta, A., Oliva, E., & Testi, L. 2000, A&A, 364, 301
- Westerlund (1997) Westerlund, B. E. 1997, The Magellanic Clouds (New York: Cambridge Univ. Press)
- Williams et al. (1994) Williams, J. P., de Geus, E. J., & Blitz, L. 1994, ApJ, 428, 693
- Wright et al. (1991) Wright, E. L., Mather, J. C., Bennett, C. L., et al. 1991, ApJ, 381, 200
- Yamaguchi et al. (2001) Yamaguchi, R., Mizuno, N., Onishi, T., Mizuno, A., & Fukui, Y. 2001, PASJ, 53, 959
- Young Owl et al. (2000) Young Owl, R. C., Meixner, M. M., Wolfire, M., Tielens, A. G. G. M., & Tauber, J. 2000, ApJ, 540, 886